Download presentation
Presentation is loading. Please wait.

1
April 2014 The four health systems of the United Kingdom: how do they compare?

2
Overview: the policy context Following devolution in 1999, the four countries of the UK have taken different policy approaches to running their health care systems: England: quasi-market in health care developed patient choice uses private providers has means-tested social care prescriptions are paid for uses performance targets and applied sanctions for poor performance Scotland: no quasi-market in health care use of performance targets and applied sanctions for poor performance from 2006 free social care for over-65s prescriptions are free

3
Overview: the policy context Wales: no quasi-market in health care use of performance targets prescriptions are free Northern Ireland: no quasi-market in health care use of performance targets prescriptions are free use of competition and promotion of patient choice The report also analyses the North East of England as a comparator to the devolved countries, chosen because it shares many characteristics with them. This research is the only longitudinal analysis of its kind, based on over 20 indicators comparing the performance of the countries over the past two decades.

22
Summary – 1 The research finds: There have been improvements in the performance of the health services across all four countries, with particular progress linked to tougher sanctions and targets in Scotland, but since 2010 waiting times in Wales have risen as austerity has set in. The performance gap between the NHS in England and the rest of the UK has narrowed in recent years, with no single country consistently ahead of the others. Spending on health care All countries substantially increased investment in their health systems, doubling in cash terms (not adjusted for inflation) the amount spent on health care across the UK between 2000/01 and 2012/13, and investing in more staff. There have been divergent spending decisions, with Scotland spending almost £900 million from the money notionally available for health on other services or on making existing services free of charge (including free personal care for older people), and Wales spending around £450 million on other services. Spending across the board has slowed in response to austerity.
 the amount spent on health care across the UK between 2000/01 and 2012/13, and investing in more staff. There have been divergent spending decisions, with Scotland spending almost £900 million from the money notionally available for health on other services or on making existing services free of charge (including free personal care for older people), and Wales spending around £450 million on other services. Spending across the board has slowed in response to austerity..")
23
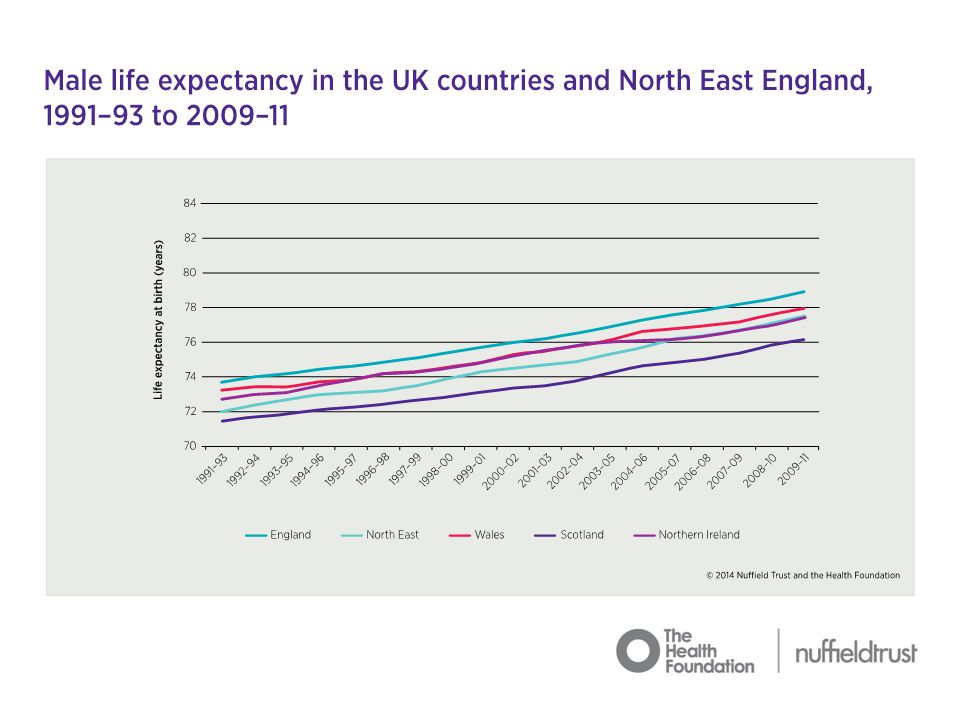
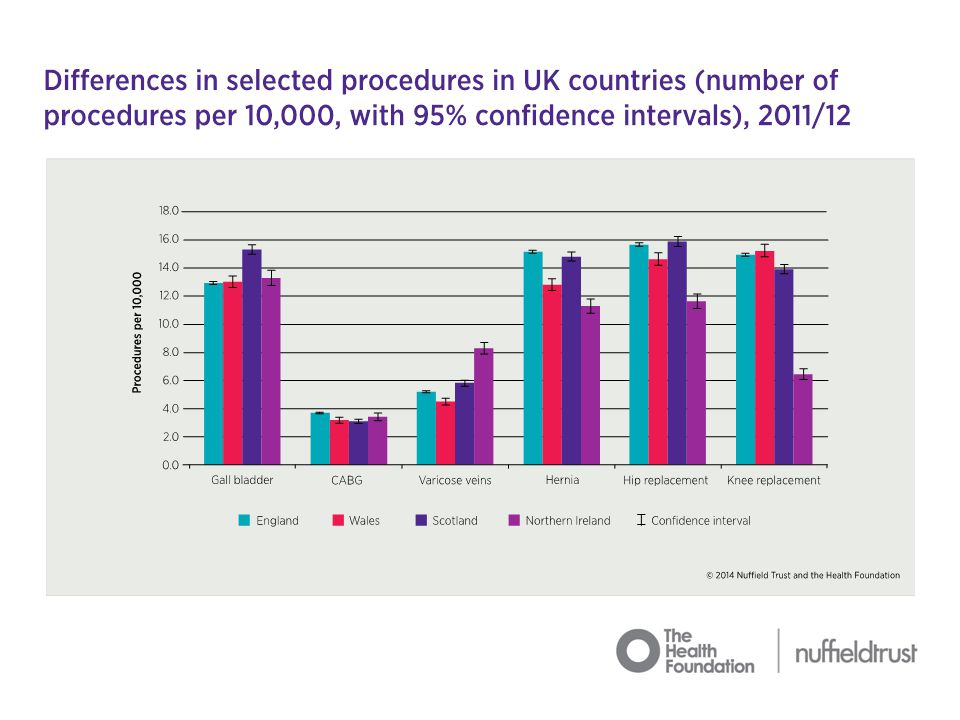
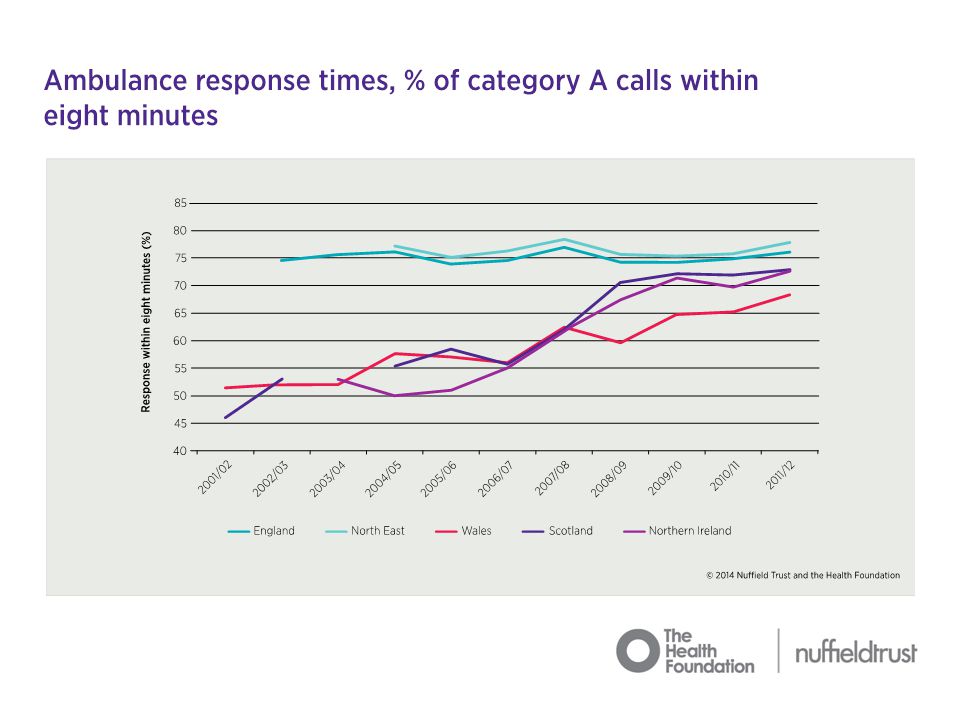
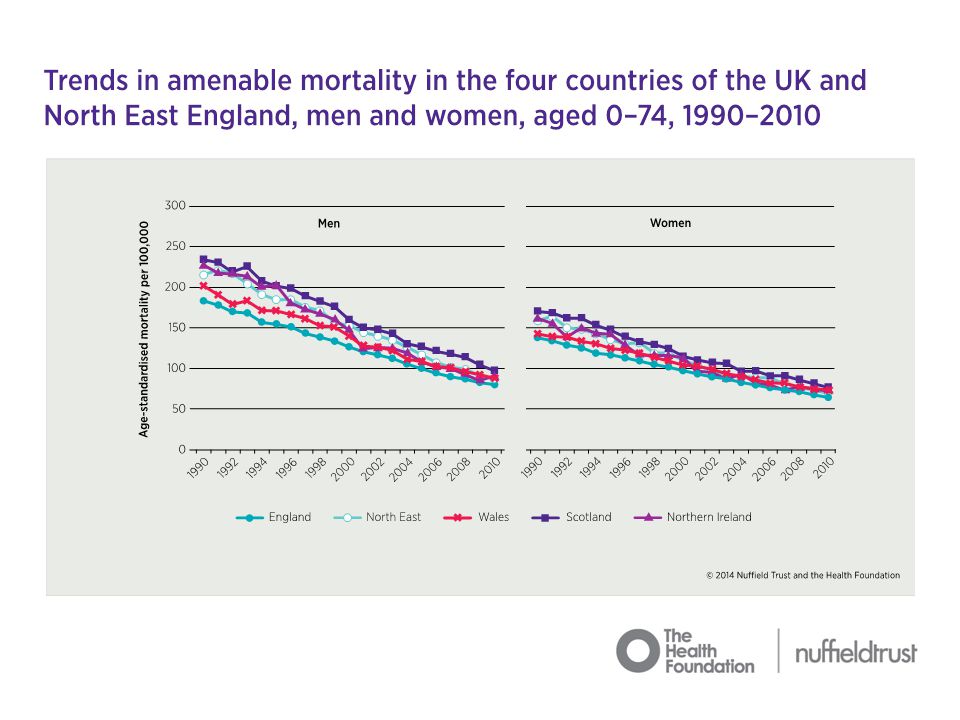
Summary – 2 Since our previous research in 2010, the report found: England performs marginally better across a number of key indicators, including amenable mortality rates (avoidable deaths), life expectancy and ambulance response times. Nurse staffing levels have been lower in England than in the other three countries over the period studied. Scotland shows a marked upturn in performance on indicators associated with targets and performance management, such as waiting times for planned surgery, which now broadly match England’s, and ambulance response times. Wales demonstrates improved performance on a number of indicators, but shows deteriorating performance on waiting times since 2010, with striking rises in waits for common procedures such as knee or hip operations. In 2012/13 a typical Welsh patient waited about 170 days for a hip or knee replacement, compared to about 70 days in England and Scotland. Northern Ireland has improved performance on most indicators, but MRSA rates remain higher than both England and Wales. There are no comparable waiting time data for Northern Ireland in recent years.

24
Summary – 3 North East England The North East has benefited from higher investment in health care than the average for England, now spending similar amounts to Scotland (£2,150 per head in 2012/13 compared to £2,115 in Scotland, while the English average was £1,912). The region saw marked improvements during the 2000’s in treatment rates, hospital staffing, mortality rates and life expectancy. In the 1990s, its overall mortality rates were similar to Scotland’s, but by 2010 these rates were 15 to 19 per cent higher in Scotland. The region had similar life expectancy to Scotland in 1991, but by 2011 men and women lived a year longer than their Scottish neighbours.

25
April 2014

Similar presentations


>")

