Download presentation
Presentation is loading. Please wait.

1
7: Atomic and Nuclear Physics
7.2 Radioactive Decay

2
Radioactivity Radioactive Decay
1895 – Wilhelm Roentgen creates and discovers X-ray radiation, using an electrical energy source. 1896 – Henri Becquerel discovers that some Uranium compounds emit radiation without the need for an external energy source. In 1898 this effect was termed ‘radioactivity’ by Marie Curie. Radioactivity: “The spontaneous emission of radiation by a material”

3
Radiation Radiation is emitted by elements with unstable nuclei in an attempt to loose energy and so gain stability. When radiation is emitted and the nucleus of the atom changes we say it has decayed. There are three types of radiation: - Alpha (α) - Beta (β) - Gamma (γ) Electromagnetic wave Involve particles
 - Beta (β) - Gamma (γ) Electromagnetic wave. Involve particles.")
4
Alpha decay - When a nucleus emits an alpha particle, it loses two protons and two neutrons. So the nucleon number decreases by four and the proton number by two. - Energy of α particle is around 6 MeV. This is very high for such a small particle and so if contact is made with human cells, much damage can be done due to the high degree of ionisation that will be caused. α

5
Beta decay - When a nucleus emits a beta minus particle, a neutron turns into a proton plus an electron and an anti-neutrino (nu - – a virtually massless particle with no charge). The electron is emitted (at high speed) as the beta minus particle. - nucleon number is unchanged - proton number goes up by one - Although they move much faster than alpha particles, β particles create less ionisation due to their small mass.

6
3. Gamma emission – After an alpha or beta particle have been emitted, the new nucleus may be left in a very excited state due it to having excess energy. This energy may be emitted as a burst of gamma radiation- a gamma photon. Gamma does not cause a change in the structure of the nucleus. - Gamma produces very little ionisation but is very penetrating.

11
He Fe Nuclear Stability
Q. Write down the neutron number (N) and proton number (Z) for these stable nuclides: For Helium N = Z For Iron N > Z 4 2 He 56 26 Fe
 and proton number (Z) for these stable nuclides: For Helium N = Z. For Iron N > Z He Fe.")
12
For nuclear stability…
Very light nuclei: N = Z Heavier nuclei: N > Z The green region shows nuclides with too many neutrons. Beta particle emission causes N to decrease by one and Z to increase by one. This changes the nuclide and moves it into the band of stability.

13
Nitrogen–17 is a radioactive isotope of nitrogen.
Q. Nitrogen–17 is a radioactive isotope of nitrogen. Would it become stable if it emitted a Beta particle? What element would the new daughter nuclide be?

14
Decay Chains A nucleus may undergo a series of decays before it becomes stable. This is known as a decay chain.

15
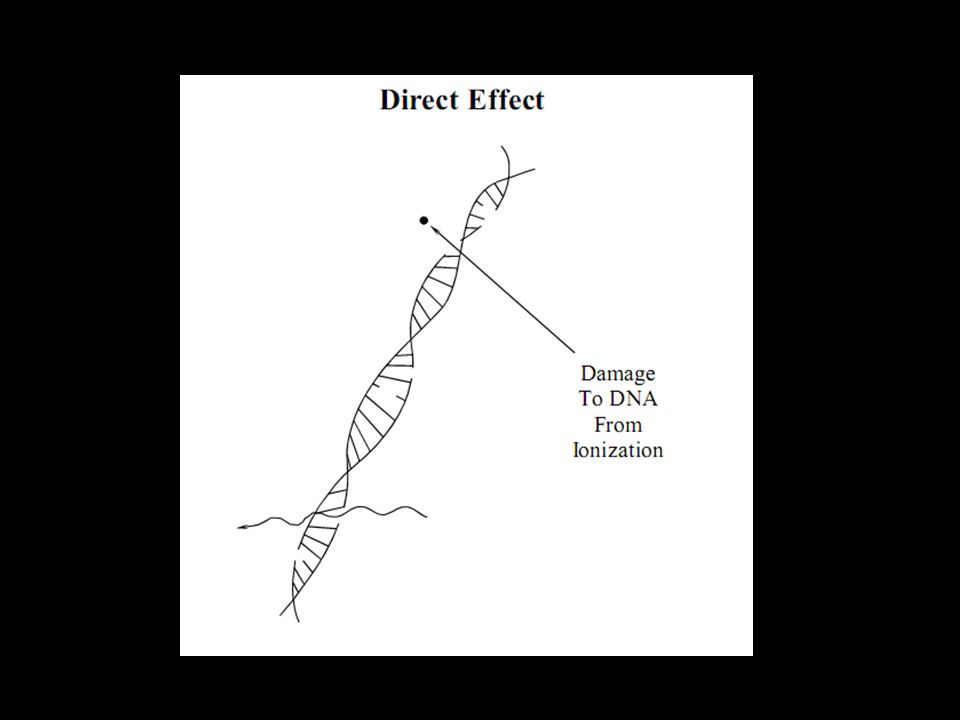
Biological effects of radiation

17
Some of the new compounds formed may be toxic, contributing to destruction of cells (e.g hydrogen peroxide H2O2)
")
19
High dose of radiation:
- Organs and central nervous system fail to function. Death within days. Medium dose of radiation: - Some organs don’t function properly including parts of digestive system. Sickness and possibly death in weeks. Low dose of radiation: - Hair loss, internal bleeding and some sickness. Low chance of immediate death but high chance of cancer later in life. Safe dose of radiation: - Very low doses carry little risk e.g from X-rays or background radiation. There is still some chance of ionisation.

20
Half Life Radioactive decay is a completely random process thus it is not possible to predict which nucleus will decay next. However, due to the large number of nuclei involved, a statistical pattern is established. Task: Use dice or the ‘radiation lab’ computer model of radioactive decay to take results, plot a decay curve and determine the half life of the sample. The half life of a material is the average time taken for half of the radiocative nuclei within a sample to decay. All Pu ½ Pu ½ Am All Am 13 Years Many, many years!

21
Text (An asymptotic curve)
")
22
Activity The activity of a sample is a measure of how many counts of radiation are emitted per second. Thus the activity is proportional to the number of radioactive nuclei remaining. So a graph of activity against time would also enable us to determine half life. Q. Sketch a graph to show how a decay curve may look if the background count was not compensated for.

23
Sub Title text

24
Sub Title text

25
Sub Title text

26
Sub Title text

27
Sub Title text

28
Sub Title text

29
Sub Title text

Similar presentations


>")


 Symbol Mass (in.>")
 Discovered a mysterious form of radiation was given off even without electron beam. This radiation.>")

