Download presentation
Presentation is loading. Please wait.

1
A ND ITS A PPLICATIONS

3
Demonstrate how goods from one industry are consumed in other industries. Rows of the matrix represent producing sector of the economy Columns of the matrix represent consuming sector of the economy One vector of the matrix represents the internal demand Models what would happen if a producer increases or decreases the price of a good I NPUT O UTPUT M ATRICES

4
S1S2...SnS1S2...Sn S 1 S 2... S n ( ) a 11 a 12... a 1n a 21 a 22... a 2n... a n1 a n2... a nn The entry a ij represents the percent total production value of sector j is spent on products of sector i

5
[ ] = [ ] + [ ] Amount produced Final demand Internal demand
![[ ] = [ ] + [ ] Amount produced Final demand Internal demand](http://images.slideplayer.com/9/2575127/slides/slide_5.jpg "[ ] = [ ] + [ ] Amount produced Final demand Internal demand")
7
Refers to connections between quantities and prices that arise as a consequence of the hypotheses of optimization and convexity Derives convex functions involving mappings and vectors to determine cost, profit, and production Finds an equilibrium of the market and optimal values of supply and demand Involves proofs of several lemmas (Hotelling’s lemma and Shephard’s lemma to name a few!)
")
8
If ( x, y) ∈ nm(p, w) = ndF ∗ (p, w), then (p, w) ∈ ndF ∗∗ (x, y) = ndF(x, y). Then dF(x, y) + (p, w) · (( x′, y′) − (x, y)) ≤ dF(x′, y′) for all (x′, y′). This implies that x ∈ F and furthermore that (p, w) · ( ( x′, y′) − (x, y)) ≤ 0 for all ( x, y) ∈ F, in other words, that ( x, y) is profit- maximizing at prices (p, w). Conversely, suppose that (x, y) is profit maximizing at prices ( p, w). Then (p, w) satisfies the subgradient inequality of dF at (x, y), and so (p, w) ∈ ndF. Consequently, ( x, y) ∈ ndF ∗ (p, w) ≡ nm(p, w). H OTELLING ’ S L EMMA Result of duality Asserts the net supply function of good i as the derivative of the profit function with respect to the price of good i
 + (p, w) · (( x′, y′) − (x, y)) ≤ dF(x′, y′) for all (x′, y′). This implies that x ∈ F and furthermore that (p, w) · ( ( x′, y′) − (x, y)) ≤ 0 for all ( x, y) ∈ F, in other words, that ( x, y) is profit- maximizing at prices (p, w). Conversely, suppose that (x, y) is profit maximizing at prices ( p, w). Then (p, w) satisfies the subgradient inequality of dF at (x, y), and so (p, w) ∈ ndF. Consequently, ( x, y) ∈ ndF ∗ (p, w) ≡ nm(p, w). H OTELLING ’ S L EMMA Result of duality Asserts the net supply function of good i as the derivative of the profit function with respect to the price of good i.")
10
T HE S CIENCE OF S TRATEGY Started by Princeton mathematician John Von Neumann Mathematically & logically determines the actions that “players” should take for best personal outcomes in a wide array of “games” Mathematically analyzes interdependence of player strategy to optimize gains Interdependent strategies can be sequences or simultaneous functions

11
1. Probability 2. Set Theory 3. Trees and Graphs 4. Linear Algebra 5. Theorems and their Proofs P ROBABILITY Example: Die Rolling Game You put up your own money; even rolls lose $10 * the roll, odd rolls win $12 * the roll. Should you play? This specific example involves random variables, mean, and calculation of the expectation. Other aspects of game theory, however, include power sets, conditional probability, union and intersection of probability, Bayes Rule, and more! S ET T HEORY Example: Utility Theory Utility theory mainly involves Lotteries: L = {{A 1, A 2, …, A n }, p } A lottery is a set containing all possibilities of outcomes and their respective probabilities. Unions, intersections, difference, Cartesian products, and power sets are all used to calculate the optimal choices for players in a given game. T REES AND G RAPHS Used to map possible choices and their resulting outcomes. Examples include: L INEAR A LGEBRA Example: Saddle Points and Zero-Sum Games In zero-sum games, the winner’s gains are equal to the loser’s loss, resulting in a “zero-sum”. Game choices can be represented by matrices whose vectors are manipulated to calculate saddle points: equilibrium strategy pairs (x, y). T HEOREMS AND THEIR P ROOFS Some prominent theorems proved in Game Theory include: 1.Bayes Rule 2.Expected Utility Theorem 3.Zermelo’s Theorem 4.Minimax Theorem 5.Brouwer Fixed Point Theorem 6.Nash Equilibrium Theorem All of these involve a foundations style proof!!! (See resource guide for links to proofs!)
. T HEOREMS AND THEIR P ROOFS Some prominent theorems proved in Game Theory include: 1.Bayes Rule 2.Expected Utility Theorem 3.Zermelo’s Theorem 4.Minimax Theorem 5.Brouwer Fixed Point Theorem 6.Nash Equilibrium Theorem All of these involve a foundations style proof!!. (See resource guide for links to proofs!).")
14
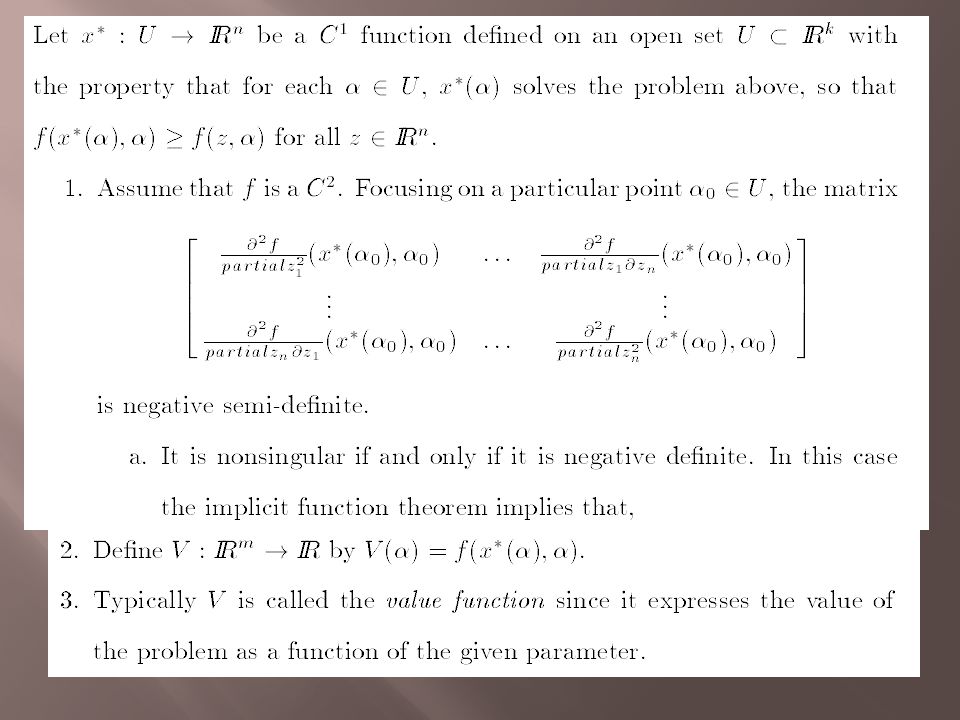
E NVELOPE T HEOREM General principle describing how the value of an optimization problem changes as the parameters of the problem change

19
Actuaries: 1.Evaluate the likelihood of future events using numbers 2.Design creative ways to reduce the likelihood of undesirable events 3.Decrease the impact of undesirable events that do occur Recommended Coursework: Microeconomics, macroeconomics, calculus, linear algebra, calculus-based probability and statistics, actuarial science courses as available, computer science courses Money: Experienced actuaries can make between $150,000 and $250,000 per year!!!

20
Risk Managers: 1.Asses business risks 2.Take measures to control or reduce risks Recommended Degrees: Risk management, finance, mathematics, economics, business Money: Average salary for risk managers is $104,000 with experienced risk managers earning up to $170,000

21
Budget Analysts: 1.Establish the relationships between resources and the organization's mission and functions 2.Analyze accounting reports 3.Write budget justifications 4.Examine budgets and financial plans Recommended Degrees: Accounting, finance, business, economics, statistics, mathematics, political science, or sociology. Money: Average salary for beginners is $70,000

25
Professor Moody Courses: Econometrics Mathematical Economics Time Series Analysis Topics in Mathematical Economics Research: Economics of Crime – the econometric analysis of crime and criminal justice policy Professor Anderson Courses: Game Theory Experimental Economics Research: Nash Equilibrium – survey of recent experimental findings in oligopoly markets

26
Readings on Linear algebra http://www.math.dartmouth.edu/archive/m22f06/public_html/leontief_slides.pdf http://www.math.unt.edu/~tushar/S10Linear2700%20%20Project_files/Davidson%2 0Paper.pdf http://www.math.unt.edu/~tushar/S10Linear2700%20%20Project_files/Davidson%2 0Present.pdf Reading on Duality http://tuvalu.santafe.edu/~leb/Duality2.pdf Readings on Game Theory http://www.econlib.org/library/Enc/GameTheory.html http://www.personal.psu.edu/cxg286/Math486.pdf http://www.gametheory.net/popular/reviews/ChickenMovies.html http://www.pitt.edu/~jduffy/econ1200/Lectures.htm The Envelope Theorem http://cupid.economics.uq.edu.au/mclennan/Classes/Ec5113/ec5113-lec13-3.4.99.pdf

27
Info on Actuarial Science http://www.beanactuary.org/study/?fa=education-faqs http://actuarialgrads.com/actuaries%20- %20US%20Dept%20of%20Labor%20Occupational%20Handbook%20Information.htm Info on Risk Management http://financecareers.about.com/od/compliance/a/riskmanager.htm Info on Budget Analysis http://www.budgetanalyst.com/careers.htm http://www.bls.gov/ooh/business-and-financial/budget-analysts.htm Mathematical Economics at William and Mary http://www.wm.edu/as/economics/documents/handbook_2011.pdf http://www.wm.edu/as/mathematics/undergrad/major/appliedmath/index.phphttp://www.wm.edu/as/mathematics/undergrad/major/appliedmath/index.php: “To a large degree, economics and finance are now the study of specialized mathematical models, and the social sciences use game theory, probability, and statistics as the organizing tools for much of their research. The same is true of industrial applications. Without the insights of operations research, modern industry would not be able to achieve the levels of efficiency required to prosper” http://mason.wm.edu/programs/undergraduate/admissions/requirements/index.php http://www.wm.edu/offices/registrar/documents/catalog/catalogbydept/economics.pdf https://catalog.swem.wm.edu/Record/1088186

Similar presentations


>")


 Week 1 July 24, 2008 Room 323, Bldg 3 Semester 2, 2008 Instructor: Dr Shino Takayama.>")


 Lecturer: Ekaterina Vladimirovna Sokolova (Public Administration Department)>")


