Download presentation
Presentation is loading. Please wait.

1
L ESSON #9: W HAT D O S AMPLES T ELL U S ? Watch out for bias… I’m used to estimate for the population

2
P ARAMETERS A parameter is a number which describes a population. The parameter is a fixed number, but usually the value is not known.

3
S TATISTICS A statistic is a number which describes a sample. The statistic is known when a sample is taken. The statistic can change from sample to sample. The statistic can be used to estimate the parameter (that is, make generalized statements about the population).
..")
4
P AND P-H AT The proportion of a population is a parameter = p The proportion of a sample is a statistic = p-hat. Can be used as an estimate when p is unknown. P-hat = # in sample that met need / # in sample

5
P AND P-H AT The value of p-hat will vary from sample to sample. Too much variability will produce untrustworthy results. Random sampling attacks bias (that is, by choosing randomly, you reduce “favoritism”). By taking lots of random samples of the same size from the same population, the variation from sample to sample follows a predictable pattern.
. By taking lots of random samples of the same size from the same population, the variation from sample to sample follows a predictable pattern..")
6
G ALLUP P OLL E X. According to Gallup, “57% of Americans have bought a lottery ticket in the last 12 months”. This claim was made about the population of 200 million adults. 1523 people were chosen at random to be surveyed. Gallup turned up the fact that 57% of the sample bought lottery tickets into an estimate that about 57% of all adults bought tickets. Gallup used a fact about a sample to estimate the truth about the whole population.

7
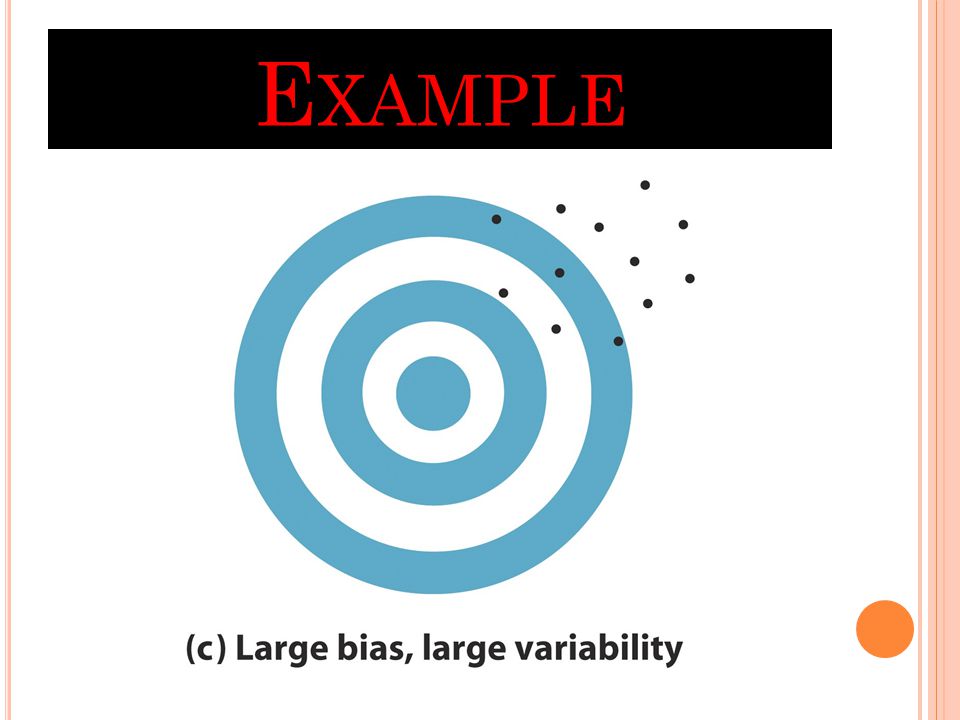
T WO TYPES OF ERROR IN ESTIMATION Bias: consistent, repeated deviation of the sample statistic from the population parameter in the same direction when we take many samples.

8
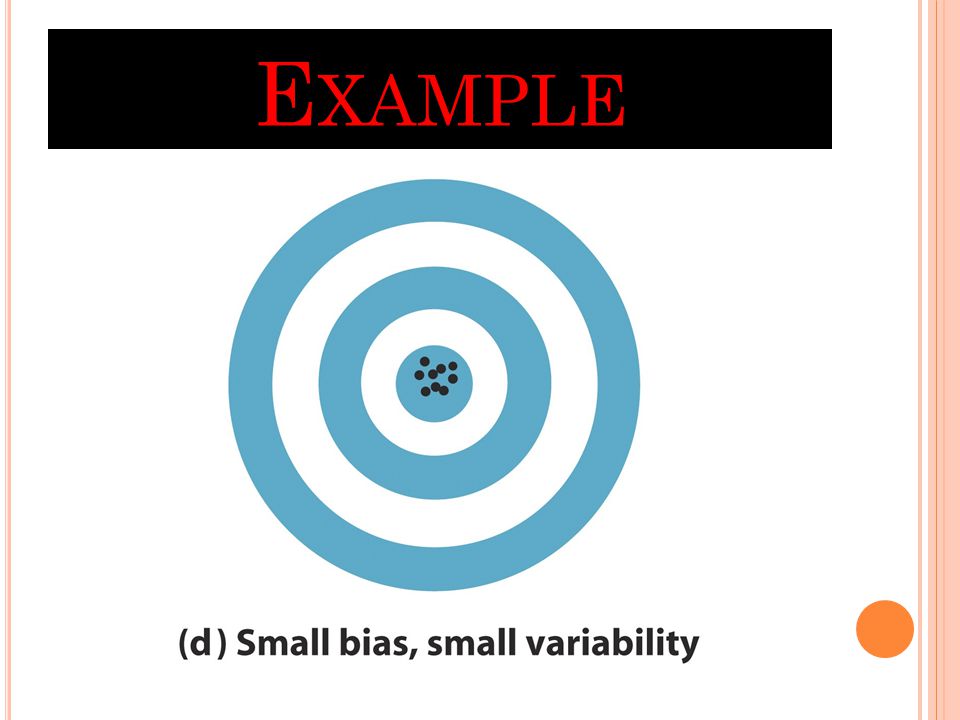
T WO TYPES OF ERROR IN ESTIMATION Variability: describes how spread out the values of the sample statistic are when we take many samples. Large variability means that the result of sampling is not repeatable. A good sampling method has both small bias and small variability.

9
E XAMPLE

13
M ANAGING BIAS AND VARIABILITY To reduce bias: Use random sampling. Using a list of the entire population for an SRS produces unbiased estimates. To reduce variability: Use a large sample. Population must be 10 times as large as sample for size to not be a factor on variability. Large random samples almost always give an estimate that is close to the truth.

14
M ARGIN OF ERROR “If we took many samples using the same method we used to get this one sample, 95% of the samples would give us a result within plus or minus x percentage points of the truth about the population.” “We are 95% confident that …” Quick equation: (n is the size of the sample)
")
15
M ARGIN OF ERROR In many surveys (i.e., Gallup), the margin of error is rounded to the nearest whole number. To cut the margin of error in half, we must use a sample size 4 times as large.

16
T RY THESE Margin of error for sample sizes… 1000 150 520 Answers: Sample size 1000 = margin of error 0.03=3% Sample size 150 = margin of error 0.08=8% Sample size 520 = margin of error 0.04=4%

17
C ONFIDENCE S TATEMENTS Contains 2 parts: Margin of error – how close the sample statistic lies to the population parameter. Level of confidence – what percent of all possible samples satisfy the margin of error.

18
C ONFIDENCE S TATEMENTS The conclusion applies to the population, not to the sample. The conclusion is never completely certain. You can use other confidence levels (not just 95%). If not given, the confidence level in most studies is 95%.
. If not given, the confidence level in most studies is 95%..")
19
E XAMPLE … According to Gallup, “57% of Americans have bought a lottery ticket in the last 12 months”. This claim was made about the population of 200 million adults. 1523 people were chosen at random to be surveyed. 1/ √n = 1/√1523 = 0.026 ≈ 0.03

20
S TATEMENTS … We are 95% confident that 57% of US adults bought a lottery ticket in the past 12 months, plus or minus 3%. We are 95% confident that 54% - 60% of US adults bought a lottery ticket in the past 12 months.

21
H OMEWORK Page 86, #2.25-2.29 Page 94-95, #2.35-2.39

Similar presentations


>")