Download presentation
Presentation is loading. Please wait.

1
Automatic Color Gamut Calibration Cristobal Alvarez-Russell Michael Novitzky Phillip Marks

2
Inspiration G. Klein and D. Murray, Compositing for Small Cameras, ISMAR'08

3
Motivation Calibrate and compensate for: Color distortions of a small video camera Lighting conditions of environment Purpose: Augmented Reality Matching the color gamut of virtual objects to video camera image Robotics Calibrating a video camera for particle-filter-based object tracking (i.e. orange ball in robot soccer)
.")
4
Approach GretagMacbeth ColorChart Diffuse material Color samples under daylight RGB values are known

5
Approach (cont.) 1Start with picture of a scene with the chart 2Locate the squares of the chart in the image 3Unproject and crop the chart 4Sample the colors in the chart 5Adjust the color of the entire image (and subsequent ones)
 1Start with picture of a scene with the chart 2Locate the squares of the chart in the image 3Unproject and crop the chart 4Sample the colors in the chart 5Adjust the color of the entire image (and subsequent ones)")
6
Locating the Chart Failed Attempts Swain’s Histogram Back-projection Color constancy a big problem Tried color constancy approximations Not good for color chart Too many histogram matches -> false positives Only returned a point within the square We hoped it would be an estimation of the center of the chart No information useful for unprojection

7
Locating the Chart (cont.) Original image
 Original image")
8
Locating the Chart (cont.) Color constancy Color normalization
 Color constancy Color normalization")
9
Locating the Chart (cont.) False positives Ratios high because of wide chart histogram
 False positives Ratios high because of wide chart histogram")
10
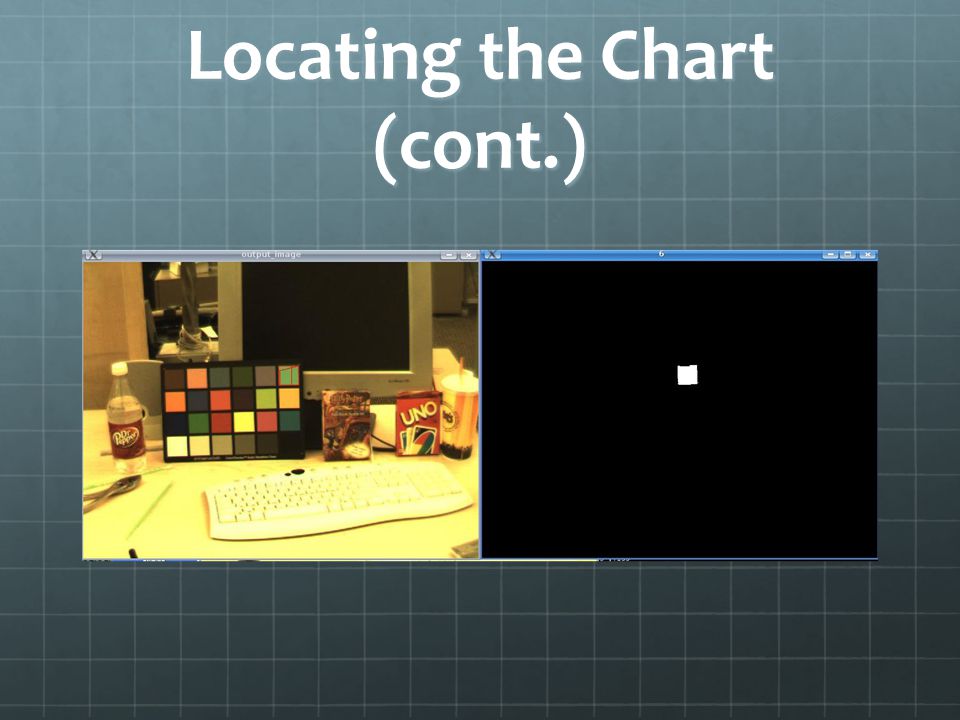
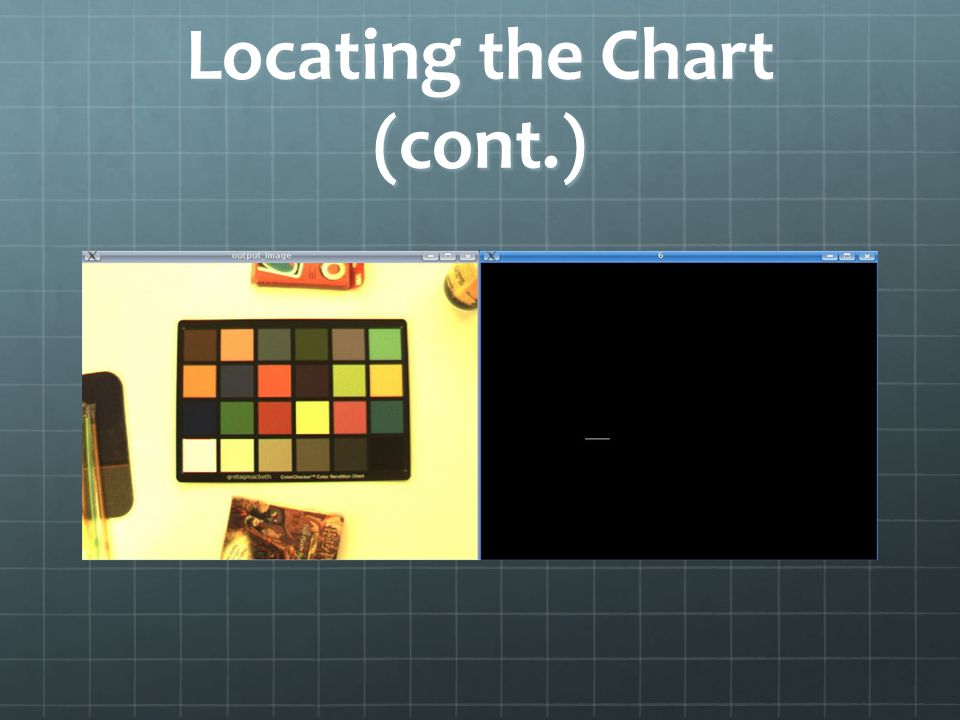
Locating the Chart (cont.) Result not useful for feature extraction Not a good estimate of the center of the chart
 Result not useful for feature extraction Not a good estimate of the center of the chart")
11
Locating the Chart (cont.)
")
12
Current approach First step: User interface User clicks and labels squares Flood fill Uses histogram Create screen-aligned bounding box

13
Locating the Chart (cont.)
")
16
Second step: Connected components Sweep through the image Label neighboring pixels that are activated Choose the connected component with the highest vote

17
Locating the Chart (cont.)
")
19
Third step: Recognize regions We need to find the corners of the region within the bounding box First attempt: Draw lines from bounding box corners and vote on likelihood of region edge Failed! Second attempt: Look for region corner iteratively from bounding box corner Success!

20
Locating the Chart (cont.)
")
24
Unprojecting the chart Start with corners of some color regions Construct a matrix A composed of image and world point correspondences Compute homography matrix from null space of A SVD to compute it Use inverse homography to unproject each pixel

25
Unprojecting the chart (cont.) Problems: OpenCV matrices are not good for numerical methods Switched to GSL Noise in region corner positions Remove smallest eigenvalue of singular matrix Squares in the middle of the chart better
 Problems: OpenCV matrices are not good for numerical methods Switched to GSL Noise in region corner positions Remove smallest eigenvalue of singular matrix Squares in the middle of the chart better")
26
Unprojecting the chart (cont.)
")
28
Sampling the chart We sample at square centers Squares centers estimated by predefined, specific ratios of the chart We assume the homography and the unprojection are good enough Stochastic sampling We average several samples to reduce noise influence

29
Sampling the chart (cont.)
")
32
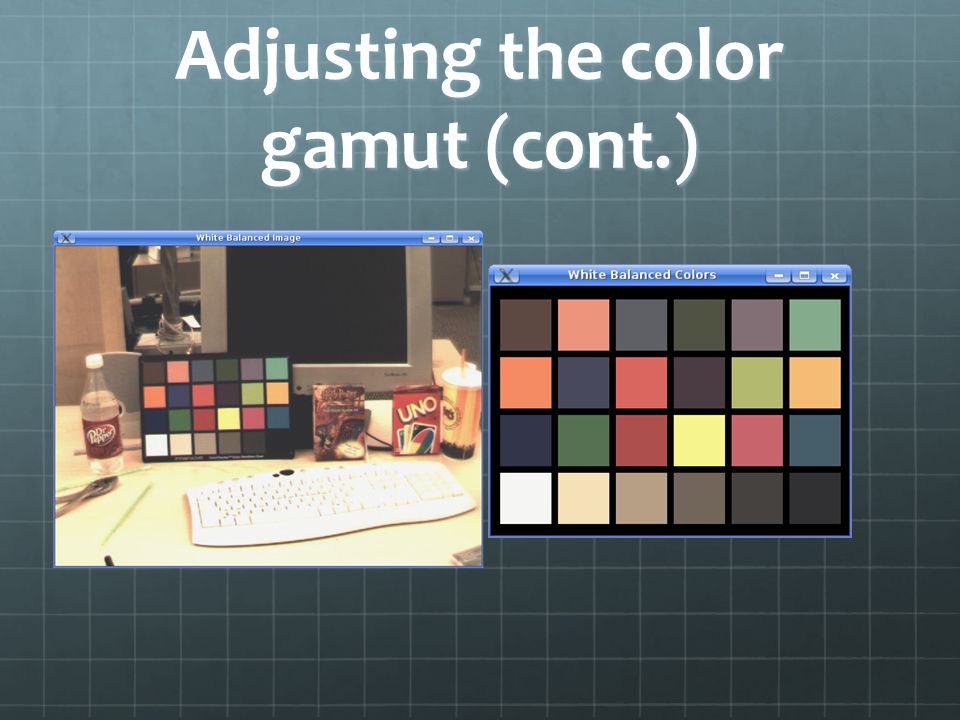
Adjusting the color gamut Step 1: Adjust white balance of the samples Simple linear scale Using White 9.5 and Black 32 from color chart Both in chart in image and known RGB values

33
Adjusting the color gamut (cont.)
")
35
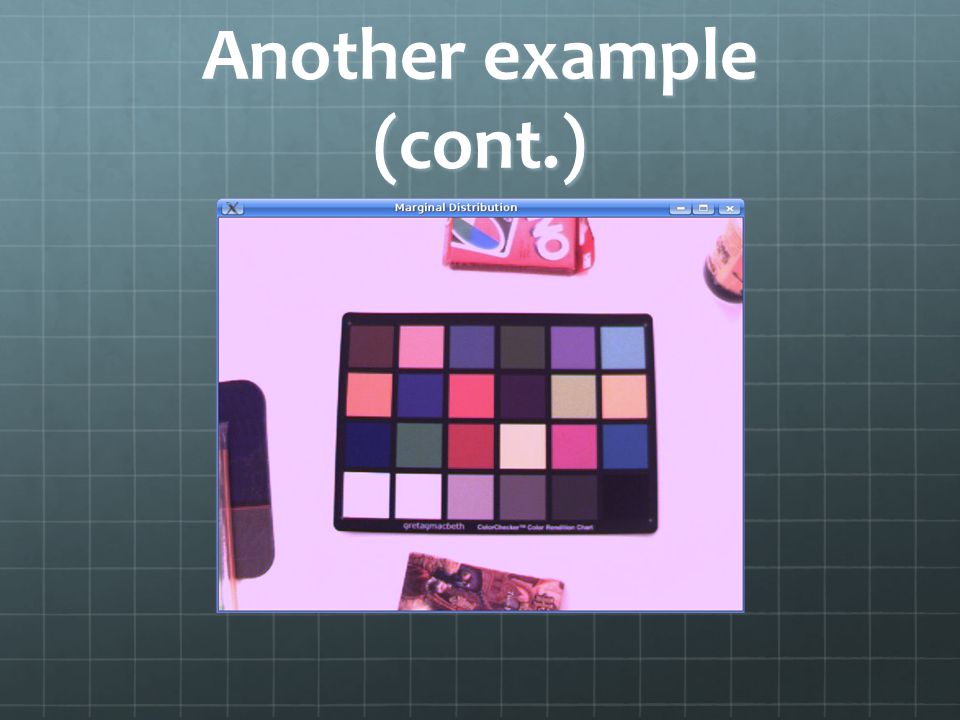
Step 2: Adjust chromaticity Use color samples as a distribution Linear scale of every pixel color according to mean and standard deviation of distribution Color samples from chart do not map to themselves Approach 1: Marginal Distribution Three 1D distributions (one per channel) Treat channels independently from each other Approach 2: Joint Distribution Treat colors as 3D points in RGB cube Standard deviation is a 3D distance from the mean color
 Treat channels independently from each other Approach 2: Joint Distribution Treat colors as 3D points in RGB cube Standard deviation is a 3D distance from the mean color")
36
Adjusting the color gamut (cont.)
")
39
Future Work Locating the color chart Use SIFT-like descriptors with point matching according to the color chart structure Use grid-pattern algorithms like the ones used in fiducial- based tracking (i.e. ARToolkit) Chart unprojection Try iterative homography estimation Color gamut adjustment: Interpolate colors using a tetrahedral mesh Try using color spaces that separate chromaticity from intensity (HSV, YUV, etc.)
 Chart unprojection Try iterative homography estimation Color gamut adjustment: Interpolate colors using a tetrahedral mesh Try using color spaces that separate chromaticity from intensity (HSV, YUV, etc.).")
40
The end!

41
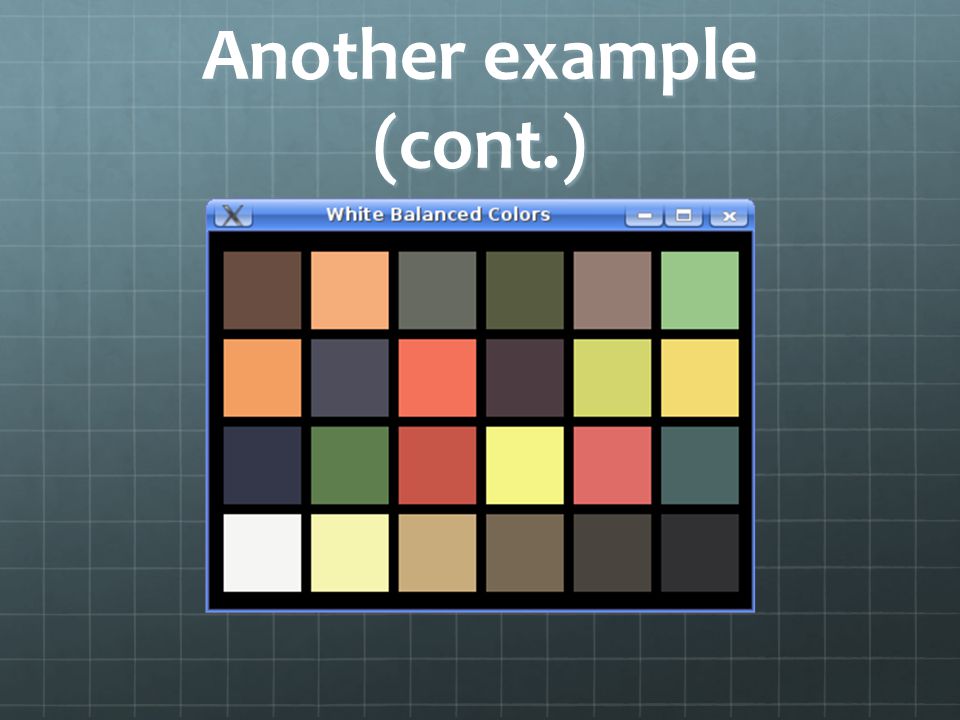
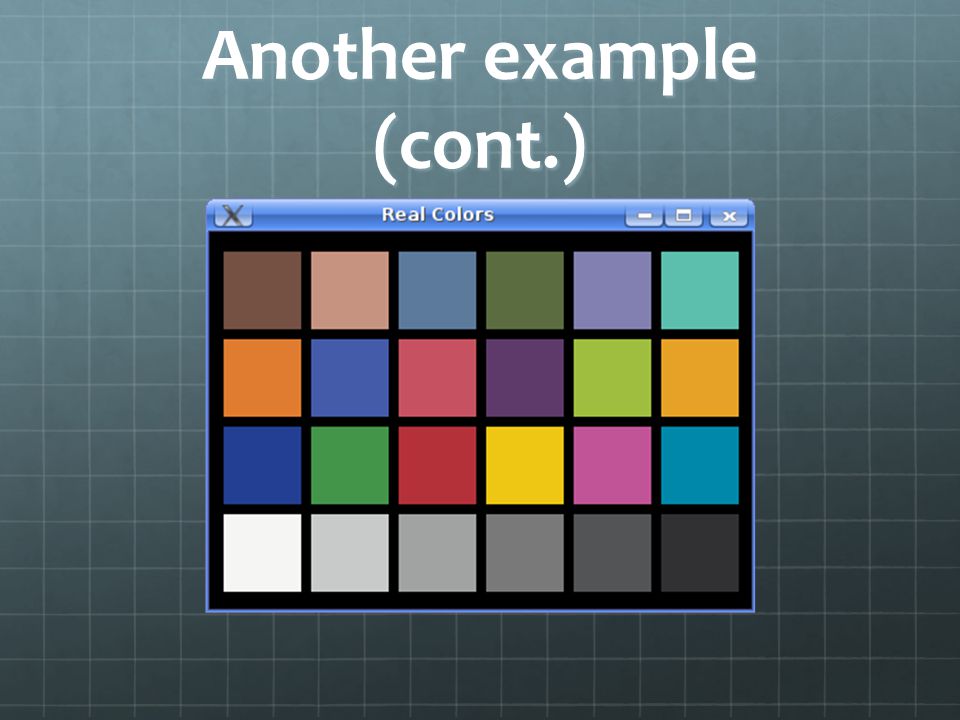
Another example

42
Another example (cont.)
")
Similar presentations


![Exploiting Homography in Camera-Projector Systems Tal Blum Jiazhi Ou Dec 11, 2003 [Sukthankar, Stockton & Mullin. ICCV-2001]](/13/3915772/big_thumb.jpg "Exploiting Homography in Camera-Projector Systems Tal Blum Jiazhi Ou Dec 11, 2003 [Sukthankar, Stockton & Mullin. ICCV-2001]>")


 should be maintained for each image. The image can be indexed.>")

 –division or separation of the image into segments (connected regions) of similar properties.>")


