Download presentation
Presentation is loading. Please wait.

1
ISBRA 2006 HIV and Alcohol Symposium Jeffrey H. Samet, MD, MA, MPH, Chairman Evgeny M. Krupitsky, MD, Phd, Co-Chairman

2
The Impact of Alcohol Consumption on HIV Disease Progression Jeffrey H. Samet, MD, MA, MPH Chief, Section General Internal Medicine Boston Medical Center Professor of Medicine and Public Health Boston University Schools of Medicine and Public Health ISBRA 2006 HIV and Alcohol Symposium

3
Authors Samet JH 1, Cheng DM 1, Libman H 3, Nunes D 1, Alperen J 1, Faber V 6, Saitz R 1 1 Boston Medical Center, Boston University School of Medicine, United States; 2 Beth Israel Deaconess Medical Center, Harvard Medical School, United States; 3 DM-STAT, United States Funded by the National Institute on Alcoholism and Alcohol Abuse: R01- AA13216, R01-AA11785, & R01-AA10870 and USPHS M01-RR00533 (GCRC)
")
4
Background Alcohol use is common among HIV- infected persons Alcohol use is common among HIV- infected persons –36% of HIV-infected veterans (n=881) were current hazardous drinkers* –42% of HIV-infected patients establishing primary care (n=664) had history of alcohol problems** *Conigliaro, Gordon, McGinnis, Rabeneck, Justice. JAIDS. 2003;33:521-525. **Samet, Phillips, Horton, Traphagen, Freedberg. AIDS Res Hum Retroviruses. 2004;20:151-155.

5
*Dingle, Oei. Psychol Bull. 1997;122:56-71. **Samet, Horton, Traphagen, Lyon, Freedberg. Alcohol Clin Exp Res. 2003;27:862-7. Background The impact of alcohol use on HIV disease progression is unclear. The impact of alcohol use on HIV disease progression is unclear. –Pre-HAART (circa 1996), no association found * –Among persons receiving antiretroviral therapy (ART) between 1997-2000 cross-sectional evidence found an association of heavy alcohol use with lower CD4 and higher HVL (HIV viral load).**
, no association found * –Among persons receiving antiretroviral therapy (ART) between cross-sectional evidence found an association of heavy alcohol use with lower CD4 and higher HVL (HIV viral load).**.")
6
Background Potential mechanisms of alcohols impact on disease progression Potential mechanisms of alcohols impact on disease progression –Decreased medication adherence. –Decreased medication adherence. * –Physiological impact is suspected from studies in rhesus macaques. –Physiological impact is suspected from studies in rhesus macaques. * Cook RL, et al. J Gen Intern Med. 2001;16:83-88. Bagby GJ, et al. Alcohol Clin Exp Res. 2003;27:495-502. Stoltz DA, et al. Am J Respir Crit Care Med. 2000;161:135-140.

7
Hypothesis Alcohol consumption is associated with more rapid HIV disease progression: Alcohol consumption is associated with more rapid HIV disease progression: –CD4 decrease –HVL (i.e. HIV RNA) increase
 increase.")
8
Participants & Design Two consecutive prospective cohorts of HIV-infected persons with current or past alcohol problems Two consecutive prospective cohorts of HIV-infected persons with current or past alcohol problems HIV-ALC (HIV-Alcohol Longitudinal Cohort): 7/97-7/01 HIV-LIVE (HIV-Longitudinal Interrelationship between Viruses and Ethanol): 8/01-03/06
: 7/97-7/01 HIV-LIVE (HIV-Longitudinal Interrelationship between Viruses and Ethanol): 8/01-03/06")
9
Eligibility criteria Inclusion Criteria Inclusion Criteria –HIV infection –Two or more positive CAGE* responses –Fluent in English or Spanish Exclusion criteria Exclusion criteria –Mini Mental State Examination** score < 21 –Plans to move from area in next year *Ewing. JAMA. 1984;252:1905-07. **Folstein et al. J Psychiatr Res. 1975;12:189-98.

10
Subject Assessment Interview, medical record, and/or phlebotomy at 6-month intervals for up to 7 years (1997-2006) for the following: Interview, medical record, and/or phlebotomy at 6-month intervals for up to 7 years (1997-2006) for the following: –CD4 –HVL –ART –ART adherence –alcohol and drug use
 for the following: Interview, medical record, and/or phlebotomy at 6-month intervals for up to 7 years ( ) for the following: –CD4 –HVL –ART –ART adherence –alcohol and drug use")
11
Primary Outcome Measures CD4 cell count per µL CD4 cell count per µL log 10 HVL (HIV RNA copies per mL) log 10 HVL (HIV RNA copies per mL) Obtained within 3 months of assessment interview Obtained within 3 months of assessment interview
 log 10 HVL (HIV RNA copies per mL) Obtained within 3 months of assessment interview Obtained within 3 months of assessment interview")
12
Primary Independent Variable Past 30-day alcohol use: Past 30-day alcohol use: –Heavy > 4 drinks on any day or >14 drinks/week in men > 4 drinks on any day or >14 drinks/week in men >3 on any day or >7 drinks/week in women >3 on any day or >7 drinks/week in women –Moderate (alcohol use less than heavy) –Abstinent
 –Abstinent")
13
Other Independent Variables Gender Gender Age Age Race (black, white, or other) Race (black, white, or other) HIV risk factor (injection drug use, men having sex with men, or heterosexual behavior) HIV risk factor (injection drug use, men having sex with men, or heterosexual behavior) Homelessness (> 1 night in past 6 months) Homelessness (> 1 night in past 6 months) 3-day adherence to ART (100% adherence, [yes/no]) 3-day adherence to ART (100% adherence, [yes/no]) Time since study enrollment Time since study enrollment Year of study entry Year of study entry Cohort study participation (HIV-ALC vs. HIV-LIVE) Cohort study participation (HIV-ALC vs. HIV-LIVE)
![Other Independent Variables Gender Gender Age Age Race (black, white, or other) Race (black, white, or other) HIV risk factor (injection drug use, men having sex with men, or heterosexual behavior) HIV risk factor (injection drug use, men having sex with men, or heterosexual behavior) Homelessness (> 1 night in past 6 months) Homelessness (> 1 night in past 6 months) 3-day adherence to ART (100% adherence, [yes/no]) 3-day adherence to ART (100% adherence, [yes/no]) Time since study enrollment Time since study enrollment Year of study entry Year of study entry Cohort study participation (HIV-ALC vs.](http://images.slideplayer.com/1/255373/slides/slide_13.jpg "HIV-LIVE) Cohort study participation (HIV-ALC vs. HIV-LIVE).")
14
Analysis Generalized linear mixed effects models Generalized linear mixed effects models Stratified by ART use (on/off) to account for possible effect modification Stratified by ART use (on/off) to account for possible effect modification The data were restricted to observations beginning at baseline until a change in ART usage occurred (i.e., went on or off ART) The data were restricted to observations beginning at baseline until a change in ART usage occurred (i.e., went on or off ART) Regression analyses controlled for baseline CD4 counts Regression analyses controlled for baseline CD4 counts
 to account for possible effect modification Stratified by ART use (on/off) to account for possible effect modification The data were restricted to observations beginning at baseline until a change in ART usage occurred (i.e., went on or off ART) The data were restricted to observations beginning at baseline until a change in ART usage occurred (i.e., went on or off ART) Regression analyses controlled for baseline CD4 counts Regression analyses controlled for baseline CD4 counts")
15
Results: Cohort (N=595) Only in HIV LIVE N=246 Only in HIV ALC N=195 In HIV ALC & HIV LIVE N=154
 Only in HIV LIVE N=246 Only in HIV ALC N=195 In HIV ALC & HIV LIVE N=154")
16
Baseline Characteristics (N=595) Characteristic% Male75 Race Black Black White White Other Other413425 HIV risk group Hetero/Blood Hetero/Blood Inject Drug Inject Drug Men Sex Men Men Sex Men 24 24 54 5421 Currently receiving ART 60
 Characteristic% Male75 Race Black Black White White Other Other HIV risk group Hetero/Blood Hetero/Blood Inject Drug Inject Drug Men Sex Men Men Sex Men Currently receiving ART 60")
17
Baseline Characteristics (N=595) Characteristic Mean (SD) CD4 421 (287.4) HVL (n=557) 153,655 (1,113,963) Log 10 HVL 3.3 (1.2) Age, years 41 (7.4)
 Characteristic Mean (SD) CD4 421 (287.4) HVL (n=557) 153,655 (1,113,963) Log 10 HVL 3.3 (1.2) Age, years 41 (7.4)")
18
Baseline Characteristics (N=595)
")
19
Results: Observations (N=595) CD4 analyses observations = 1495 CD4 analyses observations = 1495 HVL analyses observations = 2031 HVL analyses observations = 2031
 CD4 analyses observations = 1495 CD4 analyses observations = 1495 HVL analyses observations = 2031 HVL analyses observations = 2031")
20
Results: Multivariable Analyses Adjusted mean differences in CD4 and Log 10 HVL associated with alcohol use ART StatusAlcohol consumption CD4 cell count (SE) Log 10 HVL (SE) On ART (n=355) Abstinent-- Moderate12.31 (13.8)0.03 (0.08) Heavy-1.46 (10.9)0.13 (0.07) Not on ART (n=240) Abstinent-- Moderate-27.03 (18.3)-0.11 (0.08) Heavy-53.4 (22) * 0.0003 (0.08) p=0.09 * p=0.02
 Log 10 HVL (SE) On ART (n=355) Abstinent-- Moderate12.31 (13.8)0.03 (0.08) Heavy-1.46 (10.9)0.13 (0.07) Not on ART (n=240) Abstinent-- Moderate (18.3)-0.11 (0.08) Heavy-53.4 (22) * (0.08) p=0.09 * p=0.02")
21
Limitations Participants in the no ART group may have been exposed to these medications in the past but were no longer receiving them at the time of study entry. Participants in the no ART group may have been exposed to these medications in the past but were no longer receiving them at the time of study entry. Observational cohort: possible uncontrolled confounding Observational cohort: possible uncontrolled confounding Inconsistent time frames: alcohol assessed 30 days prior to the interview; CD4 & HIV RNA within 3 months Inconsistent time frames: alcohol assessed 30 days prior to the interview; CD4 & HIV RNA within 3 months

22
Conclusion In those on ART, heavy drinking was possibly associated with higher HVL. In those on ART, heavy drinking was possibly associated with higher HVL. In those not on ART, heavy drinking was associated with lower CD4 cell counts. In those not on ART, heavy drinking was associated with lower CD4 cell counts.

23
Implications Avoiding alcohol consumption at heavy levels may have a beneficial effect on HIV disease progression. Avoiding alcohol consumption at heavy levels may have a beneficial effect on HIV disease progression. Determining the behavioral and/or biological basis for these effects and addressing alcohol use in HIV-infected patients are important research and clinical issues. Determining the behavioral and/or biological basis for these effects and addressing alcohol use in HIV-infected patients are important research and clinical issues.

24
Reduction of risky sexual behavior among hospitalized Russian substance dependent patients The Russian Partnership to Reduce the Epidemic Via Engagement in Narcology Treatment (Russian PREVENT) Study ISBRA-2006 Symposium "Alcohol and HIV" Supported by National Institute on Alcohol Abuse and Alcoholism (NIAAA), NIH: R21-AA014821
 Study ISBRA-2006 Symposium Alcohol and HIV Supported by National Institute on Alcohol Abuse and Alcoholism (NIAAA), NIH: R21-AA014821")
25
Krupitsky E. 1, Cheng D.M. 2, Raj A. 2, Egorova V. 1, Levenson S. 2, Bridden C. 3, Zvartau E, 1 Samet J.H. 2,3 1 St. Petersburg State Pavlov Medical University, Russian Federation; 2 Boston University School of Public Health, United States; 3 Boston University School of Medicine, Boston Medical Center, United States 3 Boston University School of Medicine, Boston Medical Center, United States

28
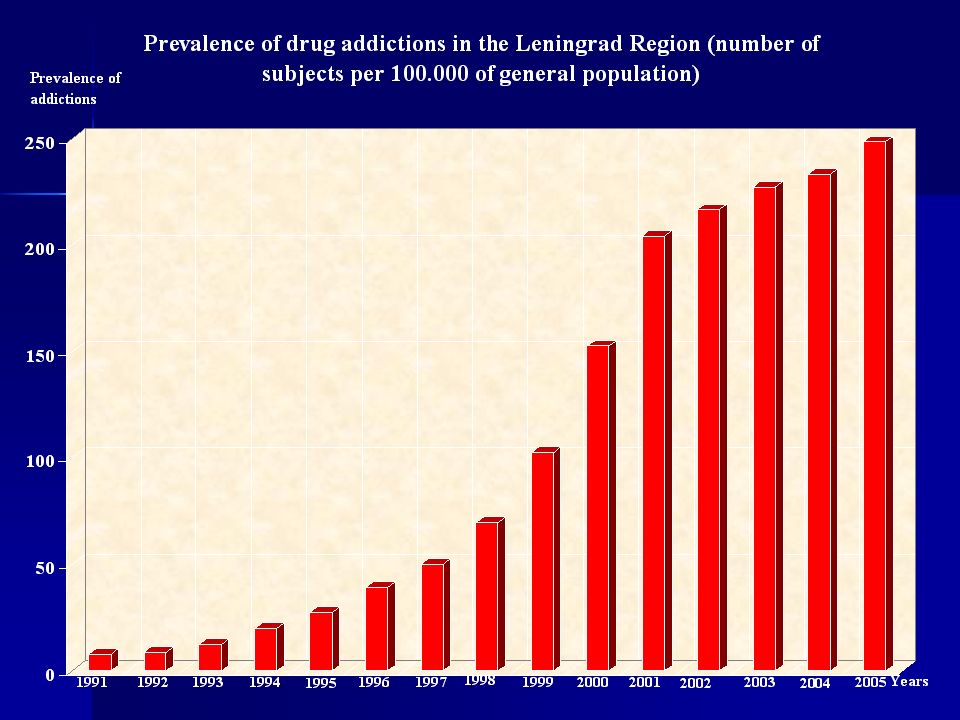
937993 100% 66.7% 0% 100% 66.7% 0% 100% 94.2% 0% 100% 91.2% 0.6% 100% 82.2% 3.6% 100% 66% 3.8% 100% 60% 4.5% 100% 47.4% 4.6% 100% 45% 4% 0% 10% 20% 30% 40% 50% 60% 70% 80% 90% 100% 199719981999200020012002200320042005 Leningrad Regional HIV/AIDS Center Data HIV positive individuals i. v. drug users alcoholics 6651780191215031046

29
Background Russia has one of the highest per capita alcohol consumption rates in the world. Russia has one of the highest per capita alcohol consumption rates in the world. The Russian HIV epidemic is propelled by injection drug use. The Russian HIV epidemic is propelled by injection drug use. Alcohol use may increase high-risk sexual behaviors and promote spreading of HIV from IDUs into the general population. Alcohol use may increase high-risk sexual behaviors and promote spreading of HIV from IDUs into the general population.

30
Background Regional narcology hospitals play a central role in Russia s efforts to address alcohol and drug dependence but have not aggressively addressed HIV. Regional narcology hospitals play a central role in Russia s efforts to address alcohol and drug dependence but have not aggressively addressed HIV. Risky sexual behaviors need to be addressed with effective and feasible interventions among Russian substance dependent persons. Risky sexual behaviors need to be addressed with effective and feasible interventions among Russian substance dependent persons.

31
Purpose To assess the effectiveness of a sexual risk reduction intervention in the Russian narcology hospital setting To assess the effectiveness of a sexual risk reduction intervention in the Russian narcology hospital setting

32
Hypothesis Subjects receiving the intervention will report fewer risky sexual behaviors. Subjects receiving the intervention will report fewer risky sexual behaviors.

33
Design and Setting Randomized controlled trial (RCT) Randomized controlled trial (RCT) Recruited 10/04 through 4/05 Recruited 10/04 through 4/05 Two narcology hospitals in the Leningrad Region of Russia Two narcology hospitals in the Leningrad Region of Russia –Leningrad Region Center for Addictions (LRCA) –Medical Narcology Rehabilitation Center (MNRC) –Narcology hospitals provide 1 week detoxification and 2-3 weeks stabilization.
 Randomized controlled trial (RCT) Recruited 10/04 through 4/05 Recruited 10/04 through 4/05 Two narcology hospitals in the Leningrad Region of Russia Two narcology hospitals in the Leningrad Region of Russia –Leningrad Region Center for Addictions (LRCA) –Medical Narcology Rehabilitation Center (MNRC) –Narcology hospitals provide 1 week detoxification and 2-3 weeks stabilization.")
34
Participants 181 subjects with alcohol and/or heroin dependence 181 subjects with alcohol and/or heroin dependence Eligibility criteria: Eligibility criteria: –age > 18 –unprotected sex in last 6 months –willing to undergo HIV testing –abstinent from substances for > 48 hours

35
Behavioral Intervention Culturally and contextually adapted CDC- endorsed RESPECT brief counseling designed to reduce sex-risk behaviors* Culturally and contextually adapted CDC- endorsed RESPECT brief counseling designed to reduce sex-risk behaviors* Received 30 condoms at baseline Received 30 condoms at baseline 2 intervention sessions at medical center plus 3 monthly booster sessions via telephone 2 intervention sessions at medical center plus 3 monthly booster sessions via telephone

36
Behavioral Intervention Session 1 (30-40 min) Session 1 (30-40 min) –Personal assessment of HIV risk –Increasing HIV risk perceptions –Negotiating a personalized risk reduction plan Session 2 (60 min) Session 2 (60 min) –Provision and discussion of HIV test results; review plan –Promotion of safer sex: condom skills; self-efficacy; emphasizing relationship between alcohol and sexual risk –For HIV-infected subjects: skills building to reduce violence and stigmatization when disclosing to partners –For injection drug users: education and skills building to promote new needle usage and cleaning of needles/works
 Session 1 (30-40 min) –Personal assessment of HIV risk –Increasing HIV risk perceptions –Negotiating a personalized risk reduction plan Session 2 (60 min) Session 2 (60 min) –Provision and discussion of HIV test results; review plan –Promotion of safer sex: condom skills; self-efficacy; emphasizing relationship between alcohol and sexual risk –For HIV-infected subjects: skills building to reduce violence and stigmatization when disclosing to partners –For injection drug users: education and skills building to promote new needle usage and cleaning of needles/works")
37
Behavioral Intervention 3 monthly booster sessions (10-20 min) 3 monthly booster sessions (10-20 min) –Provision of ongoing case management tailored to the individuals stage of readiness to engage in sexual or drug use risk reduction
 3 monthly booster sessions (10-20 min) –Provision of ongoing case management tailored to the individuals stage of readiness to engage in sexual or drug use risk reduction")
38
Control Program Usual addiction treatment, which includes no sexual behavior counseling Usual addiction treatment, which includes no sexual behavior counseling Received 30 condoms at baseline Received 30 condoms at baseline HIV-infected controls received brief post- test counseling HIV-infected controls received brief post- test counseling –Provision and discussion of HIV test results; creation of risk reduction goals –Referral to an HIV care program 3 monthly study check-in phone calls (3 min) 3 monthly study check-in phone calls (3 min)
 3 monthly study check-in phone calls (3 min)")
39
Subject Assessment Assessed at baseline, 3, and 6 months Assessed at baseline, 3, and 6 months Baseline and 6 month assessment via face-to-face interviews with the Risk Assessment Battery and Time Line Follow Back survey. Baseline and 6 month assessment via face-to-face interviews with the Risk Assessment Battery and Time Line Follow Back survey. –HIV risk behaviors additionally assessed by Audio Computer-Assisted Self Interviewing (ACASI) System (to promote truth telling) 3-month assessment interviewer- administered via the telephone 3-month assessment interviewer- administered via the telephone
 System (to promote truth telling) 3-month assessment interviewer- administered via the telephone 3-month assessment interviewer- administered via the telephone.")
40
Outcomes Assessed at 6 months*: Assessed at 6 months*: –Primary: percentage of safe sex episodes percentage of safe sex episodes consistent safe sex (yes/no) consistent safe sex (yes/no) –Secondary: any condom use any condom use number of unsafe sex episodes number of unsafe sex episodes Assessed at 3 months (all secondary) : Assessed at 3 months (all secondary) : –percentage of safe sex episodes –consistent safe sex (yes/no) –any condom use * In the past 3 months, ACASI In the past 3 months, telephone interview
 consistent safe sex (yes/no) –Secondary: any condom use any condom use number of unsafe sex episodes number of unsafe sex episodes Assessed at 3 months (all secondary) : Assessed at 3 months (all secondary) : –percentage of safe sex episodes –consistent safe sex (yes/no) –any condom use * In the past 3 months, ACASI In the past 3 months, telephone interview")
41
Primary Outcomes (assessed at 6-month follow-up visit by ACASI) Percentage of safe sex episodes (continuous variable) Percentage of safe sex episodes (continuous variable) –number of times condoms were used out of the number of sexual episodes (anal and vaginal intercourse) Consistent safe sex (yes/no) Consistent safe sex (yes/no) –100% condom use during anal and vaginal intercourse or abstinence from sex
 Percentage of safe sex episodes (continuous variable) Percentage of safe sex episodes (continuous variable) –number of times condoms were used out of the number of sexual episodes (anal and vaginal intercourse) Consistent safe sex (yes/no) Consistent safe sex (yes/no) –100% condom use during anal and vaginal intercourse or abstinence from sex")
42
Secondary Outcomes 6 months: 6 months: –Any condom use (yes/no) –Number of unsafe sex episodes no condom use during anal or vaginal sex no condom use during anal or vaginal sex 3 months: 3 months: –percentage of safe sex episodes –consistent safe sex (yes/no) –any condom use (yes/no)
 –Number of unsafe sex episodes no condom use during anal or vaginal sex no condom use during anal or vaginal sex 3 months: 3 months: –percentage of safe sex episodes –consistent safe sex (yes/no) –any condom use (yes/no)")
43
Analysis Intent-to-treat Intent-to-treat Descriptive statistics (e.g., medians, interquartile ranges [IQR], and proportions) were used to characterize the sample by treatment group. Descriptive statistics (e.g., medians, interquartile ranges [IQR], and proportions) were used to characterize the sample by treatment group. Chi-square, Fisher s exact, or Wilcoxon rank sum tests used as appropriate for dichotomous and continuous variables. Chi-square, Fisher s exact, or Wilcoxon rank sum tests used as appropriate for dichotomous and continuous variables. Additional analyses using logistic regression and median regression models to adjust for possible group differences at baseline Additional analyses using logistic regression and median regression models to adjust for possible group differences at baseline
![Analysis Intent-to-treat Intent-to-treat Descriptive statistics (e.g., medians, interquartile ranges [IQR], and proportions) were used to characterize the sample by treatment group.](http://images.slideplayer.com/1/255373/slides/slide_43.jpg "Descriptive statistics (e.g., medians, interquartile ranges [IQR], and proportions) were used to characterize the sample by treatment group. Chi-square, Fisher s exact, or Wilcoxon rank sum tests used as appropriate for dichotomous and continuous variables. Chi-square, Fisher s exact, or Wilcoxon rank sum tests used as appropriate for dichotomous and continuous variables. Additional analyses using logistic regression and median regression models to adjust for possible group differences at baseline Additional analyses using logistic regression and median regression models to adjust for possible group differences at baseline.")
44
Results Baseline Demographic Characteristics Baseline Demographic Characteristics CharacteristicControln=87Interventionn=94P-value Age, Median (IQR) 31 31(26-40) 30 30(25-39) 0.36 0.36 Male 68 (78%) 67 (71%) 0.31 Employed full time 42 (48%) 47 (50%) 0.88 Heterosexual 84 (97%) 90 (96%) 0.45 Diagnosis Alcohol Alcohol Heroin Heroin Dual Dual 55 (63%) 27 (31%) 5 (6%) 53 (57%) 31 (33%) 10 (11%) 0.42 HIV infected 11 (13%) 16 (17%) 0.53
 31 31(26-40) 30 30(25-39) Male 68 (78%) 67 (71%) 0.31 Employed full time 42 (48%) 47 (50%) 0.88 Heterosexual 84 (97%) 90 (96%) 0.45 Diagnosis Alcohol Alcohol Heroin Heroin Dual Dual 55 (63%) 27 (31%) 5 (6%) 53 (57%) 31 (33%) 10 (11%) 0.42 HIV infected 11 (13%) 16 (17%) 0.53")
45
Follow-Up Follow-up was 90% (162/181) at 3 months and 80% (144/181) at 6 months, with no differential follow-up between intervention groups
 at 3 months and 80% (144/181) at 6 months, with no differential follow-up between intervention groups")
46
Results - Primary Percentage of Safe Sex % of Safe Sex Episodes, Past 3 Months, Median (IQR) Baseline 3 Months 3 Months 6 Months * Control8(0-25.0)50(12.5-100.0)37(0-100.0) Intervention0(0-21.4)67(14.1-100.0)80(25.9-100.0) P-value0.090.980.02 * In the past 3 months, ACASI In the past 3 months, telephone interview
 Baseline 3 Months 3 Months 6 Months * Control8(0-25.0)50( )37( ) Intervention0(0-21.4)67( )80( ) P-value * In the past 3 months, ACASI In the past 3 months, telephone interview")
47
The Effect of the PREVENT Intervention on Median Percentage of Safe Sex Episodes 0 10 20 30 40 50 60 70 80 90 100 036 Months Median percentage of safe sex episodes Intervention Control

48
Results - Primary Consistent Safe Sex Subjects Reporting Consistent Safe Sex, Past 3 Months Baseline 3 Months 6 Months Control4(5%)28(36%)19(29%) Intervention2(2%)30(36%)29(40%) P-value0.370.980.18
28(36%)19(29%) Intervention2(2%)30(36%)29(40%) P-value")
49
Results – Secondary Any Condom Use Subjects Reporting Any Condom Use, Past 3 Months, Baseline3-Months6Months Control50(57%)67(86%)46(69%) Intervention41(44%)67(80%)65(84%) P-value0.060.300.02
67(86%)46(69%) Intervention41(44%)67(80%)65(84%) P-value")
50
Results- Secondary Unsafe Sex Episodes # Unsafe Sex Episodes, Past 3 Months, Median (IQR) [n] Baseline 3 Months 6 Months Control 20 (6- 45) [n=85] 6 (0-16) [n=78] 6 (0-30) [n=66] Intervention 12 (5- 36) [n=89] 5 (0-12.5) [n=84] 3 (0-15) [n=73] P-value0.230.500.045
![Results- Secondary Unsafe Sex Episodes # Unsafe Sex Episodes, Past 3 Months, Median (IQR) [n] Baseline 3 Months 6 Months Control 20 (6- 45) [n=85] 6 (0-16) [n=78] 6 (0-30) [n=66] Intervention 12 (5- 36) [n=89] 5 (0-12.5) [n=84] 3 (0-15) [n=73] P-value](http://images.slideplayer.com/1/255373/slides/slide_50.jpg "Results- Secondary Unsafe Sex Episodes # Unsafe Sex Episodes, Past 3 Months, Median (IQR) [n] Baseline 3 Months 6 Months Control 20 (6- 45) [n=85] 6 (0-16) [n=78] 6 (0-30) [n=66] Intervention 12 (5- 36) [n=89] 5 (0-12.5) [n=84] 3 (0-15) [n=73] P-value")
51
Results- Dependence Category % Safe Sex Episodes, Past 3 months, Median (IQR) [n] Median (IQR) [n] AlcoholHeroin Control 30.0 (0-78.6) [n=41] 59.1 (0-100) [n=22] Interventio n 90.0 (23.8-100.0) [n=39] 74.2 (39.1-100) [n=24] P-value0.0070.49
![Results- Dependence Category % Safe Sex Episodes, Past 3 months, Median (IQR) [n] Median (IQR) [n] AlcoholHeroin Control 30.0 (0-78.6) [n=41] 59.1 (0-100) [n=22] Interventio n 90.0 ( ) [n=39] 74.2 ( ) [n=24] P-value](http://images.slideplayer.com/1/255373/slides/slide_51.jpg "Results- Dependence Category % Safe Sex Episodes, Past 3 months, Median (IQR) [n] Median (IQR) [n] AlcoholHeroin Control 30.0 (0-78.6) [n=41] 59.1 (0-100) [n=22] Interventio n 90.0 ( ) [n=39] 74.2 ( ) [n=24] P-value")
52
Results- Dependence Category Percentage with Consistent Safe Sex, Past 3 months, [n] AlcoholHeroin Control22%[n=41]32%[n=22] Intervention48%[n=39]29%[n=24] P-value0.010.85
![Results- Dependence Category Percentage with Consistent Safe Sex, Past 3 months, [n] AlcoholHeroin Control22%[n=41]32%[n=22] Intervention48%[n=39]29%[n=24] P-value](http://images.slideplayer.com/1/255373/slides/slide_52.jpg "Results- Dependence Category Percentage with Consistent Safe Sex, Past 3 months, [n] AlcoholHeroin Control22%[n=41]32%[n=22] Intervention48%[n=39]29%[n=24] P-value")
53
Limitations Use of self-reported instruments/assessments Use of self-reported instruments/assessments Possibility of social desirability bias Possibility of social desirability bias No objective biological outcomes (e.g. STDs or new HIV infection) assessed No objective biological outcomes (e.g. STDs or new HIV infection) assessed
 assessed No objective biological outcomes (e.g. STDs or new HIV infection) assessed.")
54
Conclusions Adaptation of a pragmatic sexual risk reduction intervention in two Russian narcology hospitals reduced risky sexual behaviors in substance dependent persons. Adaptation of a pragmatic sexual risk reduction intervention in two Russian narcology hospitals reduced risky sexual behaviors in substance dependent persons. Dissemination of this effective intervention in comparable settings could be one component of a broad strategy needed to reduce the risk of HIV infection in Eastern Europe and other settings. Dissemination of this effective intervention in comparable settings could be one component of a broad strategy needed to reduce the risk of HIV infection in Eastern Europe and other settings.

55
Current Alcohol Consumption and Cardiovascular Disease among Men Infected with HIV Matthew Freiberg, MD, MSc University of Pittsburgh, USA Alcohol and HIV Symposium ISBRA 2006 World Congress on Alcohol Research Sydney, Australia September 11 th, 2006

56
Alcohol Consumption In the general population In the general population –17.6 million adults abuse alcohol or are alcohol dependent 1 Among those with HIV Among those with HIV –40-50% have a history of alcohol abuse or dependence 2 1 Grant BF,: The 12-month prevalence and trends in DSM-IV alcohol abuse and dependence: United States, 1991-1992 and 2001-2002. Drug Alcohol Depend 74:223-234, 2004. 2 Lefevre F et al. Alcohol consumption among HIV-infected patients. J Gen Intern Med 10:458-460, 1995

57
Cardiovascular Disease In the general population In the general population –Cardiovascular disease (CVD) is the leading cause of death in the United States1 Among those with HIV Among those with HIV –Combined Antiretroviral Therapy (ART) is associated with an increased risk of myocardial infarction2 –ART is associated with increased insulin resistance and dyslipidemia 1 Mokdad AH et al: Actual causes of death in the United States, 2000. JAMA 291:1238-1245, 2004. 2 Friis-Moller N et al.: Combination antiretroviral therapy and the risk of myocardial infarction. N Engl J Med 349:1993-2003, 2003.

58
Alcohol Consumption and CVD Among those without HIV Among those without HIV –J-shaped relation between alcohol and CHD risk –J-shaped relation between alcohol and CHD risk 1 Mechanism of action Mechanism of action –Increased insulin sensitivity –Increased HDL cholesterol Among those with HIV, however… Among those with HIV, however… – data are sparse 1 Corrao G, et al.: Alcohol and coronary heart disease: a meta-analysis. Addiction 95:1505-1523, 2000

59
The Present Study Specific Aims Specific Aims –To evaluate the cross-sectional association between current alcohol consumption and prevalent CVD among male veterans infected with HIV using multivariable logistic regression –To determine if the relationship between current alcohol consumption and prevalent CVD is the same for male veterans with HIV as compared with male veterans without HIV

60
The Present Study Hypotheses Hypotheses –The relationship between current alcohol consumption and prevalent CVD will be J shaped for male veterans with and without HIV but…. –The observed benefit of current moderate alcohol consumption will be less in HIV infected male veterans

61
Research Design Veterans Aging Cohort Study (VACS) Veterans Aging Cohort Study (VACS) –Observational longitudinal cohort of U.S. veterans –2979 HIV+ and 3019 HIV- age, race/ethnicity, site matched comparison participants –Uses data from provider surveys and electronic medical record reviews (including laboratory and pharmacy data) from 8 Veteran Affairs Medical Center GIM and ID clinics
 from 8 Veteran Affairs Medical Center GIM and ID clinics.")
62
Subjects, Eligibility, Data Subjects were eligible for the present study if Subjects were eligible for the present study if –They were a male VACS participant –Responded to provider surveys and answered questions regarding alcohol consumption, covariates, and prevalent CVD outcomes –Were current alcohol consumers All data for the present study are from the baseline examination All data for the present study are from the baseline examination The present study contains 2028 HIV+ and 1927 HIV- participants The present study contains 2028 HIV+ and 1927 HIV- participants

63
Dependent variable Total cardiovascular disease (CVD): defined as a yes response to one of the following questions, Has a doctor ever told you that you had… Total cardiovascular disease (CVD): defined as a yes response to one of the following questions, Has a doctor ever told you that you had… (1) …angina or CHD, (2) …a myocardial infarction, (3) …congestive heart failure, OR (4) …a stroke or TIA.
: defined as a yes response to one of the following questions, Has a doctor ever told you that you had… Total cardiovascular disease (CVD): defined as a yes response to one of the following questions, Has a doctor ever told you that you had… (1) …angina or CHD, (2) …a myocardial infarction, (3) …congestive heart failure, OR (4) …a stroke or TIA.")
64
Independent Variable (Alcohol) Number of drinks per week Number of drinks per week –Constructed from the Alcohol Use Disorders Identification Test (AUDIT) –Using quantity and frequency questions: When you are drinking how often do you have a drink containing alcohol? Never, monthly or less, 2-4 x per month, 2-3 x per week, 4+ x per week When you are drinking how often do you have a drink containing alcohol? Never, monthly or less, 2-4 x per month, 2-3 x per week, 4+ x per week How many drinks containing alcohol do you have on a typical day when you are drinking? 1-2, 3-4, 5-6, 7-9, 10 or more How many drinks containing alcohol do you have on a typical day when you are drinking? 1-2, 3-4, 5-6, 7-9, 10 or more

65
Independent Variable (Current Alcohol Consumption) Hazardous drinking: > 14 drinks a week or 6 or more drinks on one occasion Hazardous drinking: > 14 drinks a week or 6 or more drinks on one occasion Moderate drinking: 1-14 drinks a week and no binge drinking Moderate drinking: 1-14 drinks a week and no binge drinking Infrequent drinking: <1 drink per week (referent) Infrequent drinking: <1 drink per week (referent)
 Hazardous drinking: > 14 drinks a week or 6 or more drinks on one occasion Hazardous drinking: > 14 drinks a week or 6 or more drinks on one occasion Moderate drinking: 1-14 drinks a week and no binge drinking Moderate drinking: 1-14 drinks a week and no binge drinking Infrequent drinking: <1 drink per week (referent) Infrequent drinking: <1 drink per week (referent)")
66
Covariates Age Age Race (White, Black, Other) Race (White, Black, Other) Height Height Weight Weight
 Race (White, Black, Other) Height Height Weight Weight")
67
Covariates Self-reported Self-reported –High cholesterol, lipids, or triglycerides –Diabetes or high blood sugar –Hypertension or high blood pressure –Current smoking: defined as Do you now smoke cigarettes? (i.e. within the last week) –Liver disease or (bad liver) or Cirrhosis –Kidney failure or (bad kidneys) –Regular exercise: defined as engaging in regular activities (e.g., brisk walking, jogging) long enough to work up a sweat at least 3 times a week
 –Liver disease or (bad liver) or Cirrhosis –Kidney failure or (bad kidneys) –Regular exercise: defined as engaging in regular activities (e.g., brisk walking, jogging) long enough to work up a sweat at least 3 times a week.")
68
Covariates Hepatitis C virus (HCV) status: defined as a positive Hepatitis C antibody test or HCV RNA test Hepatitis C virus (HCV) status: defined as a positive Hepatitis C antibody test or HCV RNA test CD4 count: closest lab value -180 days to +7 days from the time of enrollment CD4 count: closest lab value -180 days to +7 days from the time of enrollment Current antiretroviral therapy (ART) use: defined as any ART use -90 days to +7 days from the time of enrollment based on survey and pharmacy data Current antiretroviral therapy (ART) use: defined as any ART use -90 days to +7 days from the time of enrollment based on survey and pharmacy data
 status: defined as a positive Hepatitis C antibody test or HCV RNA test Hepatitis C virus (HCV) status: defined as a positive Hepatitis C antibody test or HCV RNA test CD4 count: closest lab value -180 days to +7 days from the time of enrollment CD4 count: closest lab value -180 days to +7 days from the time of enrollment Current antiretroviral therapy (ART) use: defined as any ART use -90 days to +7 days from the time of enrollment based on survey and pharmacy data Current antiretroviral therapy (ART) use: defined as any ART use -90 days to +7 days from the time of enrollment based on survey and pharmacy data")
69
Analysis Descriptive statistics Descriptive statistics Multivariable logistic regression models Multivariable logistic regression models –Model 1: Age adjusted –Model 2: Model 1 + demographics + traditional CHD risk factors –Model 3: Model 2 + ART + CD4 +HCV –Model 4: Model 3 + remaining covariates

70
Demographics DemographicsHIV+N=2028HIV-N=1927 Median age (yr) 4950 Race (% black) 6863 Median height (inches) 7070 Median weight (lbs) 175195
 4950 Race (% black) 6863 Median height (inches) 7070 Median weight (lbs)")
71
Traditional CHD Risk Factors Traditional CHD Risk Factors HIV+N=2028HIV-N=1927 Hypercholesterolemia (%) 28.336.7 Diabetes (% ) 15.124.9 Hypertension (%) 32.746.8 Current smoking (%) 53.846.1
 Diabetes (% ) Hypertension (%) Current smoking (%)")
72
Non-Traditional CHD Risk Factors Non-Traditional CHD Risk Factors HIV+N=2028HIV-N=1927 Hepatitis C (%) 33.616.2 Median CD4 count cells/mm 3 * 367-- Current antiretroviral use (%)** 81.7-- *Data available for n=1995 *Data available for n=1995 **Data available for n=1771
 Median CD4 count cells/mm 3 * Current antiretroviral use (%)** *Data available for n=1995 *Data available for n=1995 **Data available for n=1771")
73
Other Covariates HIV+ N=202 8 HIV- N=192 7 Liver disease (%) 16.99.9 Kidney disease (%) 4.63.5 Regular exercise (%) 54.955.3
 Kidney disease (%) Regular exercise (%)")
74
Prevalent Cardiovascular Disease HIV+N=2028HIV-N=1927 Angina or CHD (%) 5.210.0 Heart attack or MI (%) 4.27.7 Congestive heart failure (%) 3.95.4 Stroke (%) 5.05.5 Total CVD (%) 12.217.3
 Heart attack or MI (%) Congestive heart failure (%) Stroke (%) Total CVD (%)")
75
Current Drinkers InfrequentDrinker % (n) Moderate Drinker % (n) Hazardous Drinker % (n) HIV+ HIV+ N=2028 N=202823.9(484)25.1(508)51.1(1036) HIV- HIV- N=1927 N=192723.6(454)22.9(441)53.4(1032)
 Moderate Drinker % (n) Hazardous Drinker % (n) HIV+ HIV+ N=2028 N= (484)25.1(508)51.1(1036) HIV- HIV- N=1927 N= (454)22.9(441)53.4(1032)")
76
Prevalent CVD among Current Drinkers InfrequentDrinker% Moderate Drinker % Hazardous Drinker % HIV+ HIV+ N=2028 N=202811.610.013.6 HIV- HIV- N=1927 N=192718.317.017.0

77
Prevalent Total CVD among Current Drinkers with HIV* Moderate Drinker Hazardous Drinker Model 1 Model 1 Model 2 Model 2 Model 3 Model 3 Model 4 Model 4 0.86 (0.57-1.29) 0.93 (0.61-1.42) 1.06 (0.68-1.67) 1.09 (0.69-1.72) 1.27 (0.91-1.77) 1.36 (0.96-1.93) 1.52 (1.04-2.24) 1.63 (1.10-2.41) *Infrequent drinkers were the referent group Model 1=Adjusted for age Model 2=Model 1 + demographics and traditional CHD risk factors Model 3=Model 2 + Non-traditional CHD risk factors (ART, CD4, and HCV) Model 4=Model 3 + remaining covariates
 0.93 ( ) 1.06 ( ) 1.09 ( ) 1.27 ( ) 1.36 ( ) 1.52 ( ) 1.63 ( ) *Infrequent drinkers were the referent group Model 1=Adjusted for age Model 2=Model 1 + demographics and traditional CHD risk factors Model 3=Model 2 + Non-traditional CHD risk factors (ART, CD4, and HCV) Model 4=Model 3 + remaining covariates")
78
Prevalent Total CVD among Current Drinkers without HIV* Moderate Drinker Hazardous Drinker Model 1 Model 1 Model 2 Model 2 Model 3 Model 3 Model 4 Model 4 0.72 (0.50-1.04) 0.77 (0.53-1.12) -- 0.74 (0.51-1.09) 0.92 (0.68-1.24) 0.92 (0.68-1.26) -- 0.92 (0.67-1.27) *Infrequent drinkers were the referent group Model 1=Adjusted for age Model 2=Model 1 + demographics and traditional CHD risk factors Model 3=Model 2 + Non-traditional CHD risk factors (ART, CD4, and HCV) Model 4=Model 3 + remaining covariates
 0.77 ( ) ( ) 0.92 ( ) 0.92 ( ) ( ) *Infrequent drinkers were the referent group Model 1=Adjusted for age Model 2=Model 1 + demographics and traditional CHD risk factors Model 3=Model 2 + Non-traditional CHD risk factors (ART, CD4, and HCV) Model 4=Model 3 + remaining covariates")
79
Limitations Possible non-differential misclassification associated with self-reported outcomes Possible non-differential misclassification associated with self-reported outcomes Possible differential misclassification associated with HIV and frequent health care visits Possible differential misclassification associated with HIV and frequent health care visits Hepatitis C laboratory screening was provider dependent Hepatitis C laboratory screening was provider dependent Cannot comment on cause and effect Cannot comment on cause and effect Veterans may not be generalizable to other populations Veterans may not be generalizable to other populations

80
Conclusions A J shaped relationship between alcohol and prevalent CVD was observed for HIV+ and HIV- veterans A J shaped relationship between alcohol and prevalent CVD was observed for HIV+ and HIV- veterans –For HIV+ veterans the J shaped relationship was not present after adjusting for confounders –For HIV- veterans, the J shaped relationship remained after adjusting for confounders but was not statistically significant

81
Acknowledgements Funding: National Institute of Alcohol Abuse and Alcoholism (NIAAA) Grants 5U01AA013566 and 7K23AA015914 Funding: National Institute of Alcohol Abuse and Alcoholism (NIAAA) Grants 5U01AA013566 and 7K23AA015914 Co-Investigators: Co-Investigators: –Amy Justice and the VACS Project Team –Jeffrey Samet –Lewis Kuller –Kevin Kraemer –R. Curtis Ellison –Richard Saitz –Arlene Ash –R.S. Vasan –Lewis Kazis

82
Missing Data VACS cohort has 5988 VACS cohort has 5988 1454 participants were former or never consumers of alcohol or did not respond to one of the quantity frequency questions 1454 participants were former or never consumers of alcohol or did not respond to one of the quantity frequency questions 301 participants were women 301 participants were women 208 participants were missing data on covariate data 208 participants were missing data on covariate data

83
Prevalent Total CVD among Current Drinkers with HIV* Moderate Drinker Hazardous Drinker Model 1 Model 1 Model 2 Model 2 Model 3 Model 3 Model 4 Model 4 0.98 (0.63-1.52) 1.08 (0.69-1.69) 1.06 (0.68-1.67) 1.09 (0.69-1.72) 1.40 (0.97-2.03) 1.54 (1.05-2.26) 1.52 (1.04-2.24) 1.63 (1.10-2.41) *Infrequent drinkers were the referent group and sample restricted to those with data for ART and CD4 (n=1742) Model 1=Adjusted for age Model 2=Model 1 + demographics and traditional CHD risk factors Model 3=Model 2 + Non-traditional CHD risk factors (ART, CD4, and HCV) Model 4=Model 3 + remaining covariates
 1.08 ( ) 1.06 ( ) 1.09 ( ) 1.40 ( ) 1.54 ( ) 1.52 ( ) 1.63 ( ) *Infrequent drinkers were the referent group and sample restricted to those with data for ART and CD4 (n=1742) Model 1=Adjusted for age Model 2=Model 1 + demographics and traditional CHD risk factors Model 3=Model 2 + Non-traditional CHD risk factors (ART, CD4, and HCV) Model 4=Model 3 + remaining covariates")
84
Alcohol & HIV: Developing Interactive Computerized Brief Interventions Joseph Conigliaro, MD, MPH Center for Enterprise Quality and Safety University of Kentucky

85
Alcohol Use and Abuse 90% currently use or have used alcohol 90% currently use or have used alcohol 14% report abuse or dependence 14% report abuse or dependence Major factor in hospital, emergency visits, sick days & accidents Major factor in hospital, emergency visits, sick days & accidents Economic burden Economic burden

86
Alcohol & HIV Veterans Aging Cohort Study 914 HIV (+) patients 914 HIV (+) patients –15% hazardous drinkers (AUDIT) –13% drank more than 30 drinks per month Hazardous drinkers Hazardous drinkers –More often had detectable VL [> 500 copies/ml] (70% vs. 55%; P=.001) compared to non-hazardous drinkers –Higher AST and ALT levels Multivariate analysis (antiretroviral therapy, age, drug use, and HIV risk factor) Multivariate analysis (antiretroviral therapy, age, drug use, and HIV risk factor) –Hazardous drinkers were 1.8 (95% CI 1.16-2.64) times as likely as non-hazardous drinkers to have a detectable VL –Consumption above 30 drinks/month associated with increased odds of detectable VL (OR=1.82; 1.17-2.86)
![Alcohol & HIV Veterans Aging Cohort Study 914 HIV (+) patients 914 HIV (+) patients –15% hazardous drinkers (AUDIT) –13% drank more than 30 drinks per month Hazardous drinkers Hazardous drinkers –More often had detectable VL [> 500 copies/ml] (70% vs.](http://images.slideplayer.com/1/255373/slides/slide_86.jpg "55%; P=.001) compared to non-hazardous drinkers –Higher AST and ALT levels Multivariate analysis (antiretroviral therapy, age, drug use, and HIV risk factor) Multivariate analysis (antiretroviral therapy, age, drug use, and HIV risk factor) –Hazardous drinkers were 1.8 (95% CI ) times as likely as non-hazardous drinkers to have a detectable VL –Consumption above 30 drinks/month associated with increased odds of detectable VL (OR=1.82; ).")
87
Alcohol & HIV Significant implications for clinical management and outcomes Significant implications for clinical management and outcomes Associated with increased morbidity & mortality, rapid disease progression, poorer adherence to antiretroviral regimens, and viral resistance Associated with increased morbidity & mortality, rapid disease progression, poorer adherence to antiretroviral regimens, and viral resistance

88
Institute of Medicine Providers should be able to: Providers should be able to: –identify –treat alcohol problems –refer for specialist treatment Unique position for early detection & Rx Unique position for early detection & Rx –prevalence –patient access –Linkage of medical problems –Rapport with patient Lack expertise and capability Lack expertise and capability Limited time and resources Limited time and resources

89
Brief Interventions Reduce alcohol consumption Reduce alcohol consumption Decrease alcohol related complications Decrease alcohol related complications Reduce alcohol related health care costs Reduce alcohol related health care costs Not routine practice Not routine practice

90
Interactive Computer Programs & BIs Assess drinking status & readiness to change Assess drinking status & readiness to change Initiate provider delivered BIs Initiate provider delivered BIs Prepare patient & provider for targeted session Prepare patient & provider for targeted session Saves time Saves time Reduce time lag between assessment and feedback. Reduce time lag between assessment and feedback. Facilitate individualized feedback immediately upon submission of data Facilitate individualized feedback immediately upon submission of data Provide lower-cost and customized intervention to more drinkers Provide lower-cost and customized intervention to more drinkers Provide anonymity, convenience –can be done anytime, day or night Provide anonymity, convenience –can be done anytime, day or night Feedback objective and not influenced by counselor bias Feedback objective and not influenced by counselor bias

91
Internet to Reduce Problem Drinking Computers, and the internet, have become integral part of life Computers, and the internet, have become integral part of life Approx 80 % of internet "surfers" in the US have reportedly used it to access health information Approx 80 % of internet "surfers" in the US have reportedly used it to access health information In-person brief motivational interventions are currently offered via the internet In-person brief motivational interventions are currently offered via the internet Drinkers may prefer this format Drinkers may prefer this format –way to save face –can begin to look at their drinking in private and nonjudgmental way

92
AlcoholScreening.org Anonymous Anonymous Free online service Free online service Offers visitors Offers visitors –self-screening of drinking behaviors –individualized feedback –when appropriate, information about treatment

93
AlcoholScreening.org Examined whether the site reached potential hazardous drinkers. Examined whether the site reached potential hazardous drinkers. 14-months 14-months –over 66,000 visitors –nearly 40,000 > age 18 completed screen about drinking habits 90% of all visitors who completed screen were hazardous drinkers (by AUDIT, and 2 quantity and frequency questions - >14 drinks per week or >4 drinks per occasion for men, and >7 drinks per week or >3 drinks per occasion for women) 90% of all visitors who completed screen were hazardous drinkers (by AUDIT, and 2 quantity and frequency questions - >14 drinks per week or >4 drinks per occasion for men, and >7 drinks per week or >3 drinks per occasion for women) 65% had possible alcohol abuse or dependence 65% had possible alcohol abuse or dependence After receiving results, 19% chose Learn More or Get Help options After receiving results, 19% chose Learn More or Get Help options
 90% of all visitors who completed screen were hazardous drinkers (by AUDIT, and 2 quantity and frequency questions - >14 drinks per week or >4 drinks per occasion for men, and >7 drinks per week or >3 drinks per occasion for women) 65% had possible alcohol abuse or dependence 65% had possible alcohol abuse or dependence After receiving results, 19% chose Learn More or Get Help options After receiving results, 19% chose Learn More or Get Help options.")
94
The Drinker's Check-up internet equivalent of 2-3 face-face sessions with counselor internet equivalent of 2-3 face-face sessions with counselor same elements of original DCU same elements of original DCU –drinker's risk factors, family history, alcohol & drug use, alcohol-related problems, symptoms of dependence, & motivation for change –objective feedback based on answers; –module to resolve ambivalence about whether to change helps users decide to change their drinking helps users decide to change their drinking goals of change –stopping or cutting back goals of change –stopping or cutting back heavy drinkers increased internal motivation for change and reduced drinking, alcohol-related problems and symptoms of dependence by 50 % at 12-months heavy drinkers increased internal motivation for change and reduced drinking, alcohol-related problems and symptoms of dependence by 50 % at 12-months

95
The e-CHUG web-based version of the Check-Up to Go (CHUG) mailed feedback instrument web-based version of the Check-Up to Go (CHUG) mailed feedback instrument proven effective in college trials proven effective in college trials favorable to more lengthy prevention programs and may increase the impact of educational or skill-based prevention efforts favorable to more lengthy prevention programs and may increase the impact of educational or skill-based prevention efforts provides information about personal consumption, potential risk factors, and comparison to campus norms provides information about personal consumption, potential risk factors, and comparison to campus norms
 mailed feedback instrument web-based version of the Check-Up to Go (CHUG) mailed feedback instrument proven effective in college trials proven effective in college trials favorable to more lengthy prevention programs and may increase the impact of educational or skill-based prevention efforts favorable to more lengthy prevention programs and may increase the impact of educational or skill-based prevention efforts provides information about personal consumption, potential risk factors, and comparison to campus norms provides information about personal consumption, potential risk factors, and comparison to campus norms")
96
Current Internet Programs Accessible to those with computer/internet Accessible to those with computer/internet Geared toward younger persons Geared toward younger persons Not specific to HIV Not specific to HIV Not linked to EMR Not linked to EMR Not linked to provider Not linked to provider Not linked to clinic visit Not linked to clinic visit

97
Questions Can it be done in the clinic? Can it be done in the clinic? What about older veterans? What about older veterans?

98
Long Term Goal To identify and treat hazardous drinking among HIV infected veterans through the use of BIs and to identify and refer alcohol use disorders among veterans using brief interventions To identify and treat hazardous drinking among HIV infected veterans through the use of BIs and to identify and refer alcohol use disorders among veterans using brief interventions

99
Specific Aims Test and adapt an alcohol screening and interactive computer prototype using iterative process of user testing, focus groups and face-to-face interviews with provider & patients Test and adapt an alcohol screening and interactive computer prototype using iterative process of user testing, focus groups and face-to-face interviews with provider & patients Test feasibility of implementing prototype in two VA HIV clinics Test feasibility of implementing prototype in two VA HIV clinics Gather information on effect size of intervention to reduce consumption, and HIV relevant consequences (sexual risk behavior & antiretroviral medication adherence) Gather information on effect size of intervention to reduce consumption, and HIV relevant consequences (sexual risk behavior & antiretroviral medication adherence)
 Gather information on effect size of intervention to reduce consumption, and HIV relevant consequences (sexual risk behavior & antiretroviral medication adherence)")
100
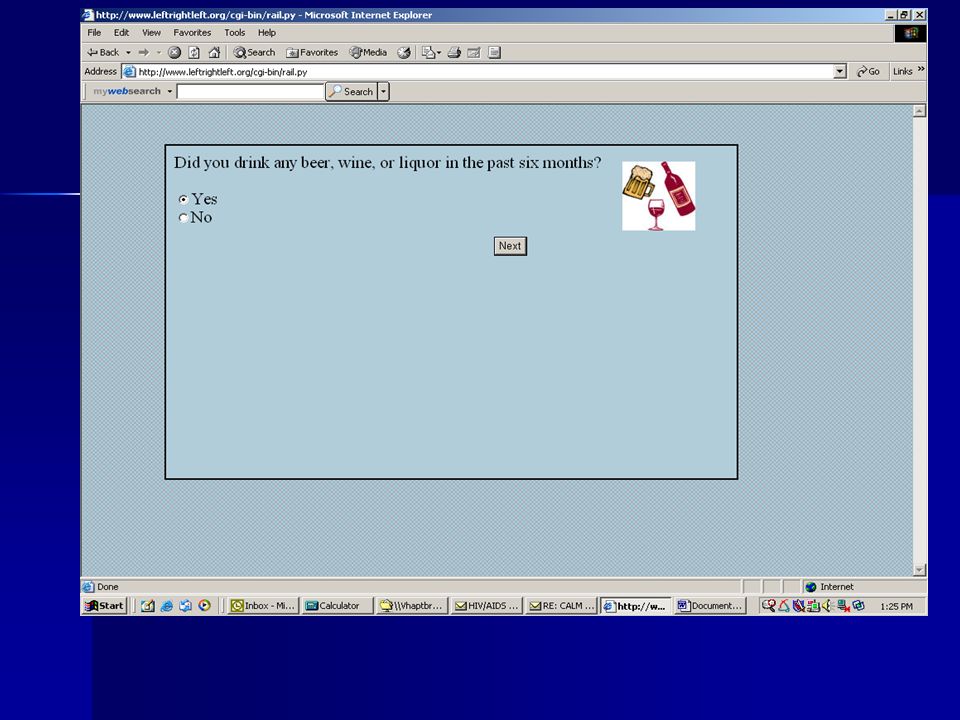
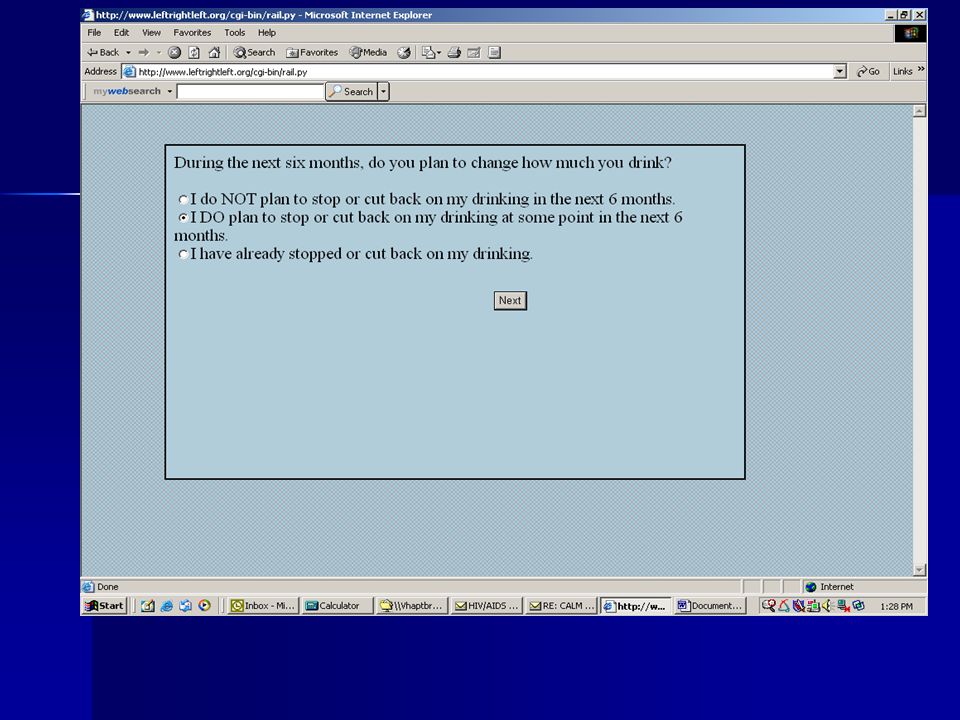
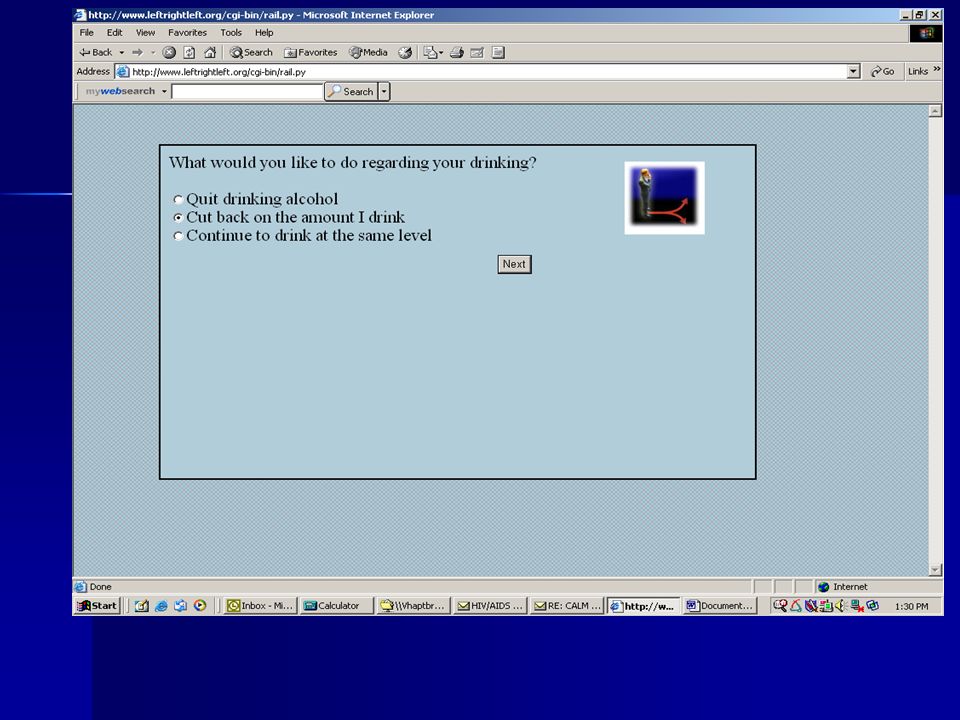
Computer Assisted Lifestyle Management (CALM) Identifies hazardous drinkers Identifies hazardous drinkers –Alcohol Use Disorders Identification Test (AUDIT) –Quantity and frequency of consumption –Alcohol related consequences Readiness to change Readiness to change
 Identifies hazardous drinkers Identifies hazardous drinkers –Alcohol Use Disorders Identification Test (AUDIT) –Quantity and frequency of consumption –Alcohol related consequences Readiness to change Readiness to change")
101
CALM Delivers Brief Intervention Delivers Brief Intervention –Patients & providers explore ETOH severity, consequences, goals & Rx barriers –Brief negotiation using FRAMES & Stages of Change –Computer intervention pulls from electronic medical record

102
CALM

103
FRAMES Feedback Responsibility Advice Menu of options Empathy Self-efficacy Self-efficacy

104
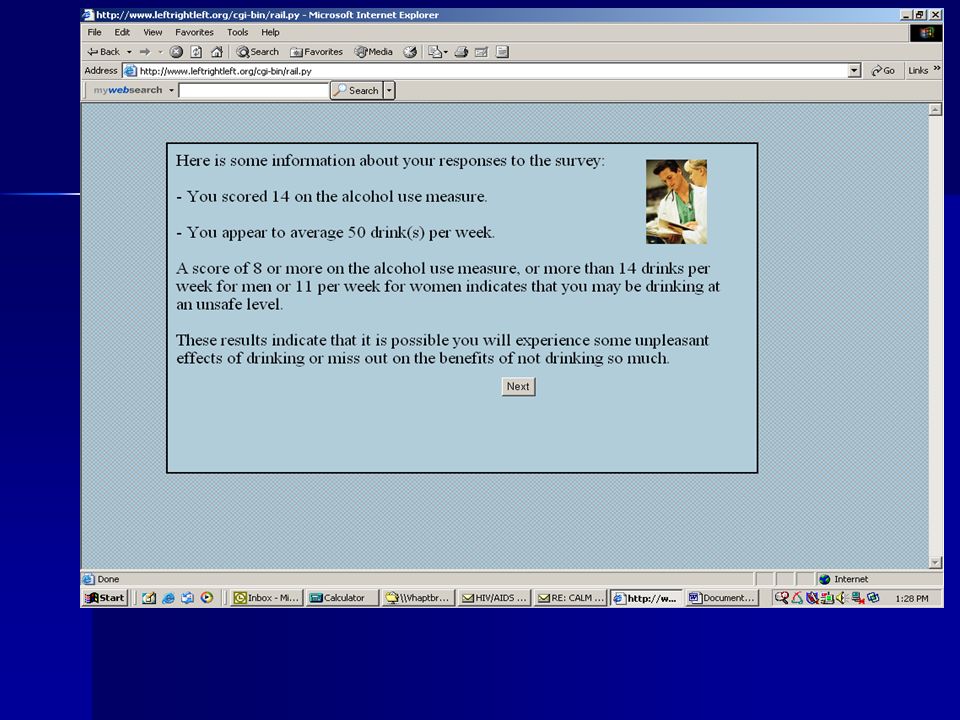
FRAMES Feedback –Specific and relative to mental, physical & psychosocial health Responsibility –Stated explicitly by CALM Advice –Simple and explicit; given as a prescription Menu of options –Patient chooses goal that matches needs & situation –Increases perceived personal choice and control Empathy –Acknowledge difficulty of change –By health care provider Self efficacy –Statements of hope and optimism –By health care provider

105
Pilot Study Specific Aims To assess ease of use and acceptability of CALM among veterans in primary care clinic To assess ease of use and acceptability of CALM among veterans in primary care clinic To assess patient knowledge and attitudes regarding computers To assess patient knowledge and attitudes regarding computers To assess provider attitudes regarding use of CALM in clinic To assess provider attitudes regarding use of CALM in clinic

106
Methods Veterans approached in PC waiting area Veterans approached in PC waiting area Completed self administered computer program Completed self administered computer program Touch screen tablet computer Touch screen tablet computer Patient print out – summary & change plan Patient print out – summary & change plan Provider print out - patient responses & change plan Provider print out - patient responses & change plan Providers surveyed after patient visit Providers surveyed after patient visit

107
Methods Measures Measures –assessment of ease of use and acceptability of CALM –knowledge and attitudes regarding computer

108
Methods Subjects 67 of 80 VA patients surveyed after using CALM 67 of 80 VA patients surveyed after using CALM –92% male –25% non-white –mean age 62 years –81% graduated high school –11% hazardous drinking (AUDIT > 8 or 16 drinks/week) 9/15 (60%) VA primary care providers returned surveys (Physicians and Nurse Practitioners) 9/15 (60%) VA primary care providers returned surveys (Physicians and Nurse Practitioners)
 9/15 (60%) VA primary care providers returned surveys (Physicians and Nurse Practitioners) 9/15 (60%) VA primary care providers returned surveys (Physicians and Nurse Practitioners)")
109
Results 60% of patients reported having used a computer 60% of patients reported having used a computer 97% felt at ease with the computer 97% felt at ease with the computer 77% would be as honest or more honest 77% would be as honest or more honest 71% more private way to collect information 71% more private way to collect information

110
Results 76% CALM easy to use 76% CALM easy to use 75% interesting 75% interesting 71% liked it or liked it very much 71% liked it or liked it very much 87% would heed providers advice after CALM 87% would heed providers advice after CALM 64% more likely to ask questions 64% more likely to ask questions

111
Results Providers –78% CALM provides reliable information & influence interactions with patients –66% patients more honest with computer –78% would use program –55% program would make them more effective

112
Conclusions Delivering a computerized BI in primary care Delivering a computerized BI in primary care –acceptable to providers and patients –viewed as facilitating dialogue about drinking –may enhance patient receptiveness to provider advice

113
Methodological Issues 1. What is hazardous drinking in the HIV Population? 2. Is the clinic an appropriate venue to administer CALM? Role of Internet? 3. What is the best way to deliver info to providers? 4. Timing of intervention with respect to provider visit?

114
Future Directions Refinement Refinement Customization in Subspecialty Clinics Customization in Subspecialty Clinics –HIV Clinics Linkage to CPRS Linkage to CPRS –Wireless print out to provider Timing of CALM delivery Timing of CALM delivery –Before visit at home? waiting room? after clinic?

115
Tailoring Computerized BIs BIs BIs –Need to be tailored to individual patients –Need to be tailored to individual conditions –Varying age, health problem Link to clinical care, provider Link to clinical care, provider Tailor any BI Tailor any BI

116
CALM SPECS Java/J2EE application that runs on a Tomcat 5.5.7 application server and Appache 2.2 web server Java/J2EE application that runs on a Tomcat 5.5.7 application server and Appache 2.2 web server Database is MySql 5.0 Database is MySql 5.0 Follows MVC (Model-View-Controller) object oriented design pattern Follows MVC (Model-View-Controller) object oriented design pattern –Java servlets used to implement Controller –JSPs used for presentation of data (the View) –Java classes are the Model
 object oriented design pattern Follows MVC (Model-View-Controller) object oriented design pattern –Java servlets used to implement Controller –JSPs used for presentation of data (the View) –Java classes are the Model")
117
CALM Can be used as: 1.authoring of BIs 2.presentation of BIs 3.Reporting/statistical tool (all data can be exported into Excel, CSV or HTML format) Provides application level security, where Administrators (aka super-users) can manage access privileges of other users
 Provides application level security, where Administrators (aka super-users) can manage access privileges of other users")
118
Future enhancements: Question Library. Question Library. Allow multimedia to be inserted into Brief Intervention text. Allow multimedia to be inserted into Brief Intervention text. HTML toolbox to allow nicer formatting of text questions. HTML toolbox to allow nicer formatting of text questions.

119
CALM NIAAA NIAAA VACS VACS University of Kentucky University of Kentucky Baltimore VA Baltimore VA Pittsburgh VA Pittsburgh VA

120
Manage Brief Interventions

121
Multiple Types of BIs

140
Reports

Similar presentations


 patients Policy.>")


 Grants Chapter 6.>")

