Download presentation
Presentation is loading. Please wait.

1
AQA - Business Statistics , Quantitative Analysis Peter Matthews matthewsp@bpc.ac.uk
FDA B&M

2
Today’s Aims Overview of numerical data properties Central Tendancy and how to calculate them Simple Variation and how to calculate Essentially Level 2 Maths

4
Central tendency

5
Variation

9
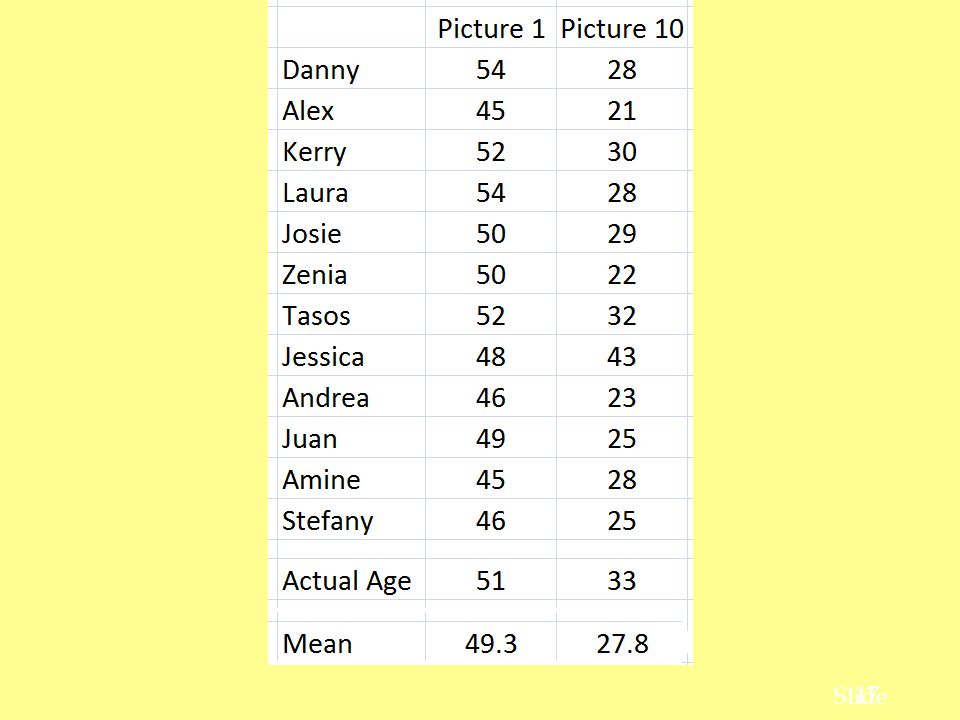
H1 Picture 1 Picture 2 Picture 3 Picture 4 Picture 5 Picture 6
Danny 54 24 31 22 29 34 25 32 28 Alex 45 50 40 39 20 52 21 Kerry 27 38 26 42 23 30 Laura 36 44 Josie 35 Zenia 48 33 43 55 Tasos Jessica Andrea 46 37 Juan 49 Amine Stefany 19

10
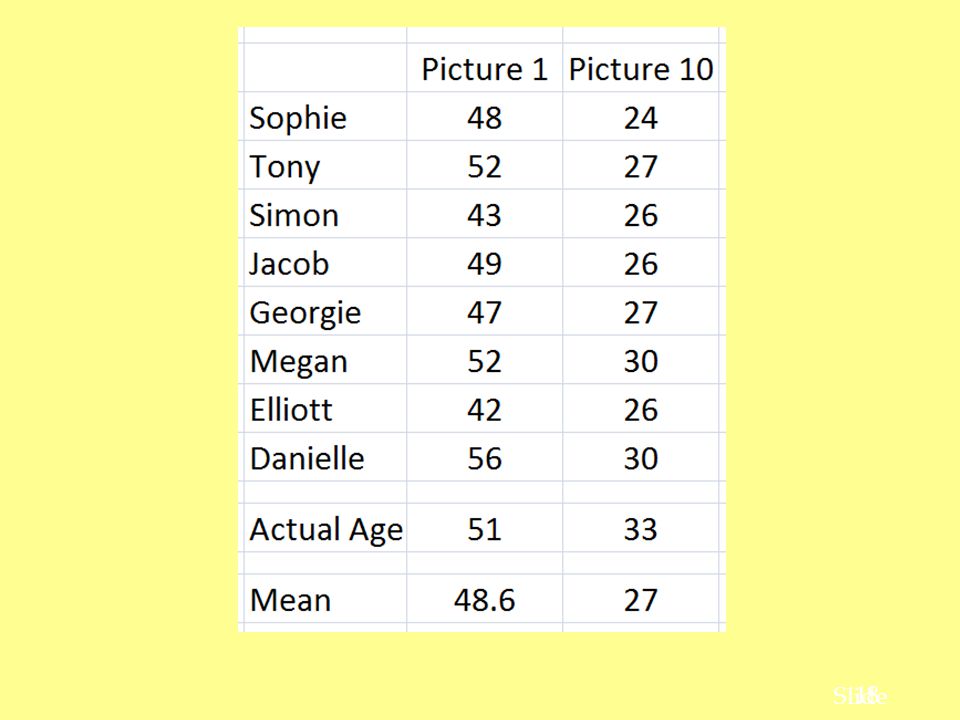
H2 Picture 1 Picture 2 Picture 3 Picture 4 Picture 5 Picture 6
Sophie 48 35 54 26 38 47 32 49 43 24 Tony 52 36 41 27 29 30 Simon 46 34 25 31 39 Jacob 40 45 37 28 Georgie 22 44 51 Megan 42 Elliott 19 Danielle 56 20 33

11
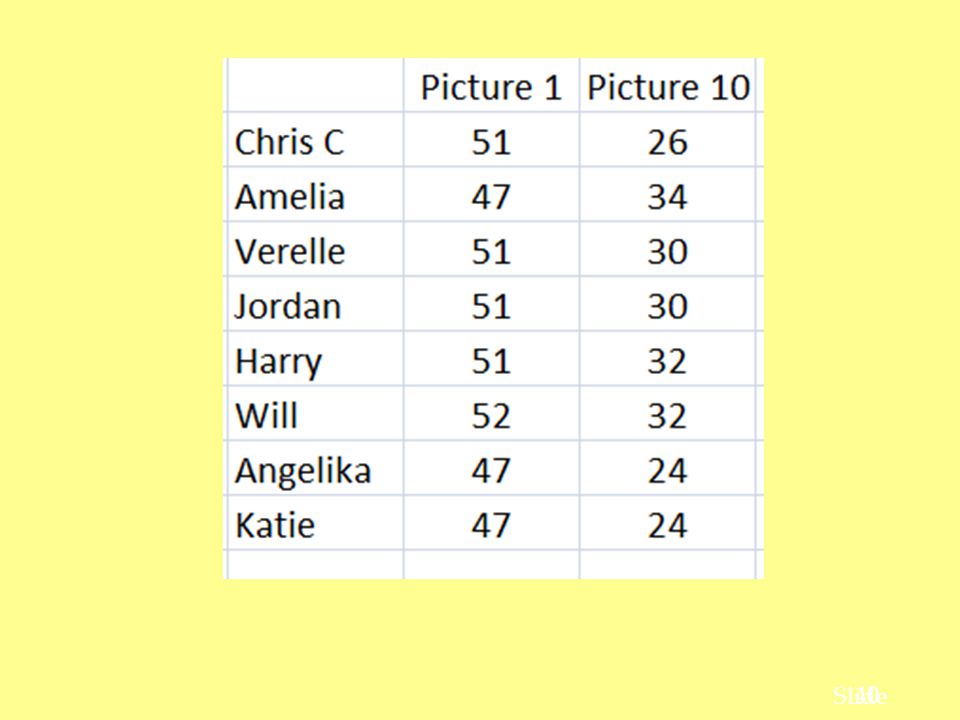
H3 Picture 1 Picture 2 Picture 3 Picture 4 Picture 5 Picture 6
Chris C 51 36 33 23 41 45 27 38 39 26 Amelia 47 40 42 28 37 48 32 29 46 34 Verelle 25 4 22 49 30 Jordan Harry 43 Will 52 10 Angelika 35 20 54 56 24 Katie 21 58

12
Properties of the Arithmetic Mean
1- All the values are included in computing the mean. 2- A set of data has a unique mean. 3- The mean is affected by unusually large or small data values. 4- It is a measure of central tendency not a measure of variation

16
So did I/You survive the Wrath that is Cheryl ?

20
But Chez isn't happy yet

21
But Chez isn't happy yet

22
Average A measure of average is a number that is typical for a set of figures. Finding the average helps you to draw conclusions from data. The main types are mean, median and mode. 3 Different types

23
A call centre claims to answer the calls on an average of 3 rings or less. Do you believe them ?
710 1080 Mode

24
Median The median of a data set is the value in the middle when the data items are arranged in ascending order Just a note if you have an even amount of numbers a,b,c,d the median is b+c/2. Whenever a data set has extreme values, the median is the preferred measure of central location. The median is the measure of location most often reported for annual income and property value data. A few extremely large incomes or property values can inflate the mean.

28
Mode - The mode of a data set is the value that occurs with greatest frequency
The greatest frequency can occur at two or more different values. If the data have exactly two modes, the data are bimodal. If the data have more than two modes, the data are multimodal.

33
Variation

34
~What does Average really tell us?

35
Measures of Variability (Dispersion)
It is often desirable to consider measures of variability (dispersion), as well as measures of location. For example, in choosing supplier A or supplier B we might consider not only the average delivery time for each, but also the variability in delivery time for each.
, as well as measures of location. For example, in choosing supplier A or supplier B we. might consider not only the average delivery time for. each, but also the variability in delivery time for each.")
36
Measures of Variability (Dispersion)
Range Interquartile Range or Midspread Variance Coefficient of Variation Standard Deviation

37
Range - The range of a data set is the difference between the largest and smallest data values.
It is the simplest measure of variability. It is very sensitive to the smallest and largest data values.

41
Interquartile Range or Midspread - The interquartile range of a data set is the difference between the third (upper) quartile and the first (lower) quartile. It is the range for the middle 50% of the data. It overcomes the sensitivity to extreme data values—it is not effected by the extreme values.

42
The Five-Number Summary
The five-number summary is a set of five descriptive statistics that divide the data set into four equal sections. The five numbers in a five number summary are: 1. The minimum (smallest) number in the data set. 2. The 25th percentile, aka the first quartile, or Q1. 3. The median (or 50th percentile). 4. The 75th percentile, aka the third quartile, or Q3. 5. The maximum (largest) number in the data set.
 number in the data set. 2. The 25th percentile, aka the first quartile, or Q1. 3. The median (or 50th percentile). 4. The 75th percentile, aka the third quartile, or Q3. 5. The maximum (largest) number in the data set.")
43
Where are the quartiles of
3, 4, 4, 6, 8, 8,10, 10, 11, 12, 31 Lower quartile is the (n + 1) ÷ 4 th value.
 ÷ 4 th value.")
44
BBC Bytesize

45
Who still likes me ?

46
Where are the quartiles of
3, 4, 4, 6, 8, 8,10, 10, 11, 12, 31 Q1 = 5 Q2 = 8 Q3 = 10.5 Excel (q 1 is the 1/4(n+3)th
th")
47
3, 4, 4, 6, 8, 8,10, 10, 11, 12, 31 IQR = 11 – 4 = 7 Range=31-3 = 28

48
Variance The variance is the average of the squared
differences between each data value and the mean. The variance is computed as follows: Note: from now on I will just give out one formula , I will use sample (inferred) formula's and not population. Saves confusion
 formula s and not population. Saves confusion.")
49
Don’t worry We will return to the data , to calculate who was the closest at guessing ages.

Similar presentations