Download presentation
Presentation is loading. Please wait.

1
Childhood Obesity in the UK: Is Fast Food a Factor? Peter Dolton (Royal Holloway College, University of London and Centre for Economic Performance, London School of Economics)
.")
2
MOTIVATION

3
Source: Brunello et al Economic Policy (2008)
")
4
Annual Reviews

5
Motivation Obesity is 2 nd biggest cause of death in the UK (after smoking). 23% of men obese and 24% of women [2008] Wanless report obesity costs - £3.6 billion a year.[2007] Obesity rates have risen by 65% for boys and 51% for girls in the last 10 years. [up to 2005] 10% of kids obese by the time of starting primary school (17% in deprived areas) [2008] Fat kids make fat adults.
 [2008] Fat kids make fat adults..")
6
KEY QUESTIONS

7
Main Research Questions: Can we explain what causes childhood obesity (and why it is rising)?
")
8
Main Research Questions: Can we explain what causes childhood obesity (and why it is rising)? Does Fast Food have a causal impact on childhood obesity (which can be identified)?
 .")
9
Main Research Questions: Can we explain what causes childhood obesity (and why it is rising)? Does Fast Food have a causal impact on childhood obesity (which can be identified)? Does Fast Food Outlet Proximity have a causal impact on Childhood Obesity?
. Does Fast Food Outlet Proximity have a causal impact on Childhood Obesity .")
10
ANSWER The answer is NO!!!!! – There is no causal link between fast food proximity and obesity Note – this does not mean that I am saying FF if you eat enough of it does not make you fat. It merely says that having a FF outlet near does not cause you to be fat.

11
How Do We Answer the Question? To answer this question properly we would need a controlled experiment – with some children exposed randomly to FF and others not. We would also need to know exactly what else the children ate to control for variations in eating patterns and calorie intake. Such data does not exist.

12
Currie, Della Vigna, Moretti and Pathania AEJ(P),NBER 2009 ‘Taken together, the weight of the evidence is consistent with a causal effect of fast-food restaurants on obesity rates among 9 th graders…’ “We find that among 9 th grade children, a fast food restaurant within one tenth of a mile from a school is associated with at least a 5.2% increase in obesity rates”.
,NBER 2009 ‘Taken together, the weight of the evidence is consistent with a causal effect of fast-food restaurants on obesity rates among 9 th graders…’ We find that among 9 th grade children, a fast food restaurant within one tenth of a mile from a school is associated with at least a 5.2% increase in obesity rates .")
13
WRONG!! US is ‘full saturated’ with FF and so no control group. They only find their effects at.1 of a mile – in the school playground!!! Hence I will look at the nearest thing we have to an experiment.

14
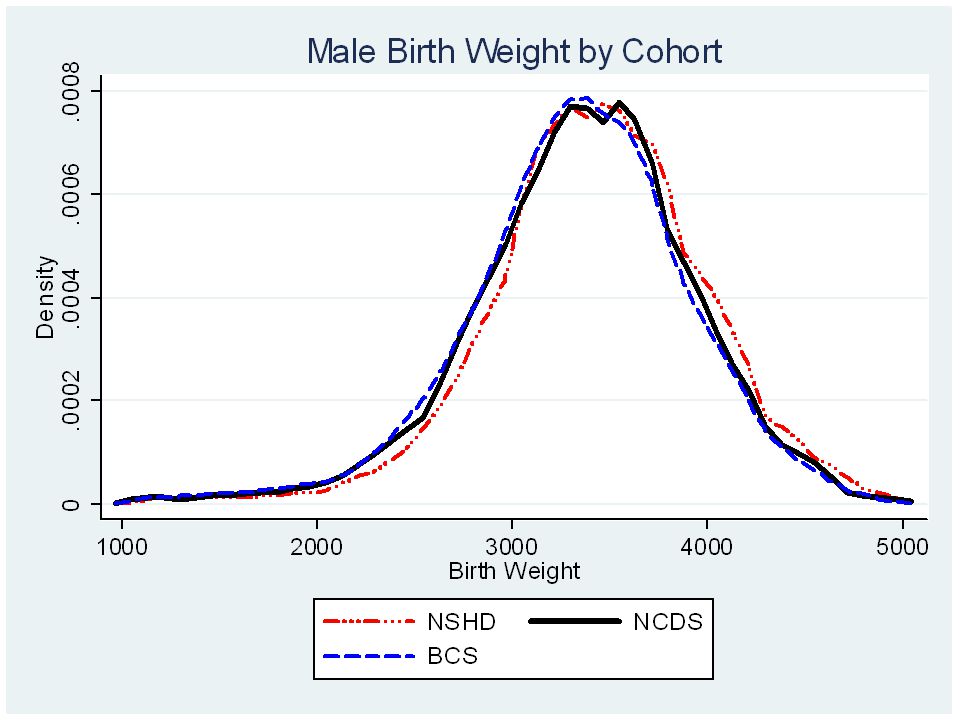
UK Cohort Data 1946 NSHD Cohort On food rationing up to age of 8. 1958 NCSD Cohort “Control cohort” 1970 BCS Cohort “Fast Food Cohort”

17
Fraction Obese by Cohort at Age 15/16. GirlsBoys NSHD - 19610.060.04 NCDS- 19740.060.05 BCS- 19860.09

18
WHAT MY RESEARCH DOES Takes a cohort of children born in 1970 (BCS 1970) and follows them through to adulthood. Merges all their data with information on WHERE and WHEN ALL fast food outlets opened in Britain. Estimates the effect of fast food outlet proximity on children’s BMI.

19
BCS70 DATA

20
BCS70 Follow-ups

21
Fast Food Data Collected data on all the fast food outlets over 1968-1986 and their year of opening and their exact location. Includes: –McDonalds –Wimpy –Burger King –Kentucky Fried Chicken

22
What counts as Fast Food?? Use Counter service Kids can buy it – served at source to eat immediately, at any time of the day, and take away. Fish and Chips was everywhere – so is assume to be a constant background effect – (as is changing supermarket food – like microwave meals) Fish and Chips only available at ‘frying times’.
 Fish and Chips only available at ‘frying times’..")
23
When did they open?

24
How can we measure Fast Food Treatment? Distance to nearest outlet. Number of outlets Currie et al (2009) use dummy if there is a FF outlet with.1 of a mile. (Also measure obesity as fraction in class x year who are obese.) I use Distance x Years of opening – to give intensity of treatment.
 use dummy if there is a FF outlet with.1 of a mile. (Also measure obesity as fraction in class x year who are obese.) I use Distance x Years of opening – to give intensity of treatment..")
25
Key Explanatory Variables Psychological Problems – ‘Any evidence of any emotional or behavioural problem since 10’ as reported by doctor. Physical Handicap – ‘Any evidence of significant illness, developmental problem, defect or handicap’ as reported by doctor. Exercise – Participation in any sport 3 times a week or more – self reported. High Calorie Diet – Consumes any of: hamburger/beef burger, pudding, butter, chocolate, sweets, ice cream, cake or buns, biscuits, chips, takeaway, white bread more than three times a week – reported by mother. Eating Problems – Parental reported eating or appetite problems. Screen Hours – Total of TV time, DVD time and computer time in a day. Teen Eats Takeaway – Teen eats Takeaway meal as reported by the mother.

28
Summary of BCS70 Findings @ 16 NO FAST FOOD EFFECT Think of average kid with BMI of 20 then 1 unit of BMI = 5% extra body mass. Both –Own BMI at age 10 (1.25 units of BMI @ 10= 1 unit of BMI) –Mothers BMI (10 units of Mothers BMI = 1 unit of BMI) –Screen Time (approx 10 hrs per day= 1 unit BMI) For Boys only: –Psychological Problems (extra.8-1.6 units of BMI) –Inner London (up to 3 units of BMI) –Mother Works (2.5 unit of BMI)
 –Mothers BMI (10 units of Mothers BMI = 1 unit of BMI) –Screen Time (approx 10 hrs per day= 1 unit BMI) For Boys only: –Psychological Problems (extra units of BMI) –Inner London (up to 3 units of BMI) –Mother Works (2.5 unit of BMI).")
29
Extra Findings Number of Takeaways per week does not correlate with BMI. Fizzy drinks alone is significant for boys – 5 drinks a day = 1 BMI Urban/Rural location is not significant. No Fast food effect at 26.

30
MAIN Conclusions In the UK Fast Food Proximity does not have an impact on childhood BMI/Obesity. In so far as it is identifiable – the effect of eating FF is not clear on BMI – we just don’t observe EXACTLY what an individual eats. Proximity of FF outlets does have an effect on FF consumption.

31
Other Findings Main factors in BMI at 16 are own BMI at 10, Mothers BMI. Exercise has no impact on BMI. Fizzy drinks do impact on BMI. Screen Time does impact on BMI. For boys emotional /behavioural problems are a factor. Increased FF consumption reduces consumption of Vit C and fibre and increases consumption of crisps, fizzy drinks and fatty food. FF outlet location is not related to where fat people live.

32
Tentative Implications Blaming Fast food outlets may be wrong. A huge fraction of overweight risk is from your genes and your family environment. Onus must be on mothers to control kids diet (and their own diet) when young. Fast food outlets don’t have information to locate where fat people are – but they do cite where poor people in work and ethnic minorities are.
 when young. Fast food outlets don’t have information to locate where fat people are – but they do cite where poor people in work and ethnic minorities are..")
33
EXTRA SLIDES

34
Outline of Talk Motivation Literature Identification and Causality? Measuring Childhood Obesity BCS Cohort Data and Fast Food Data & Fast Food Treatment. BCS 1970 Results Conclusions and Policy Implications

35
David Cameron 2008 “We talk about people being at risk of obesity instead of talking about people who eat too much and take too little exercise – its as if obesity is a purely external event like a plague or bad weather”

36
Source: Anderson et al NBER paper (2007)
")
37
The Literature - Effect Chou et al (2004) (J of H Econ)– state wide US data find an effect. Dunn (2008) (mimeo) IV of interstate exits – 10%increase in FF density – gives.33 of BMI Davis and Carpenter (2009) (Am J of Pub Health) Uses US data from CHKS over the 2002- 2005 period. Currie et al (2009) (AEJ(P), NBER) Use US data from 1999-2007 for Californian kids.
 (mimeo) IV of interstate exits – 10%increase in FF density – gives.33 of BMI Davis and Carpenter (2009) (Am J of Pub Health) Uses US data from CHKS over the period. Currie et al (2009) (AEJ(P), NBER) Use US data from for Californian kids..")
38
The Literature – No effect Burdette et al (2004) (Preventive Med) 7,000 Ohio kids. Simmons et al (2005) (Int J of Obesity) find no relationship in Australia. Powell (2009) (J of H Econ)– uses US data from NLSY data over teenagers from 1997-2003 Anderson and Matsa (2009) (mimeo) Use adjacent highways as IV and find no effect.
 (Int J of Obesity) find no relationship in Australia. Powell (2009) (J of H Econ)– uses US data from NLSY data over teenagers from Anderson and Matsa (2009) (mimeo) Use adjacent highways as IV and find no effect..")
39
What this paper does that is new: (To my knowledge) First study in the UK Set at a time when fast food outlets were growing exponentially. Use distance from home not school. Know all - not just the closest restaurants. Know the timing of the opening of the fast food restaurants - hence can work out a measure of ‘duration intensity of fast food treatment'. Uses medically measured height and weight (not self reported) Other detailed data – Mothers BMI, Screen time, mothers work etc. New identification clarity.
 Other detailed data – Mothers BMI, Screen time, mothers work etc. New identification clarity..")
40
Identification and Causality?

41
Base Model Currie et al (2009), Chou et al (2004), Burdette et al (2004), Powell (2009) BMI – is a measure of obesity R is a measure of (EXOG) FF treatment X is observable controls X* unobservables
, Chou et al (2004), Burdette et al (2004), Powell (2009) BMI – is a measure of obesity R is a measure of (EXOG) FF treatment X is observable controls X* unobservables")
42
How are R & BMI measured? Chou et al (2004), Powell (2009) measure R by number of restaurants at the state level. Currie et al (2009) measure R as the proximity of the FF outlets from school and BMI as the % of kids in a class who are ‘fit’.
, Powell (2009) measure R by number of restaurants at the state level. Currie et al (2009) measure R as the proximity of the FF outlets from school and BMI as the % of kids in a class who are ‘fit’..")
43
IV Model Anderson and Mata (2009) & Dunn(2008) Assumption here is that R is endogenous and we need to find IVs, Z for it. Anderson & Matsa use interstate highways and Dunn uses exits.

44
Full Model Here we make a distinction between consumption of FF and Proximity of FF outlets. T is a measure of Take-away consumption. May be endog – in which case could use FF outlet proximity, R as an IV.

45
Measuring Childhood Obesity

46
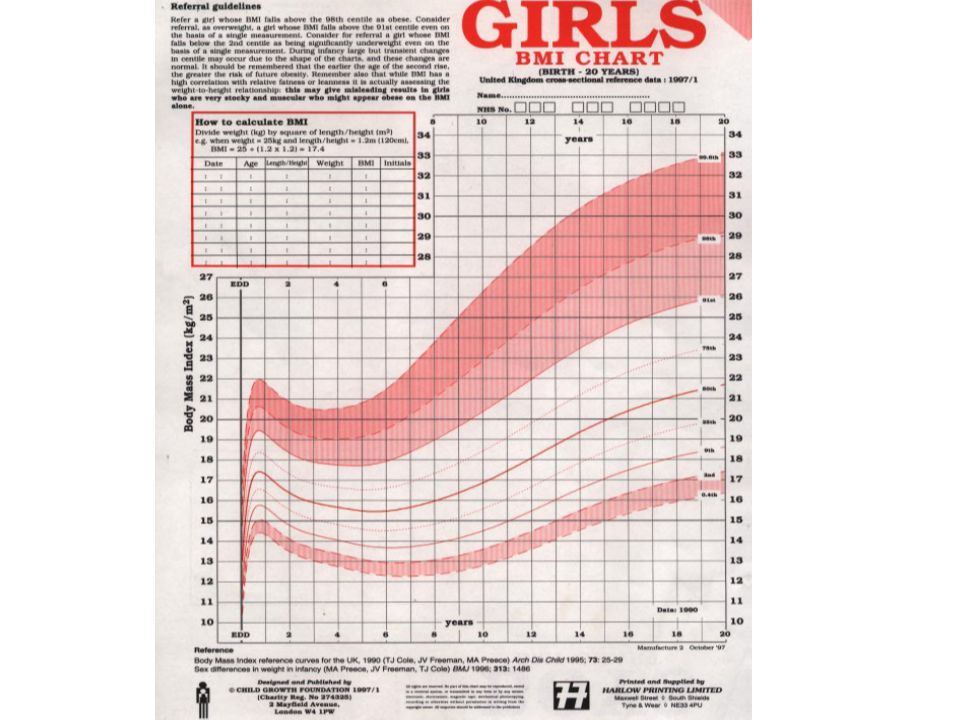
How do we measure BMI? BMI – Quetelet Index

47
BMI Classification for Adults

48
BMI for kids Use the LMS tables generated by Pan and Cole for the MRC Gives Obese BMIs as: AgeBoysGirls 1020.2721.35 1624.925.85

50
Fraction Obese by Cohort at Age 15/16. GirlsBoys NSHD - 19610.0670.044 NCDS- 19740.0640.054 BCS- 19860.0870.086

51
Local Examples Norwich –1978 Wimpy opened (Ipswich had one in 1977!!!) –1981 McDonalds opened –8 Fast food outlets by 1981 Lancaster 1977 Wimpy opened 1980 McDonalds opened 4 Fast food outlets by 1980
 –1981 McDonalds opened –8 Fast food outlets by 1981 Lancaster 1977 Wimpy opened 1980 McDonalds opened 4 Fast food outlets by 1980")
52
Duration Intensity Treatment of Fast Food Where Y is years since outlet k opened, and d is distance from individual i. This measures DITFF for less than 5 miles.

53
8 year @ 1 mile ==2(1 year @ 4 miles) Example: Duration Intensity of Fast Food Treatment Additive Measure
 Example: Duration Intensity of Fast Food Treatment Additive Measure")
55
Reasons why it is interesting to look at location of kids home and fast food outlets: 1. At least 50% of the days in a year kids dont go to school if we count weekends and holidays and absence. They are only there for 6 hours and all but 1 are in lessons. So only around 2-3% of time can get FF at school. 2. Only 2.2% of primary kids age 10 in 1980 ate their midday meal outside school but not in the family home. 3. Only 15% of secondary kids age 16 in 1986 ate their midday meal outside school but not in the family home.

58
Full Model Here we make a distinction between consumption of FF and Proximity of FF outlets. T is a measure of Take-away consumption. May be endog – in which case could use FF outlet proximity, R as an IV.

59
Eqn (3.2) First Stage IV
 First Stage IV")
62
Identification Issue Does living near Fast Food outlet ‘cause’ you to be fat? OR Do Fast Food outlets cite near people who are fat and/or do people who have a propensity to be fat choose to live near FF outlets?

63
Full Model Here we make a distinction between consumption of FF and Proximity of FF outlets. T is a measure of Take-away consumption. May be endog – in which case could use FF outlet proximity, R as an IV.

64
Trying to establish Causality?! Took all the Youth Cohort Surveys 1-7 over the whole period of the 1983-1992 to characteristics of the LEAs:

67
Source from Cummins et al (2005) Int J of Behavioral Nutrition and Physical Activity.
 Int J of Behavioral Nutrition and Physical Activity.")
68
Possible explanations of why I dont find anything of a fast food effect: 1. Using home rather than school. 2. Just too early - the data which finds an effect is for the US and in the 2000s. Powell uses US data from NLSY data over teenagers from 1997-2003 Davis (2009) Uses US data from CHKS over the 2002-2005 period. Currie et al (2009) Use US data from 1999-2007 for Californian kids. 3. Its just a US effect - At present there is no evidence from any other country that there is an effect. Simmons et al (2005) find no relationship in Australia. 4. Methodology or claimed causality on other papers is dubious. How can we be sure that fast food restaurants do not locate where fat people (or people who have a propensity to consume more highly) live. i.e. fast food outlets locate where there are already fat people rather than the location of the fast food outlet causes people to become fat. All the papers purporting to find this effect do not satisfactorily tackle this question. 5. My measure of intensity of treatment is wrong. 6.There simply is no causal effect for proximity of fast to children's whereabouts. 7.Takeaways do not induce BMI gain as kids substitute calories when they take fast food – we do not have good enough data to tell us about how FF substitutes for other food.
 Uses US data from CHKS over the period. Currie et al (2009) Use US data from for Californian kids. 3. Its just a US effect - At present there is no evidence from any other country that there is an effect. Simmons et al (2005) find no relationship in Australia. 4. Methodology or claimed causality on other papers is dubious. How can we be sure that fast food restaurants do not locate where fat people (or people who have a propensity to consume more highly) live. i.e. fast food outlets locate where there are already fat people rather than the location of the fast food outlet causes people to become fat. All the papers purporting to find this effect do not satisfactorily tackle this question. 5. My measure of intensity of treatment is wrong. 6.There simply is no causal effect for proximity of fast to children s whereabouts. 7.Takeaways do not induce BMI gain as kids substitute calories when they take fast food – we do not have good enough data to tell us about how FF substitutes for other food..")
70
Issues in Obesity Literature. Does maternal working play a role in childhood obesity? (Anderson et al 19 ) Is SES related to obesity? (Baum and Ruhm ) Does mothers BMI impact on childs obseity (Parsons et al ) Height is related to Earnings. (Case and Paxson) BMI is negatively related to earnings for women. Blanchflower and Sargent (1980) Morris Childhood obesity is not linked to adult outcomes (Viner and Cole) Relation between screen viewing and obesity.
 Is SES related to obesity. (Baum and Ruhm ) Does mothers BMI impact on childs obseity (Parsons et al ) Height is related to Earnings. (Case and Paxson) BMI is negatively related to earnings for women. Blanchflower and Sargent (1980) Morris Childhood obesity is not linked to adult outcomes (Viner and Cole) Relation between screen viewing and obesity..")
71
Other Geographical Studies Cummins & MacIntyre (2005) (Int J of Epidemiolgy) Cummins et al (2005) Int J of Behavioral Nutrition and Physical Activity. Morland & Evenson (2009) (Health and Place)
 (Health and Place).")
72
The Data 1946 NSHD Cohort On food rationing since up to age of 8. 1958 NCSD Cohort “Control cohort” 1970 BCS Cohort “Fast Food Cohort”

73
NHSD Follow-ups Socially structured sample of 5362 singletons born in one week in March 1946. Followed at Birth 2,4response 95% 6,7,8,9,10,11,13,15 response 85%

74
NCDS Follow-ups

79
Additional features of the data: Have a 'rationed' and 'control' generation to examine the context of weight gain of teenagers over the period 1962-1986. Have repeated measure of BMI - i.e. longitudinal data and can model changes and identify changes in intensity of fast food treatment on weight gain. Know an extremely rich set of covariates including mothers and father own BMI - no other studies have access to such controlling data to provide a context of genetic and family environment factors.

82
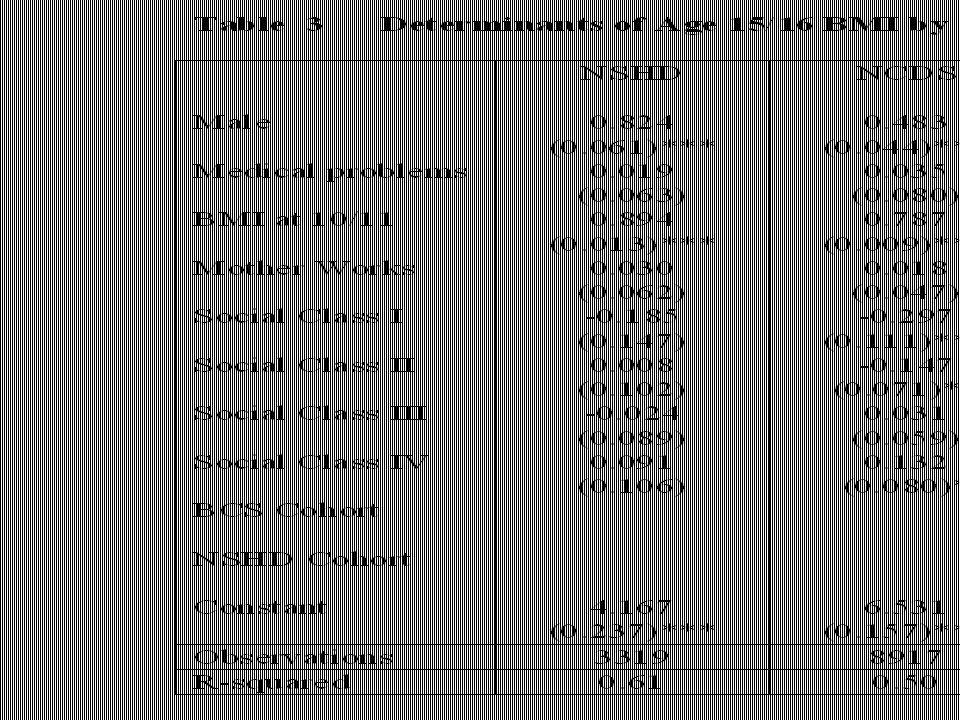
Main Results of Cross Cohort Comparison At 10/11 mother works increases BMI At 10/11 social class effects At 10/11 Birth weight effects. At 15/16 still social class effects At 15/16 no mother works effect At 15/16 BMI @ 10/11 is main driver.

Similar presentations