Download presentation
Presentation is loading. Please wait.

1
Quality Management for Organizational Excellence
By: Dr. David L. Goetsch and Stanley Davis Based on the book Quality Management for Organizational Excellence (Sixth Edition)
")
2
Instructor Info. Dr. Mohammed A. Nasseef
Website: Contact Number: ( SMS and whatsApp) note: mobile number is for urgent calls, please if you call consider a appropriate time.
 note: mobile number is for urgent calls, please if you call consider a appropriate time.")
3
Grading Policy case study Project 20 Quiz 1 10 Quiz 2 10
Class Participation Final Exam ________________ TOTAL

4
One: The Total Quality Approach to Quality Management
MAJOR TOPICS Quality Evolution What is Quality? The Total Quality Approach Defined Two Views of Quality Key Elements of Total Quality Total Quality Pioneers

5
Quality Evolution

6
Evolution of Quality I Inspecting the past Finding mistakes/errors
External assessment/control Culture of mistrust Inspecting the past

7
Evolution of Quality II
avoid mistakes personal responsibility / ownership culture of trust Looking into the past and plan for the future

8
Evolution of Quality III
Systematic fulfillment of customer requirements

9
Evolution of Quality IV
Participation of all members of an organization

10
Quality is Everywhere people deal with the issue of quality
continually in their daily lives We all apply a number of criteria when making a purchase To understand quality as a consumer-driven concept How will you judge the quality of the restaurant? Service Response time Food preparation Atmosphere Price Selection

11
What is Quality * Quality must be defined comprehensively. It is not enough to say the product is of high quality; we must focus attention on the quality of every facet of the organization. * Consumers' needs and requirements change. Therefore, the definition of quality is ever changing. shikawa's

12
What is Quality Fred Smith. CEO of FedEx defines quality as “ performance to the standard expected by customer “ Boeing “ providing our customer with products and services that consistently meet their needs and expectations”

13
So Quality Is … Although there is no universally accepted definition of quality. There are some similarity among among quality definition: Quality involves meeting or exceeding customer expectations. Quality applies to products, services, people, processes, and environments. Quality is ever changing state (i.e., what consider quality today may not good enough to be considered quality tomorrow).
.")
14
Why TQM? Ford Motor Company had operating losses of $3.3 billion between 1980 and 1982. Xerox market share dropped from 93% in 1971 to 40% in 1981. Attention to quality was seen as a way to combat the competition.

15
Therefore, TQM is the art of managing the whole to achieve excellence.
Total - made up of the whole Quality - degree of excellence a product or service provides Management - act, art or manner of planning, controlling, directing,…. Therefore, TQM is the art of managing the whole to achieve excellence.

16
What does TQM mean? Total Quality Management means that the organization's culture is defined by and supports the constant attainment of customer satisfaction through an integrated system of tools, techniques, and training. This involves the continuous improvement of organizational processes, resulting in high quality products and services.

17
What’s the goal of TQM? “Do the right things right the first time, every time.”

18
Another way to put it At it’s simplest, TQM is all managers leading and facilitating all contributors in everyone’s two main objectives: (1) total client satisfaction through quality products and services; and (2) continuous improvements to processes, systems, people, suppliers, partners, products, and services.
 total client satisfaction through quality products and services; and. (2) continuous improvements to processes, systems, people, suppliers, partners, products, and services.")
19
Basic belief of TQM 1. The customer makes the ultimate determination of quality. 2. Top management must provide leadership and support for all quality initiatives. 3. Preventing variability is the key to producing high quality. 4. Quality goals are a moving target, thereby requiring a commitment toward continuous improvement. 5. Improving quality requires the establishment of effective metrics. We must speak with data and facts not just opinions.

20
The three aspects of TQM
Counting Customers Culture Tools, techniques, and training in their use for analyzing, understanding, and solving quality problems Quality for the customer as a driving force and central concern. Shared values and beliefs, expressed by leaders, that define and support quality.

21
Total Quality Management and Continuous Improvement
TQM is the management process used to make continuous improvements to all functions. TQM represents an ongoing, continuous commitment to improvement. The foundation of total quality is a management philosophy that supports meeting customer requirements through continuous improvement.

22
Continuous Improvement versus Traditional Approach
Customer focus Cross-functional teams Focus on “what” and “how” Long-term focus Continuous improvement Process improvement focus Incremental improvements Problem solving Market-share focus Individuals Focus on ‘who” and “why” Short-term focus Status quo focus Product focus Innovation Fire fighting

23
Quality Throughout “A Customer’s impression of quality begins with the initial contact with the company and continues through the life of the product.” Customers look to the total package - sales, service during the sale, packaging, deliver, and service after the sale. Quality extends to how the receptionist answers the phone, how managers treat subordinates, how courteous sales and repair people are, and how the product is serviced after the sale. “All departments of the company must strive to improve the quality of their operations.”

24
Value-based Approach Manufacturing Dimensions Service Dimensions
Performance Features Reliability Conformance Durability Serviceability Aesthetics Perceived quality Service Dimensions Reliability Responsiveness Assurance Empathy Tangibles

25
The TQM System Continuous Improvement Objective Principles Elements
Customer Focus Process Improvement Total Involvement Leadership Education and Training Supportive structure Communications Reward and recognition Measurement Elements

26
The Total Quality Approach to Quality Management
Trends affecting the future of quality management include demanding global customers, shifting customer expectations, and opposing economic pressures

27
W. Edwards Deming Total Quality Pioneers: Born on October 14, 1900
Was an American statistician, professor, author, lecturer, and consultant Widely credited with improving production in the United States during the Cold War Best known for work in Japan Taught top management (1950 onwards)
")
28
W. Edwards Deming Quality keys: Understanding customer needs
Process improvement Statistical analysis Expertise of workers PDCA cycle

29
DEMING 14 POINTS Create constancy of purpose Adopt a new philosophy
Stop dependence on inspection Don’t focus on price tag Improve constantly & forever

30
DEMING 14 POINTS Institute training Institute leadership
Drive out fear Break down barriers Eliminate slogans, exhortations

31
DEMING 14 POINTS Eliminate quotas; use leadership
Remove barriers to workmanship strong education program Involve everybody

32
The Deming Cycle The Deming cycle, or PDSA cycle, is a continuous quality improvement model consisting of a logical sequence of four repetitive steps for continuous improvement and learning: Plan, Do, Study (Check) and Act. It is also known as the Deming circle/cycle/wheel, Shewhartcycle, control circle/cycle, or plan–do–study–act (PDSA)
 and Act. It is also known as the Deming circle/cycle/wheel, Shewhartcycle, control circle/cycle, or plan–do–study–act (PDSA)")
33
The Deming Cycle W. Edwards Deming in the 1950's proposed that business processes should be analyzed and measured to identify sources of variations that cause products to deviate from customer requirements. He recommended that business processes be placed in a continuous feedback loop so that managers can identify and change the parts of the process that need improvements.

34
The Deming Cycle Example :
At Toyota this is also known as "Building people before building cars.“ Toyota and other Lean companies propose that an engaged, problem solving workforce, using PDCA, is better able to innovate and stay ahead of the competition through rigorous problem solving and the subsequent innovations. This also creates a culture of problem solvers using PDCA and creating a culture of critical thinkers.

35
Foundations of the PDCA Cycle
The foundations of the PDCA cycle and Deming’s teachings consist of the following three principles: Customer Satisfaction: Satisfying customers’ needs should be paramount for all workers in the organization. Management by Fact. Decision making must be made on data collected from operations and analyzed using statistical tools. Decision makers must practice and encourage a scientific approach to problem solving. Respect for People. A sustainable problem solving and continuous improvement approach should be based on the belief that employees are self-motivated and are capable of coming up with effective and creative ideas.

36
Steps of PDCA: The Plan step
Recognize the problem and establish priorities. Form the problem solving team. Interdisciplinary teams of individuals close to the problem are best. Define the problem and its scope clearly. Who,What,Where and When. Pareto Analysis can be useful in defining the problem. Analyze the problem/process. Process flowcharts can be useful a useful tool. Determine possible causes. Cause-and-effect diagrams are helpful in identifying root causes of a problem. Data from the diagrams can be organized using check sheets, scatter diagrams, histograms, and run charts. Identify possible solutions. Brainstorm to find solutions. Avoid the temptation to propose quick, immediate fixes. Goals should be specific, measurable, achievable, and realistic. Evaluate potential solutions. Focus on solutions that address root causes and prevention of problem occurrence. Solutions should be cost-effective; achieving group consensus is important.

37
Steps of PDCA (continued)
The Do step Implement the solution or process change Monitor results and collect data The Check step Review and evaluate the result of the change Measure progress against milestones Check for any unforeseen consequences The Act step If successful, Standardize process changes Communicate to all involved Provide training in new methods

38
Problem Solving Tools Check Sheet. A simple tool for collecting data about problems or complaints. Example 1.

39
Problem Solving Tools (continued)
2. Histogram. A graph which presents the collected data as a frequency distribution in bar-chart form. Example 1

40
Problem Solving Tools (continued)
Pareto Chart. Orders problems by their relative frequency in decreasing order. Focus and priority should be given to problems that offer the largest potential improvement.

41
Problem Solving Tools (continued)
4. Scatter Diagram. A graphical tool to check if two relationships exist between two variables.

42
Problem Solving Tools (continued)
5. Flowchart. A visual representation of a process which can help in identifying points where failures may occur and intervention is useful. Example 2

43
Problem Solving Tools (continued)
6. Cause-and-effect diagram (fishbone diagram). Offers a structured approach for identifying all possible causes of a problem. The classic diagram is as shown: In retail, a better representation is the 5S (Pal & Byron 2003):
. Offers a structured approach for identifying all possible causes of a problem. The classic diagram is as shown: In retail, a better representation is the 5S (Pal & Byron 2003):")
44
Cost of Quality (CoQ) Any serious attempt to improve quality must take into account the costs associated with achieving quality since the objective of continuous improvement programs is not only to meet customer requirements, but also to do it at the lowest cost. This can only happen by reducing the costs needed to achieve quality, and the reduction of these costs is only possible if they are identified and measured. Therefore, measuring and reporting the cost of quality (CoQ) should be considered an important issue for managers.
 should be considered an important issue for managers.")
45
definition There is no general agreement on a single broad definition of quality costs (Machowski and Dale, 1998). However, CoQ is usually understood as the sum of conformance plus non-conformance costs, where cost of conformance is the price paid for prevention of poor quality (for example, inspection and quality appraisal) and cost of non-conformance is the cost of poor quality caused by product and service failure(for example, rework and returns).
 and cost of non-conformance is the cost of poor quality caused by product and service failure(for example, rework and returns).")
46
Cost of Poor Quality (COQ) continue It was Armand Feigenbaum, who in 1943 first devised a quality costing analysis when he and his team developed a dollar-based reporting system. later proposed the now widely accepted quality cost categorization of prevention, appraisal and failure (internal and external) costs
 costs.")
47
(COQ) continue Many business executive adopt the attitude that ensuring quality is good thing to do until hard times set in and cost cutting is necessary.

48
Generic CoQ models Feigenbaum Model P-A-F models
Prevention + appraisal + failure Crosby’s model Conformance + non-conformance Opportunity or intangible cost models Prevention + appraisal + failure + opportunity Conformance + non-conformance + opportunity ABC models Value-added + non-value-added

49
Cost of Quality Cost of Achieving Good Quality Cost of Poor Quality
Prevention costs costs incurred during product design Appraisal costs costs of measuring, testing, and analyzing Cost of Poor Quality Internal failure costs include scrap, rework, process failure, downtime, and price reductions External failure costs include complaints, returns, warranty claims, liability, and lost sales

50
Prevention Costs Quality planning costs Product-design costs
costs of developing and implementing quality management program Product-design costs costs of designing products with quality characteristics Process costs costs expended to make sure productive process conforms to quality specifications Training costs costs of developing and putting on quality training programs for employees and management Information costs costs of acquiring and maintaining data related to quality, and development of reports on quality performance

51
Appraisal Costs Inspection and testing Test equipment costs
costs of testing and inspecting materials, parts, and product at various stages and at the end of a process Test equipment costs costs of maintaining equipment used in testing quality characteristics of products Operator costs costs of time spent by operators to gar data for testing product quality, to make equipment adjustments to maintain quality, and to stop work to assess quality

52
Internal Failure Costs
Scrap costs costs of poor-quality products that must be discarded, including labor, material, and indirect costs Rework costs costs of fixing defective products to conform to quality specifications Process failure costs costs of determining why production process is producing poor-quality products Process downtime costs costs of shutting down productive process to fix problem Price-downgrading costs costs of discounting poor-quality products—that is, selling products as “seconds”

53
External Failure Costs
Customer complaint costs costs of investigating and satisfactorily responding to a customer complaint resulting from a poor-quality product Product return costs costs of handling and replacing poor-quality products returned by customer Warranty claims costs costs of complying with product warranties Product liability costs litigation costs resulting from product liability and customer injury Lost sales costs costs incurred because customers are dissatisfied with poor quality products and do not make additional purchases

54
Costs of Quality Prevention costs Appraisal costs
Internal failure costs External failure costs

55
Costs of Quality Example
Vegas Photo Corporation made 10,000 photocopying machines last year. Vegas Photo determines the costs of quality of its photocopying machines using a 7-step activity-based costing approach.

56
Costs of Quality (Steps 1 and 2)
Identify cost objects. Identify the direct costs of quality of the products. 10,000 photocopying machines No direct costs of quality

57
Costs of Quality (Step 3)
Select the cost-allocation bases to use for allocating indirect costs of quality to the products. Prevention Appraisal Internal failure External failure Information on the total quantities of each of these cost-allocation bases used in all of Vegas operations is not provided.

58
Costs of Quality (Step 4)
Identify the indirect costs of quality associated with each cost-allocation base. Information about total (fixed and variable) costs is not provided.
 costs is not provided.")
59
Costs of Quality (Step 5)
calculate the rate per unit. Inspection hours is one cost-allocation base.

60
Costs of Quality (Step 5)
Prevention costs: Design engineering (R&D) $80 per hour Process engineering (R&D) $60 per hour Appraisal costs: Inspection (Manufacturing) $40 per hour
 $80 per hour. Process engineering (R&D) $60 per hour. Appraisal costs: Inspection (Manufacturing) $40 per hour.")
61
Costs of Quality (Step 5)
Internal failure costs: Rework (Manufacturing) $100 per hour External failure costs: Customer support (Marketing) $ 50 per hour Transportation (Distribution) $240 per load Warranty repair (Customer Service) $110 per hour
 $100 per hour. External failure costs: Customer support (Marketing) $ 50 per hour. Transportation (Distribution) $240 per load. Warranty repair (Customer Service) $110 per hour.")
62
Costs of Quality (Step 6)
calculate the indirect costs of quality allocated to the product.

63
Costs of Quality (Step 6)
Prevention costs: Design engineering (R&D) 20,000 hours Process engineering (R&D) 22,500 hours Appraisal costs: Inspection (Manufacturing) 120,000 hours
 20,000 hours. Process engineering (R&D) 22,500 hours. Appraisal costs: Inspection (Manufacturing) 120,000 hours.")
64
Costs of Quality (Step 6)
Internal failure costs: Rework (Manufacturing) ,000 hours External failure costs: Customer support (Marketing) ,000 hours Transportation (Distribution) ,500 loads Warranty repair (Customer Service) 60,000 hours
 50,000 hours. External failure costs: Customer support (Marketing) 6,000 hours. Transportation (Distribution) 1,500 loads. Warranty repair (Customer Service) 60,000 hours.")
65
Costs of Quality (Step 6)
What is the total cost for design engineering? 20,000 hours × $80 = $1,600,000 What is the total cost for inspection? 120,000 hours × $40 = $4,800,000

66
Costs of Quality (Step 6)
Cost of Quality and Value Chain Category Total Costs Prevention costs: Design engineering (R&D) $1,600,000 Process engineering (R&D) 1,350,000 Total $2,950,000 Appraisal costs: Inspection $4,800,000
 $1,600,000. Process engineering (R&D) 1,350,000. Total $2,950,000. Appraisal costs: Inspection $4,800,000.")
67
Costs of Quality (Step 6)
Cost of Quality and Value Chain Category Total Costs Internal failure costs: Rework (Manufacturing) $5,000,000
 $5,000,000.")
68
Costs of Quality (Step 6)
Cost of Quality and Value Chain Category Total Costs External failure costs: Customer support (Marketing) $ 300,000 Transportation (Distribution) ,000 Warranty repair (Customer Service) 6,600,000 Total $7,260,000
 $ 300,000. Transportation (Distribution) 360,000. Warranty repair (Customer Service) 6,600,000. Total $7,260,000.")
69
Costs of Quality (Step 7)
Compute the total costs of quality of the product. Prevention costs $ 2,950,000 Appraisal costs ,800,000 Internal failure costs ,000,000 External failure costs ,260,000 Total $20,010,000

70
Traditional Cost of Poor Quality
(4-5% of Sales) When quality costs are initially determined, the categories included are the visible ones as depicted in the iceberg below. Waste Testing Costs Rework Customer Returns Inspection Costs Rejects Recalls
 When quality costs are initially determined, the categories included are the visible ones as depicted in the iceberg below. Waste. Testing Costs. Rework. Customer Returns. Inspection Costs. Rejects. Recalls.")
71
Cost of Poor Quality Cost of Poor Quality As an organization gains a broader definition of poor quality, the hidden portion of the iceberg becomes apparent. Late Paperwork High Costs Pricing or Billing Errors Excessive Services Expenses Incorrectly Completed Sales Order Lack of Follow-up on Current Programs Employee Turnover Planning Delays late delivery Complaint Handling Unused Capacity Time with Dissatisfied Customer Excessive Overtime Waste Testing Costs Rework Customer Returns Inspection Costs Rejects Recalls Development Cost of Failed Product Hidden COPQ: The costs incurred to deal with these chronic problems Premium cargo Costs Customer Allowances COPQ ranges from 15-25% of Sales

72
Malcolm Baldrige National Quality Award

73
MBNQA In the 1980s, many industry and government leaders saw that a renewed emphasis on quality was no longer an option for American organisations, rather, it was a necessity for doing business in an ever expanding, and more demanding competitive global market. The Baldrige Award was therefore envisaged as a standard of excellence that would help US organisations achieve world-class quality

74
Malcolm Baldrige 1981-87 secretary of Commerce.
supporter of quality management as key to US economic survival Helped draft early version of quality act Resolved technology transfer differences with China and India First Cabinet-level meetings with Soviet Union in 7 years Paved way for increased access for US firms

75
Champion Roper National Cowboy Hall of Fame
July 25, 1987 N. California rodeo Horse threw him, fell on him, and crushed him

76
WHY Baldrige ? Purpose of MBNQA to enhance US competitivenes
Promotes quality awareness, recognizes achievements of US companies Vehicle for sharing success strategies ISO covers less than 10 percent of the Baldrige award criteria Many apply, few are selected MBNQA not required for business

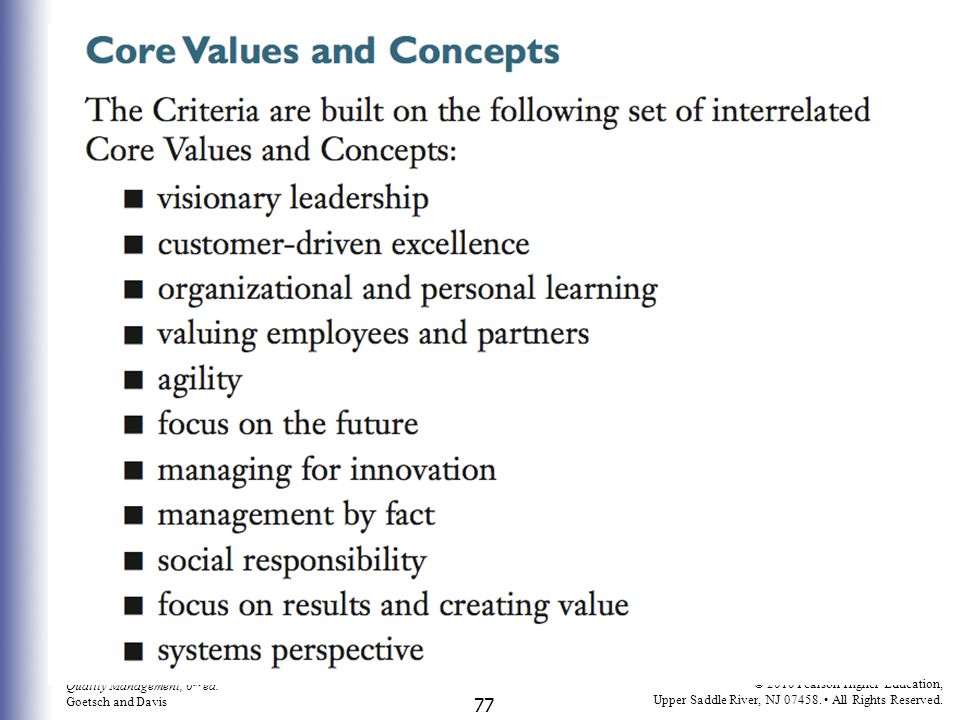
78
Each category has several items (18 total), and each item has several “areas to address”
, and each item has several areas to address")
80
Point Values

81
ADLI = Approach, Deployment, Learning, Integration

82
Categories Manufacturing Service Small Business Education (added 1999)
Health Care (added 1999) Nonprofit (2005)
 Nonprofit (2005)")
83
Leadership Examines how senior executives guide the company and how the company addresses its responsibilities to the public and practices good citizenship. 1.1 Organizational Leadership 1.2 Social Responsibility

84
Strategic planning Examines how the company sets strategic directions and how it determines key action plans. 2.1Strategy Development 2.2 Strategy Deployment

85
Customer and market focus
Examines how the company determines requirements and expectations of customers and markets. 3.1Customer and Market Knowledge 3.2 Customer Relationships and Satisfaction

86
Information and analysis
Examines the management, effective use, and analysis of data and information to support key company processes and the company’s performance management system. 4.1Measurement and Analysis of Organizational Performance 4.2 Information and Knowledge Management

87
Human resource focus Examines how the company enables its workforce to develop its full potential and how the workforce is aligned with the company’s objectives. 5.1 Work Systems 5.2 Employee Learning and Motivation 5.3 Employee Well-Being and Satisfaction

88
Process management Examines aspects of how key production/delivery and support processes are designed, managed, and improved. 6.1V alue Creation Processes 6.2 Support Processes

89
Business results Examines the company’s performance and improvement in its key business areas: customer satisfaction, financial and marketplace performance, human resources, supplier and partner performance, and operational performance. The category also examines how the company performs relative to competitors. better market performance, gains in market share, and customer retention and satisfaction

90
Baldrige Award Recipients
Group project Baldrige Award Recipients

92
MidwayUSA - customer focus
MidwayUSA, a 2009 Baldrige Award winner in the small business category, utilizes a customer-first culture and many customer-focused approaches to building trust, confidence, and loyalty at all stages of the customer relationship. MidwayUSA’s commitment to the customer is hard-wired into the company’s vision, purpose, mission, and values; Company Goals; and Code of Conduct . The vision itself says it all: “To be the best-run business in America for the benefit of our Customers.” —

93
MidwayUSA - customer focus cont.
This customer-focused philosophy is carried out in many different approaches, including the following: - All salaried employees (including senior leaders) spend at least one hour each week on the phone taking orders and answering customer requests. - Employees are selected for leadership development based on their support of the company’s core value of “Customer-Driven Excellence” in addition to other performance-based criteria. Employees also are encouraged to participate in industry-related events.
 spend at least one hour each week on the phone taking orders and answering customer requests. - Employees are selected for leadership development based on their support of the company’s core value of Customer-Driven Excellence in addition to other performance-based criteria. Employees also are encouraged to participate in industry-related events.")
94
MidwayUSA - customer focus cont.
- Employees’ performance reviews are aligned with key customer requirements. For example, customer service representatives are evaluated on their performance in relation to the requirement for “Friendly, Courteous, Respectful, and Ethical Service.” - Direct access is provided to the company’s founder and CEO, Larry Potterfield, via the Larry Line. Potterfield also role-models the customer-first philosophy by being very visible and accessible (“The Face of MidwayUSA”) to customers at industry and other public events.
 to customers at industry and other public events.")
95
MidwayUSA - customer focus cont.
Customer input on improving operations is solicited via the company’s Web site by regularly featuring online surveys, posting customer reviews of the company’s products, and providing an “I’m Having Trouble Finding” option so customers can suggest additions to product lines.

Similar presentations


 Grants Chapter 6.>")


 Motion Controller Design for A Class of Second-order Systems Center for Self-Organizing Intelligent.>")
