Download presentation
Presentation is loading. Please wait.

1
Brookhaven National Laboratory—9 September 2008 Evidence of Correlations Between Nuclear Decay Rates and Solar Activity Jere Jenkins Ephraim Fischbach John Buncher Tom Gruenwald Dennis Krause Josh Mattes John Newport

2
Brookhaven National Laboratory—9 September 2008 References Perturbation of Nuclear Decay Rates During the Solar Flare of 13 December 2006 (Jere H. Jenkins, Ephraim Fischbach) http://arxiv.org/abs/0808.3986 http://arxiv.org/abs/0808.3986 Evidence for Correlations Between Nuclear Decay Rates and Earth-Sun Distance (Jere H. Jenkins, Ephraim Fischbach, John B. Buncher, John T. Gruenwald, Dennis E. Krause, Joshua J. Mattes ) http://arxiv.org/abs/0808.3283http://arxiv.org/abs/0808.3283
 Evidence for Correlations Between Nuclear Decay Rates and Earth-Sun Distance (Jere H. Jenkins, Ephraim Fischbach, John B. Buncher, John T. Gruenwald, Dennis E. Krause, Joshua J. Mattes )")
3
Brookhaven National Laboratory—9 September 2008 Outline Brief history of radioactivity Brookhaven National Laboratory 32 Si data (Alburger, Harbottle, and Norton) PTB 226 Ra data (Siegert, Schrader, and Schötzig) BNL/PTB correlations 2006 December solar flare data Discrepancies in half-life measurements Possible mechanisms Spacecraft and other tests
 PTB 226 Ra data (Siegert, Schrader, and Schötzig) BNL/PTB correlations 2006 December solar flare data Discrepancies in half-life measurements Possible mechanisms Spacecraft and other tests")
4
Brookhaven National Laboratory—9 September 2008

6
From: Radioactive Substances and Their Radiations, by Rutherford,

7
Brookhaven National Laboratory—9 September 2008 116m In T 1/2 =54.2 min

8
Brookhaven National Laboratory—9 September 2008

10
A New Test of Randomness

11
Brookhaven National Laboratory—9 September 2008

18
Pearson Correlation Coefficient r=0.52, N=239, Prob=4.17x10 -18 Data from: Alburger, et al., Earth and Planet. Sci. Lett., 78, (1986) 168-176
")
19
Brookhaven National Laboratory—9 September 2008 Pearson Correlation Coefficient r=0.66, N=233, Prob=1.0x10 -31 Data from: Alburger, et al., Earth and Planet. Sci. Lett., 78, (1986) 168-176
")
20
Brookhaven National Laboratory—9 September 2008

22
Pearson Correlation Coefficient r=0.62, N=1974, Prob=5.13x10 -210 Data from Siegert, et al., Appl. Radiat. Isot. 49, 1397 (1998) Fig. 1
 Fig. 1.")
23
Brookhaven National Laboratory—9 September 2008 Pearson Correlation Coefficient r=0.65, N=1968, Prob=3.12x10 -246 Data from Siegert, et al., Appl. Radiat. Isot. 49, 1397 (1998) Fig. 1
 Fig. 1.")
24
Brookhaven National Laboratory—9 September 2008 Pearson Correlation Coefficient r=0.66, N=39, Prob=5.8x10 -6

25
Brookhaven National Laboratory—9 September 2008 Pearson Correlation Coefficient r=0.87, N=35, Prob=3.78x10 -12

26
Brookhaven National Laboratory—9 September 2008 Pearson Correlation Coefficient r=0.89, N=33, Prob=1.85x10 -12

27
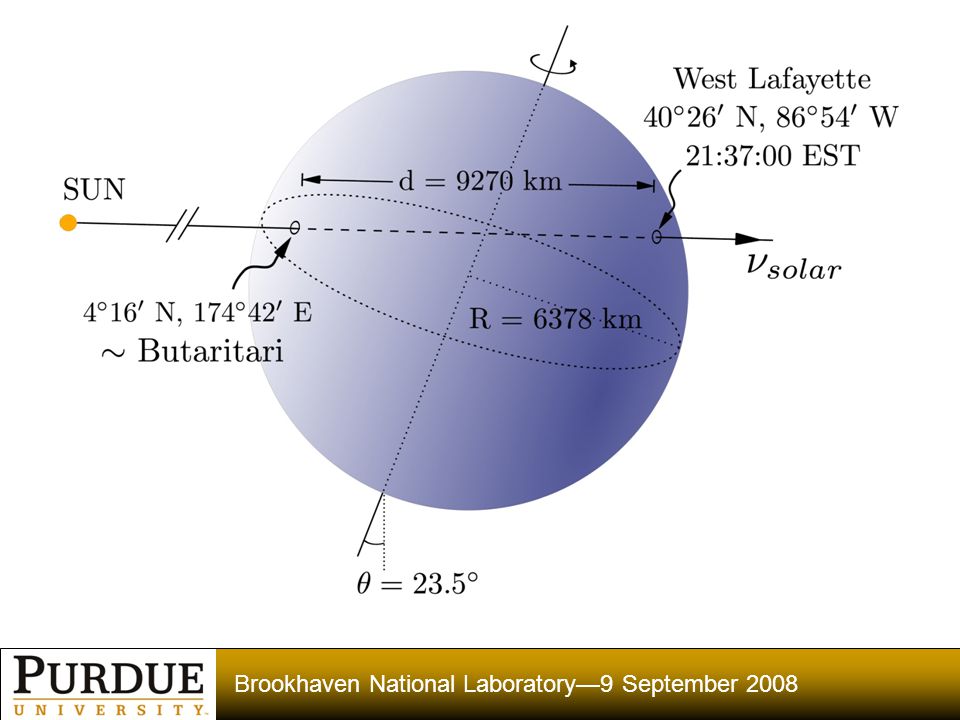
Brookhaven National Laboratory—9 September 2008 Motivation for Purdue Experiments Correlation between BNL and PTB data Correlation of these data with 1/R 2 Earth- Sun distance

28
Brookhaven National Laboratory—9 September 2008

31
Sunspot 930 Source of Dec 06 Flares

32
Brookhaven National Laboratory—9 September 2008 (7.51±1.07) x 10 5 Events missing
 x 10 5 Events missing")
33
Brookhaven National Laboratory—9 September 2008

37
Data from Yoo, et al., Phys Rev D 68, 092002 (2003)
")
38
Brookhaven National Laboratory—9 September 2008

39
H. Schrader, Appl. Rad. & Iso., 60 (2004) 317-323
")
40
Brookhaven National Laboratory—9 September 2008 StartStopTotal eventsslope (a)=σa=T1/2Significance PHARM 0-3910/19/06 17:1010/26/06 16:181,125,533,997-0.0020575621.45E-05336.878-11.28 PHARM 40-7910/26/06 20:3511/02/06 18:331,107,115,186-0.0021373211.48E-05324.307-5.65 PHARM 80-11911/02/06 22:5011/10/06 16:041,087,799,523-0.0026844311.27E-05258.21036.59 PHARM 120-15911/10/06 20:2011/17/06 18:551,070,959,137-0.0020019811.49E-05346.230-14.69 PHARM 160-19911/17/06 23:1111/24/06 21:361,055,144,190-0.0022289681.5E-05310.9720.55 PHYS 167 0-3912/2/06 16:4012/09/06 14:471,013,691,320-0.0024035161.54E-05288.38911.89 PHYS 167 40-7912/09/06 19:0212/16/06 17:00995,311,701-0.0026168341.55E-05264.88025.55 PHYS 167 80-11912/16/06 21:1512/23/06 19:05978,797,865-0.002222341.56E-05311.8900.10 PHYS 167 120-15912/23/06 23:2012/30/06 20:59964,155,029-0.0021818711.58E-05317.685-2.46
=σa=T1/2Significance PHARM /19/06 17:1010/26/06 16:181,125,533, E PHARM /26/06 20:3511/02/06 18:331,107,115, E PHARM /02/06 22:5011/10/06 16:041,087,799, E PHARM /10/06 20:2011/17/06 18:551,070,959, E PHARM /17/06 23:1111/24/06 21:361,055,144, E PHYS /2/06 16:4012/09/06 14:471,013,691, E PHYS /09/06 19:0212/16/06 17:00995,311, E PHYS /16/06 21:1512/23/06 19:05978,797, E PHYS /23/06 23:2012/30/06 20:59964,155, E")
41
Brookhaven National Laboratory—9 September 2008 T 1/2 =1953d T 1/2 =313.5d

42
Brookhaven National Laboratory—9 September 2008 Possible Mechanisms Spatial Variation of the Fine Structure Constant α

43
Brookhaven National Laboratory—9 September 2008 Spatial Variation of the Fine Structure Constant For alpha decay (e.g., 226 Ra 222 Rn + 4 He) From our 226 Ra data, This may be incompatible with existing WEP and 5th force constraints. References: D. J. Shaw, gr-qc/0702090; J.D. Barrow and D. J. Shaw, arXiv:0806:4317; J.-P. Uzan, Rev. Mod. Phys. 75, 403 (2003)
.")
44
Brookhaven National Laboratory—9 September 2008 Possible Mechanisms Spatial variation of the fine structure constant α Spin-dependent long range force coupling to neutrinos

45
Brookhaven National Laboratory—9 September 2008 Spin-dependent long range force coupling to neutrinos Δ

46
Brookhaven National Laboratory—9 September 2008 1.For -decay, where is extremely sensitive to small shifts in E 0 2.Assume E 0 E 0 + , where arises from solar neutrinos, then 3.Next, assume where 4.For an unpolarized sample, Variation in Solar Neutrino Flux

47
Brookhaven National Laboratory—9 September 2008 Variation in Solar Neutrino Flux (cont’d) 5.Compare this to the change induced by This may be compatible with current limits on neutrino magnetic dipole moments.
 5.Compare this to the change induced by This may be compatible with current limits on neutrino magnetic dipole moments.")
48
Brookhaven National Laboratory—9 September 2008

49
Chen, Okutsu, and Longuski Arrival 5/25/2008 Launch 8/3/2007 32 Si 226 Ra

50
Brookhaven National Laboratory—9 September 2008 Chen, Okutsu, and Longuski

51
Brookhaven National Laboratory—9 September 2008 Chen, Okutsu, and Longuski 32 Si 226 Ra

52
Brookhaven National Laboratory—9 September 2008 Potential Missions for Experiment Monitor decay rate on Earth. –Precisely measure variations in decay rates between periapsis and apoapsis. Stable orbit around stable Lagrange points. –May have significant difference between apoapsis and periapsis. Mars Science Laboratory. –Radioisotope power system for generation of electricity from the heat of radioactive decay. Jupiter Polar Orbiter (Juno). –Map Jupiter's gravitational and magnetic fields. Europa Jupiter System Mission. –Likely to have radioisotope thermoelectric generator (RTG) on board. Titan Saturn System Mission. –Likely presence of RTG onboard. Europa Astrobiology Lander. –Likely presence of RTG onboard. Solar Probe Plus –Spacecraft designed to plunge deep into the sun's atmosphere Heliophysical Explorers Solar Orbiters and Sentinels. –Multiple close approaches to the sun.
. –Map Jupiter s gravitational and magnetic fields. Europa Jupiter System Mission. –Likely to have radioisotope thermoelectric generator (RTG) on board. Titan Saturn System Mission. –Likely presence of RTG onboard. Europa Astrobiology Lander. –Likely presence of RTG onboard. Solar Probe Plus –Spacecraft designed to plunge deep into the sun s atmosphere Heliophysical Explorers Solar Orbiters and Sentinels. –Multiple close approaches to the sun..")
53
Brookhaven National Laboratory—9 September 2008 NASA’s Upcoming Missions Mars Science Laboratory Launch: September 2009 Can measure radiation produced by the interaction of space radiation with the Martian atmosphere and surface rocks and soils. Carries radioisotope power system to generate electricity from the heat of plutonium's radioactive decay. Juno Launch: August 2011 Will precisely map Jupiter's gravitational and magnetic fields to assess the distribution of mass in Jupiter's interior, including properties of the planet's structure and dynamics. Chen, Okutsu, and Longuski

54
Brookhaven National Laboratory—9 September 2008 Summary 1.BNL and PTB data indicate an annual modulation of 32 Si and 226 Ra decay rates strongly correlated with 1/R 2 2.Data taken during the 12-Dec 2006 solar flare on 54 Mn also showed a response of the decay rate to solar activity. 3.These data are consistent with a modulation of nuclear decay rates by solar neutrinos and, perhaps, by some other field which modifies the fine structure constant, α, and/or some other fundamental constants. 4.Detailed mechanisms to account for these data can be tested in upcoming NASA Mars missions and the NASA Sentinels mission.

55
Brookhaven National Laboratory—9 September 2008 END

56
Brookhaven National Laboratory—9 September 2008

Similar presentations