Download presentation
Presentation is loading. Please wait.

1
Data for Priority Setting in Small Doses # 3 Service Utilization (CAREWare) Data: Support Services 1
 Data: Support Services 1")
2
CAREWare Data 1/1/2008 to 12/31/2008 Limitations: - Reports are from regional agencies funded withRyan White monies for care and supportive services only - This presentation will talk about who received what support services - Services provided by the agencies listed on the next slide, though funded, are not included in the data 2

3
Agencies Excluded and Reasons for Exclusion Center for Community Resources (CCR) – did not provide any of their RW-funded services Pittsburgh AIDS Center for Treatment (PACT) – used a different version of CAREWare, and their information could not be merged into the regional report East Liberty Family Health Care Center – could not pull export file, so their information was not included in the regional report 3
 – did not provide any of their RW-funded services Pittsburgh AIDS Center for Treatment (PACT) – used a different version of CAREWare, and their information could not be merged into the regional report East Liberty Family Health Care Center – could not pull export file, so their information was not included in the regional report 3")
4
Review: Clients Served in 2008 There are numerous ‘unknown/unreported’ in several categories in the 2008 regional CAREWare reports. The agencies that reported into CAREWare in 2008 served 1638 unduplicated clients. HIV positive – 1125 (68.7%); HIV negative (affected) – 135 (8.2%). New clients in 2008 – 634 (38.9%). 4
; HIV negative (affected) – 135 (8.2%). New clients in 2008 – 634 (38.9%). 4.")
5
Review (continued) AIDS Status of the 1125 HIV positive clients: 486 (43.2%) do not have AIDS; 394 (35%) have CDC defined AIDS; 245 (22%) are of unknown AIDS status. Gender: Female – 514 (31.4%); Male – 1118 (68.7%); Transgender – 6 (0.4%). Age Group: Most clients served fall into age group 45-64 years – 845 (51.6%); followed by age group 25-44 years – 668 (40.8%). 5
; Male – 1118 (68.7%); Transgender – 6 (0.4%). Age Group: Most clients served fall into age group years – 845 (51.6%); followed by age group years – 668 (40.8%). 5.")
6
Review (continued) Race: White – 702 (42.9%); Black – 545 (33.3%); Unknown or unreported race – 348 (21.2%). Ethnicity: Hispanic – 39 (2.4%). Risk Factor: Men who have sex with men (MSM) – 557 (49.5%); Heterosexual contact - 328 (29.2%); Injection drug use – 120 (10.67%). 6
. Risk Factor: Men who have sex with men (MSM) – 557 (49.5%); Heterosexual contact (29.2%); Injection drug use – 120 (10.67%). 6.")
7
Review (continued) Housing: 1118 (68.3%) of clients served in 2008 are permanently housed. Medical Insurance: About one-half of clients served (45%) has public - funded insurance (Medicare, Medicaid, or other public). Trends (2004-2008): - Decrease in number of clients served; - Living arrangements remain the same; - Risk of clients approximately the same; and - Clients tend to fall into the older age group 45-64 over time. 7
 has public - funded insurance (Medicare, Medicaid, or other public). Trends ( ): - Decrease in number of clients served; - Living arrangements remain the same; - Risk of clients approximately the same; and - Clients tend to fall into the older age group over time. 7.")
9
Support Services Provided by PACT in 2008 Emergency Financial Assistance – 222 Clients Medical Transportation – 357 Clients

10
Notes on Support Services in 2008 On the basis of visits per client for the support services provided in 2008: - Psychosocial support is the highest – 10.7 and 8.5 for affected clients - Foodbank/home delivered meals is the next highest at 9.0 &8.2 (affected) - Medical transportation is third at 5.8 visits per client
 - Medical transportation is third at 5.8 visits per client")
11
Key Findings on Need for Support Services from the 2008 Consumer Needs Assessment Percent of 320 No of Respondents Rank out of 14 Services Food Services19.1%612 Transportation16.6%533 Alternative Therapies15.3%494 Legal Services/Client Advocacy12.5%406 Direct Emergency Assistance10.9%357 Rehabilitation4.4%1411 Day and Respite care2.8%913 Adoption/Foster Care1.9%614

12
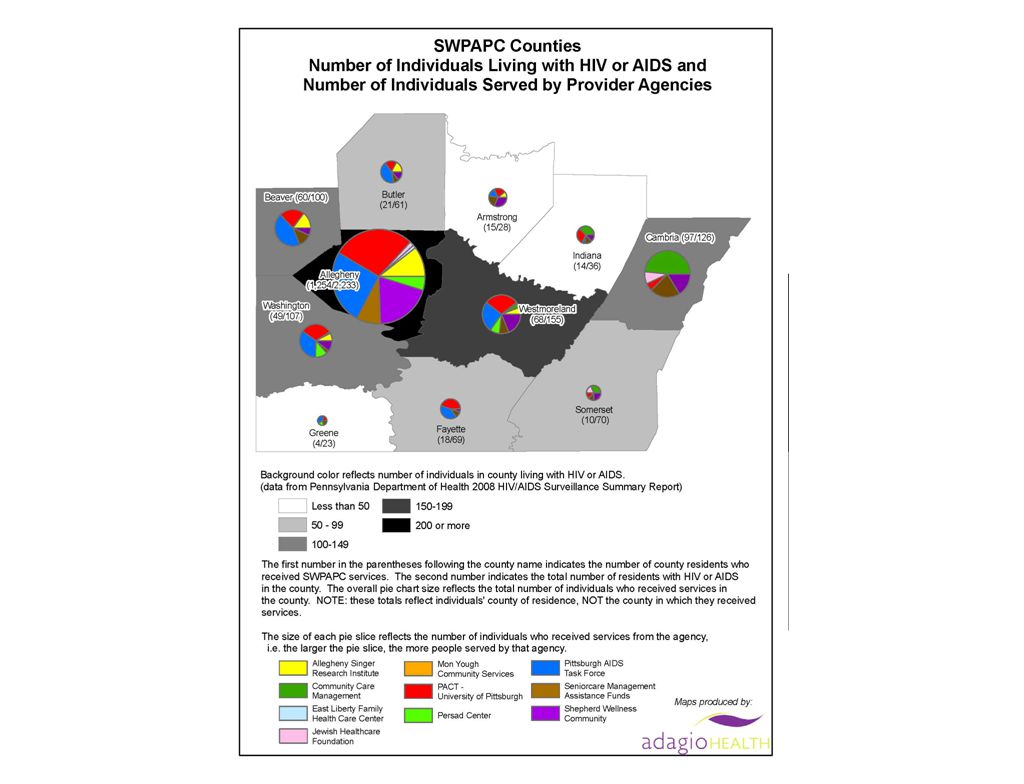
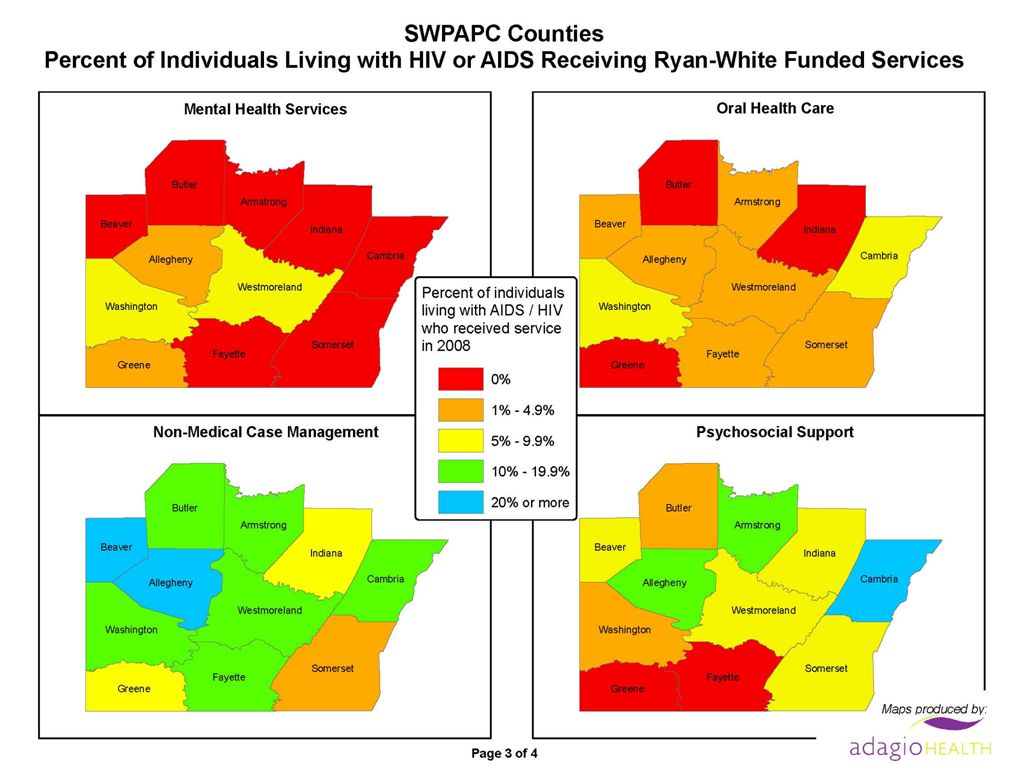
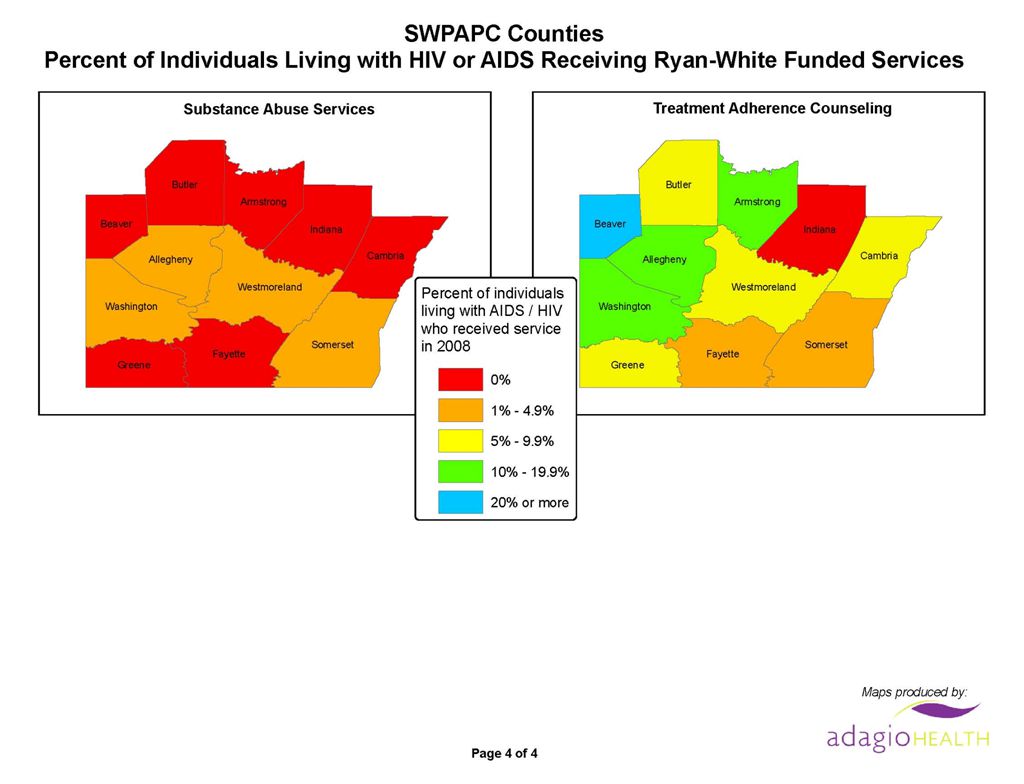
Matching Surveillance and Service Utilization Data Next five maps show coverage of care and support services in our eleven counties. The maps overlay counties that clients served in 2008 reside in, with the living HIV/AIDS in that county. The maps also show percent of living HIV/AIDS cases in each county receiving specific care and support services.

19
Summary This presentation reviewed the demography of the clients served in 2008 who were entered into the CAREWare service utilization data. It presents information on support services received by clients in 2008. Psychosocial support has the highest visits per client, followed by foodbank/home delivered meals and medical transportation.

20
Summary (continued) Findings from the 2008 consumer needs assessment survey ranked (in order) the following services as those needed: Food Services, Transportation, Alternate Therapies; Legal Services/Client Advocacy. Maps matching living HIV/AIDS cases with care and support services received in 2008 crudely measure unmet need for services. The number of HIV+ individuals who received services vary across the region.

21
QUESTIONS, COMMENTS Thank you! 21

22
Presented by: Doyin Desalu, MS, MPH, DrPH Executive Director Southwestern Pennsylvania AIDS Planning Coalition (SWPAPC) 22
 22")
Similar presentations