Download presentation
Presentation is loading. Please wait.

1
GreenSTEM Inspiration

3
Patterning minds through experiences

4
Translating experiences to recorded observations

5
Creating pictures from numbers Eye Color table 1table 2table 3table 4table 5table 6table 7 blue91222 2 brown91111212 green32 1 hazel51 121 red0

6
Pacific Education Institute

7
The NatureMapping Program

8
1. Map the LAND COVER of the dominant ecological systems 2. Map and model SPECIES ranges and distributions 3. Conduct an ANALYSIS to determine the percentage of a species’ distribution that occurs on conservation lands. pre – NatureMapping Program Each State….

9
Land Cover Map

10
EcoRegions

11
Map RANGE and DISTRIBUTION (640 terrestrial species)
")
12
WDFW Education Division UW Cooperative Research Unit The NatureMapping Program

13
WDFW Education Division UW Cooperative Research Unit Margaret Tudor Karen Dvornich

14
Pacific Education Institute UW Cooperative Research Unit Margaret Tudor Karen Dvornich

15
1.Go outside 2.Explore 3. Repeat

16
1.Journal Observations 2.Record Habitat 3. Create a Map Sit Spot

17
2. Record Observations (monitor) 3. Create Pictures from Numbers 1. Ask Essential Questions
 3. Create Pictures from Numbers 1. Ask Essential Questions")
18
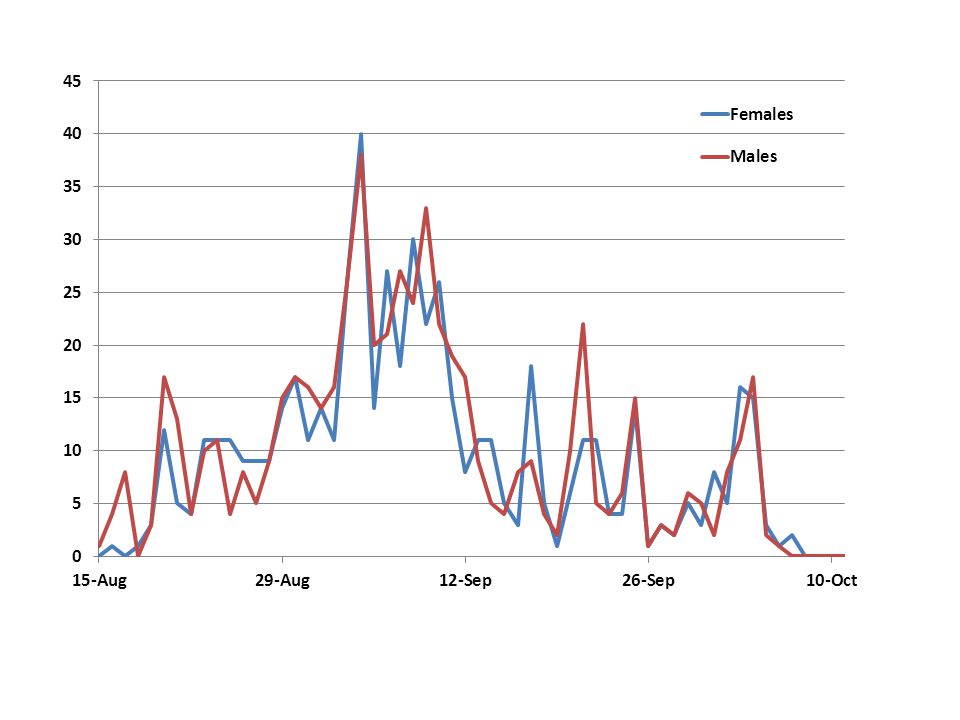
Chum 2008 DateFemalesMalesTotals 8/18101 + State Standards for Science + Incentive to Create Monitoring Experiences

19
Chum Salmon Return to the Union River - 2008 DateFemalesMalesTotals 8/15011 8/16145 8/17088 8/18101 8/19336 8/20121729 8/2151318 8/22448 8/23111021 8/2411 22 8/2511415 8/269817 8/279514 8/289918 8/29141529 8/3017 34 8/31111627 9/114 28 9/2111627 10/5325 10/6112 10/7202 10/8000 10/9000 10/10000 10/11000 10/12347 10/13011 10/14145 10/15101 5525921144 August October

21
Rescue

23
1.Go outside 2.Explore 3. Repeat

Similar presentations


 SWBAT identify the location of major physical features. 2. Question of the Day. (TURN OBJECTIVE INTO A QUESTION) 3. Warm-up (ANSWER)>")


>")


 Shade (Field Marks) Song What is it? Golden-crowned Kinglet.>")

