Download presentation
Presentation is loading. Please wait.

1
Susan Schow, MPH Epidemiologist Maine Health Data Organization March 30, 2010 Heart Failure Readmission Reduction Project & Summit

2
Heart Failure Readmission Reduction Project and Summit MQF- funded project using Chapter 270 data to explore link between: Hospital performance on HF-1 measure, Hospital performance on Care Transitions Measures, and Medicare’s Hospital 30-day Readmission Rates for Heart Failure

3
Heart Failure Readmission Reduction Project and Summit Evaluation of data and visits to selected hospitals to: provide opportunity to better understand the relationship between measures, patient experiences, and long-term outcomes Share data, results of visits, and lessons learned with healthcare community (including hospitals, long term care, and home health) “A rising tide lifts all boats”
 A rising tide lifts all boats")
4
MHDO’s Hospital Quality Data: “Chapter 270” Mandated Reporting Collect quality data measures from hospitals: CMS core measures (AMI, HF, PN, SCIP) (July 2005) Nursing Sensitive Indicators (Jan. 2006) Healthcare Associated Infection data (Jan. 2007) Care Transition Measures (Jan. 2008) Nurse Perceptions of Culture of Safety (Jan. 2009)
 Healthcare Associated Infection data (Jan. 2007) Care Transition Measures (Jan. 2008) Nurse Perceptions of Culture of Safety (Jan. 2009).")
5
Heart Failure 1 - Measure The HF-1 measure focuses on self-care teaching and six areas that need to be addressed prior to discharge: Medications Diet Activity Follow-up Weight monitoring Management of worsening symptoms

6
Care Transition Measures (CTM) CTM (3-question patient survey) measures appropriate transitional care as evaluated from patient perspective CTM is strongly associated with post discharge use of both hospital and emergency services Currently 18 months of CTM data available
 CTM (3-question patient survey) measures appropriate transitional care as evaluated from patient perspective CTM is strongly associated with post discharge use of both hospital and emergency services Currently 18 months of CTM data available")
7
Data Evaluation Evaluation of HF-1 Discharge Instruction measure showed an area for potential improvement Evaluation of CTM data showed variation in patient perception of preparation for transition Identified hospitals with mean scores significantly different than their peer group for both measures

8
Heart Failure Readmission Reduction Project and Summit Recognized opportunity to improve the level of “transitional care” given to patients prior to discharge Dovetails with CMS publishing 30-day Readmission Rates for Heart Failure

9
Hospital Visits by MQF’s QI Nurse Selected nine hospitals for visit (9 of 36 acute care hospitals = 25%) Ensured equal representation by peer grouping and by district Dual goals: Identifying best practices by asking top performers to share process improvement strategies at summit Identifying opportunities for improvement through on–site process review meetings with heart failure teams
 Ensured equal representation by peer grouping and by district Dual goals: Identifying best practices by asking top performers to share process improvement strategies at summit Identifying opportunities for improvement through on–site process review meetings with heart failure teams")
10
Readmissions 20% of Medicare Beneficiaries readmit within 30 days of discharge 33% readmit within 90 days; 56% within year Readmissions have a 0.6 day longer LOS than other patients in the same DRG Medical causes dominate readmissions Estimated cost to Medicare: $15 to $18.3 billion in annual spending Sources: 1 Jencks, S., Williams, M., & Coleman, E. (2008). “Rehospitalizations among Patients in the Medicare Fee-for-Service Program,” NEJM, Volume 360:1418-1428, April 2, 2009, Number 14. 2 Medpac (June 2007). "Report to the Congress: Promoting Greater Efficiency in Medicare,“ pp 103-120.
. Rehospitalizations among Patients in the Medicare Fee-for-Service Program, NEJM, Volume 360: , April 2, 2009, Number Medpac (June 2007). Report to the Congress: Promoting Greater Efficiency in Medicare, pp")
11
Highest Rates and Most Frequent Reasons for Rehospitalization Condition at Index Discharge 30-Day Rehospitalization Rate Proportion of All Rehospitalizations Medical All21.0%77.6% Heart failure26.9%7.6% Pneumonia20.1%6.3% COPD22.6%4.0% Psychoses24.6%3.5% Surgical All15.6%22.4% Cardiac stent placement14.5%1.6% Major hip or knee surgery9.9%1.5% Other vascular surgery23.9%1.4% Major bowel surgery16.6%1.0% 1 Jencks et al, NEJM 360;14 April, 2009

13
Key Area for Improvement 50% of all patients re-hospitalized within 30 days of medical discharge had no bill by a physician between discharge and rehospitalization 52% of CHF patients had no bill by a physician between discharge and rehospitalization Potential implications: Seeing a physician post discharges may have a protective effect on readmitting to the hospital. Critical window within the 30-day period

15
CMS Plans Process: Provide risk-adjusted readmission rates confidentially to hospitals Followed by publicly report readmissions rates Followed by payment reform (reduce payments) Medicaid is likely to consider similar approaches Other payers will follow State public reporting is moving forward in many states: Public reporting will be helpful to hospitals in addressing performance improvement Source: Medpac (June 2007). "Report to the Congress: Promoting Greater Efficiency in Medicare.“ p. 105.

16
Transitional Care Set of actions to ensure coordination and continuity of care as patients transfer between locations or levels of care Patients vulnerable: Functional loss, pain, anxiety or delirium Unprepared for what will transpire and their roles in process (caregivers also unprepared)
")
17
Literature “Comprehensive Discharge Planning With Post Discharge Support for Older Patients with CHF” Evaluated effects on CHF readmission rates (meta analysis: 18 studies, 8 countries) Found 25% relative reduction in risk of readmission A trend towards 13% relative reduction in all cause mortality Improvement in Quality of Life scores (in a smaller subset of studies) Without increase to cost of medical care Specific to CHF patients, >=55 years old, moderate to severe symptoms and LV systolic dysfunction 1 Phillips C,.et al, JAMA, 2004
 Found 25% relative reduction in risk of readmission A trend towards 13% relative reduction in all cause mortality Improvement in Quality of Life scores (in a smaller subset of studies) Without increase to cost of medical care Specific to CHF patients, >=55 years old, moderate to severe symptoms and LV systolic dysfunction 1 Phillips C,.et al, JAMA, 2004")
18
Responsible for Care Beyond Your Care Setting Ensure safe and effective transfers to the receiving care setting mandated per standards by: Joint Commission for Accreditation of Healthcare Organizations DHHS Conditions for Participation Gaps in performance measurement identified by Institute of Medicine to assess quality across multiple care settings Patient and Caregiver are often the only common thread weaving across settings Uniquely positioned to report on quality of care transition

19
Development of Care Transition Measures Survey Focus groups = four domains identified 1.Info Transfer Confusion over appropriate Rx regimen 2.Patient and Caregiver Preparation No understanding of what takes place in next care setting and their role Care plans developed requiring caregivers participation without conferring with caregivers 3.Support for Self-Management Inability to access practitioners with knowledge of recent care impedes patients’ ability to manage own care

20
Development of Care Transition Measures Survey Focus groups = four domains (continued) 4.Empowerment to Assert Preferences Patients attempt to assume more active role in care or to assert preferences repeatedly discouraged by practitioners or institutions CTM Development Rigorous psychometric testing Validated for poorer outcome patients (underserved, sicker and older populations) Aligns with the tenets of patient-centered care Items “actionable” to help guide quality improvement Scores responsive to changes in care process
 4.Empowerment to Assert Preferences Patients attempt to assume more active role in care or to assert preferences repeatedly discouraged by practitioners or institutions CTM Development Rigorous psychometric testing Validated for poorer outcome patients (underserved, sicker and older populations) Aligns with the tenets of patient-centered care Items actionable to help guide quality improvement Scores responsive to changes in care process")
21
Care Transition Measures NQF endorsed 3-question survey of patients conducted 48 hrs to 6 weeks post discharge Q1 - “The hospital staff took my preference and those of my family or caregiver into account in deciding what my health care needs would be when I left the hospital” Q2 - “When I left the hospital, I had a good understanding of the things I was responsible for in managing my health” Q3 - “When I left the hospital, I clearly understood the purpose for taking each of my medications”

22
CTM: Uses Likert 4-Point Scale Responses to questions: “Strongly Disagree” = “1” “Disagree” = “2” “Agree” = “3” “Strongly Agree” = “4” “Don't Know” / “Don't Remember” / “Not Applicable” = “99” Left answer blank = “9”

23
CTM Score Associated with Post Discharge Use of Hospital and ED Shown to discriminate between patients who did and did not have subsequent ED visit/ rehospitalization for index condition Q2 - “When I left the hospital, I had a good understanding of the things I was responsible for in managing my health” Significantly associated with subsequent emergency visits Of those who agreed, 15.5% had ED visit Of those who disagreed, 38.5% had ED visit 1 Coleman, E., et al, Medical Care, March 2005

24
CTM Score Associated with Post Discharge Use of Hospital and ED Studied specifically for diabetes and CHF patients following discharge because: High likelihood of requiring follow-up care High likelihood of requiring medication adjustment as result of hospitalization Need for ongoing self-management Correlation between CTM scores and subsequent use of ED Predictive of return to ED within 30 days p = 0.004 (hint: p-value scores <0.05 are significant ) 1 Coleman, et al, Home Health Care Services Quarterly, Vol. 26, No. 4, 2007

25
HCAHPS ® - Similar But Different Hospital Consumer Assessment of Health Plan Survey (HCAHPS ® ) primarily addresses patient satisfaction CMS developed with the Agency for Healthcare Research and Quality (AHRQ) Since 2007, Inpatient Prospective Payment System (IPPS) hospitals must submit HCAHPS to receive full annual payment (reduced by 2% for non-reporting). Critical Access Hospitals may voluntarily report

26
HCAHPS ® - Similar But Different The two HCAHPS discharge questions are typically summed up under the category of : “Were patients given information about what to do during their recovery at home?” Discharge related questions: Q19: During your hospital stay, did hospital staff talk with you about whether you would have the help you needed when you left the hospital? Yes, No Studies say having opportunity to speak with doctors/nurses not rated as important as opportunity to actively prepare for care in next setting and role in self- care.

27
HCAHPS - Similar But Different Discharge related question: Q20: During your hospital stay, did you get information in writing about what symptoms or health problems to look out for after you left the hospital? Yes, No Studies identify patient’s frustrations centered more on identifying whom to contact for symptoms rather than knowing the symptoms Understanding medication instructions is not assessed by HCAHPS Not known whether HCHAPS items predict recidivism (CTM does) 1 Parry, C, et al, Medical Care, March 2008
 1 Parry, C, et al, Medical Care, March")
28
CTM-3: Sufficient Number of Surveys CTM sampling patterned after the HCAHPS survey: CMS requires at least 300 completed HCAHPS surveys over four quarters: “necessary to ensure adequate statistical power to compare hospitals to one another and to national benchmarks” For those not collecting 300 completed surveys, CMS notes that: Results are based on between 100 and 299 completed surveys or Results are based on less than 100 completed surveys 1 From: Mode and Patient-mix Adjustment of the CAHPS® Hospital Survey (HCAHPS) April 2008
 April 2008")
29
The 5 “Stages of Data” Where Is Your Facility? Denial “Those aren’t MY numbers” Anger / Resentment “Who got those numbers?” Bargaining “How about if we re-run it again??…” Depression (?!!) “Why are we even doing this?…” Acceptance “How can we get better?” “Stages of Grief” – E. Kubler-Ross – adapted by M. Albaum MD
 Why are we even doing this … Acceptance How can we get better Stages of Grief – E. Kubler-Ross – adapted by M. Albaum MD.")
30
Parametric and Nonparametric Data Analysis HF-1 data is interval (continuous) data Intervals between any two adjacent values on a measurement scale are same Use parametric statistics (mean, std. deviation, etc.) CTM data is ordinal (categorical) data Values represent a rank ordering of observations rather than precise measurements (e.g., CTM data scores of 1=strongly disagree, 2=disagree, 3=agree, 4=strongly agree) You can count and order ordinal data, but you cannot perform mathematics on it Use non-parametric statistics
 CTM data is ordinal (categorical) data Values represent a rank ordering of observations rather than precise measurements (e.g., CTM data scores of 1=strongly disagree, 2=disagree, 3=agree, 4=strongly agree) You can count and order ordinal data, but you cannot perform mathematics on it Use non-parametric statistics.")
31
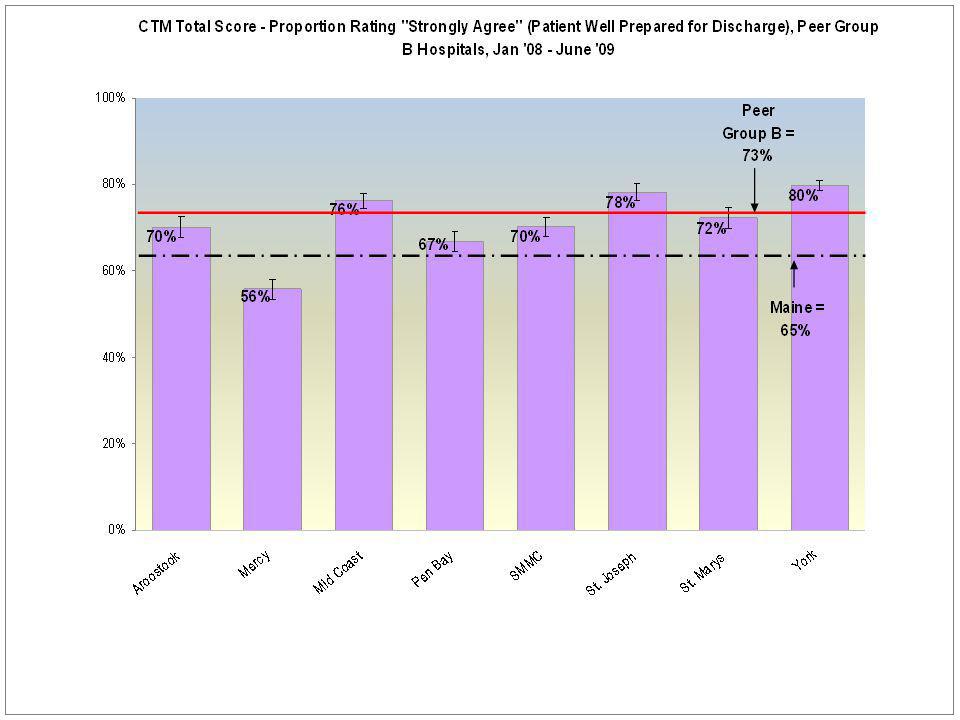
CTM Data Non-parametric Statistical Analysis Used binomial distribution comparing proportion of patients answering with score = 4 to the proportion answering anything else (scores = 1, 2, 3) So compared proportion answering “strongly agreed” to those answering anything else (i.e., “agree,” “disagreed,” “strongly disagreed”) Maine is an overachiever (as usual)
 So compared proportion answering strongly agreed to those answering anything else (i.e., agree, disagreed, strongly disagreed ) Maine is an overachiever (as usual)")
32
CTM Data Non-parametric Statistical Analysis Using binomial distribution (for non- parametric data) Calculated proportion ( “strongly agreed”) and upper and lower confidence intervals for: Each hospital; Each peer group of hospitals, and Maine statewide For each CTM question (1, 2, 3) and for Total CTM score
 Calculated proportion ( strongly agreed ) and upper and lower confidence intervals for: Each hospital; Each peer group of hospitals, and Maine statewide For each CTM question (1, 2, 3) and for Total CTM score")
33
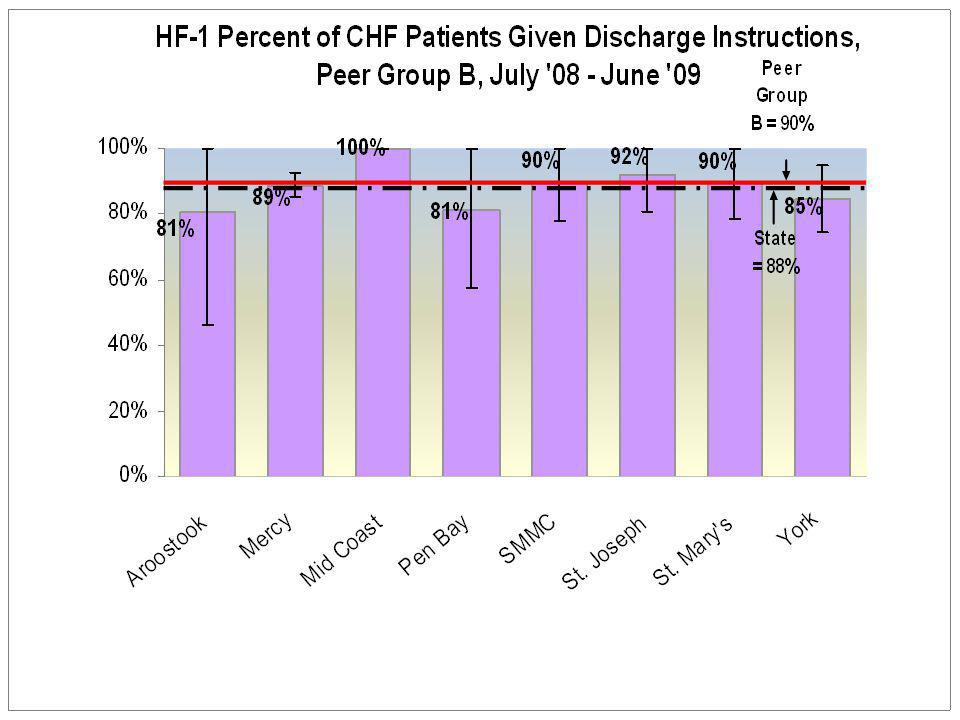
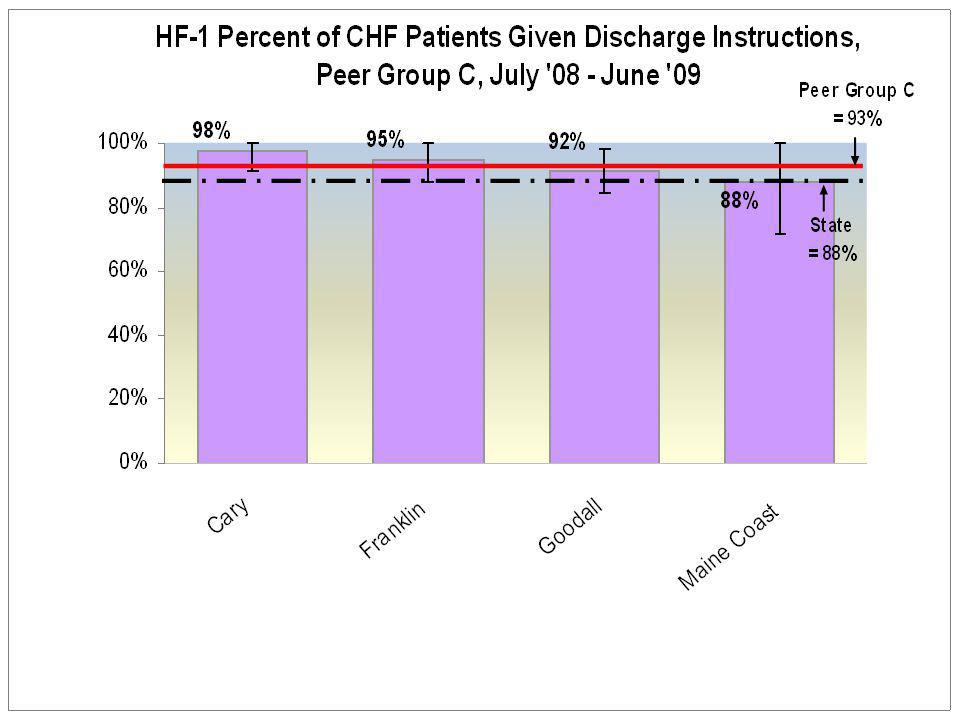
Hospital Data: Evaluated by Hospital Peer Groupings Peer Group A 250–606 beds (MMC, EMMC, CMMC, MGMC) Peer Group B 79–233 beds (Aroostook, Mercy, Mid Coast, Pen Bay, SMMC, St Joseph, St Mary, York) Peer Group C 53-70 beds (Cary, Franklin, Goodall, ME Coast) Peer Group D 38-55 beds (Inland, Miles, NMMC, Parkview, Stephens)
 Peer Group B 79–233 beds (Aroostook, Mercy, Mid Coast, Pen Bay, SMMC, St Joseph, St Mary, York) Peer Group C beds (Cary, Franklin, Goodall, ME Coast) Peer Group D beds (Inland, Miles, NMMC, Parkview, Stephens)")
34
Hospital Peer Groupings - Continued Peer Group E = Critical Access Hospitals 25 beds or less (Blue Hill, Bridgton, CA Dean, Calais, Down East, Houlton, Mayo, Millinocket, MDI, Pen Valley, Red-Fairview, Rumford, Sebasticook, St Andrews, Waldo ) Peer Group F = Psychiatric Hospitals Acadia, Dorothea Dix, Riverview, Spring Harbor Peer Group H = Rehabilitation Hospitals New England Rehabilitation
 Peer Group F = Psychiatric Hospitals Acadia, Dorothea Dix, Riverview, Spring Harbor Peer Group H = Rehabilitation Hospitals New England Rehabilitation")
41
CTM Correlation With Readmissions Performed correlation analysis using Pearson correlation coefficient - a measure of the extent to which two variables “vary together.” The value of any correlation coefficient must be between -1 and +1. Used CTM Total score probability from each hospital Compared to CMS 30-day Risk-adjusted Readmission Rate for Heart Failure from Hospital Compare website

42
CTM Correlation With Readmissions Best correlation coefficient R = 0.00347 (for CTM Question 1) CTM Correlation (R) Q1 = 0.00347 Q2 = 0.00196 Q3 = -0.01469 Total CTM = -0.00230
 CTM Correlation (R) Q1 = Q2 = Q3 = Total CTM =")
43
Evaluate Correlation Coefficient (Cohen, 1988) CorrelationR Small0.1 to 0.3 Medium0.3 to 0.5 Large0.5 to 1.0 R = 0.003No Correlation
 CorrelationR Small0.1 to 0.3 Medium0.3 to 0.5 Large0.5 to 1.0 R = 0.003No Correlation")
44
Why No Correlation Seen Dates for data sets not comparable: CTM = January 2008 to July 2009 Readmission Rates = July 2005 to June 2008 Literature indicates CTM predictive of risk/performance at the level of the patient, but not at level of the hospital? If able to identify specific patient CTM survey results and track patient readmission status “Gold standard”

46
CHF Burden: Nursing Facilities, Residential Care Facilities, and Home Care Medicaid Policy Cooperative Agreement Project – “Congestive Heart Failure Prevalence in Maine Long Term Care” Prepared by Catherine McGuire, Cutler Institute and Muskie School of Public Service

47
Nursing Home Admissions For State Fiscal Year 2009, there were 16,073 admissions to nursing homes. The majority of admissions (88%) are from hospitals CHF was indicated on 23% admissions CHF prevalence was consistent for admissions from: hospitals, other nursing homes, and other sources Admissions from home and assisted living/ residential care were less likely to have a CHF diagnosis
 are from hospitals CHF was indicated on 23% admissions CHF prevalence was consistent for admissions from: hospitals, other nursing homes, and other sources Admissions from home and assisted living/ residential care were less likely to have a CHF diagnosis.")
48
CHF Prevalence in Maine Nursing Facility Admissions by Source, SFY2009

49
Nursing Home Discharges In SYF 2009, there were 17,947 discharges; 24% had a CHF diagnosis The majority of discharges from nursing facilities are to home (52%) Residents discharged to hospital or deceased were more likely to have a CHF diagnosis: Thirty percent of residents who died had a CHF diagnosis Only 20% discharged home and 15% discharged to some other destination had CHF
 Residents discharged to hospital or deceased were more likely to have a CHF diagnosis: Thirty percent of residents who died had a CHF diagnosis Only 20% discharged home and 15% discharged to some other destination had CHF")
50
CHF Prevalence in Maine Nursing Facility Discharges by Destination, SFY 2009

51
Residential Care Admissions During SFY 2009, there were 1,891 admissions to residential care facilities CHF was indicated on 15% admissions The majority of admissions (38%) are from home CHF prevalence: Higher for admissions from the hospital and nursing homes (just over 20%) Lower for admissions from home
 are from home CHF prevalence: Higher for admissions from the hospital and nursing homes (just over 20%) Lower for admissions from home")
52
CHF Prevalence in Maine Residential Care Facility Admissions by Source, SFY 2009

53
Residential Care Discharges The majority of discharges (45%) from residential care facilities are to nursing facilities In SYF 2009, there were 2,078 discharges, 17% had a CHF diagnosis Residents who died were more likely to have a CHF diagnosis (26%): 17% discharged to the hospital had a CHF diagnosis Only 9% discharged home and 12% discharged to some other destination had a CHF diagnosis
 from residential care facilities are to nursing facilities In SYF 2009, there were 2,078 discharges, 17% had a CHF diagnosis Residents who died were more likely to have a CHF diagnosis (26%): 17% discharged to the hospital had a CHF diagnosis Only 9% discharged home and 12% discharged to some other destination had a CHF diagnosis")
54
CHF Prevalence in Maine Residential Care Facility Discharge by Source, SFY 2009

55
Adults in the Community / Home Health SFY 2009, 13% of the 5,738 home health consumers assessed had CHF Wide variation was observed by program a high of 23% for Private Duty Nursing Level II a low of 0% in the physically disabled waiver program (serves a younger population of consumers with disabilities )
")
56
“Proportion of Residents in All Facilities in the County on the 1st Thursday in April Who Have Congestive Heart Failure, Shaping Long-Term Care in America Project, National Institute on Aging, LTCFocUS.org, Counties 2007% CHF (prevalence) Androscoggin18% Aroostook30% Cumberland23% Franklin19% Hancock29% Kennebec22% Knox24% Lincoln24% Oxford14% Penobscot24% Piscataquis25% Sagadahoc*12%* Somerset28% Waldo17% Washington*31%* York18%
 Androscoggin18% Aroostook30% Cumberland23% Franklin19% Hancock29% Kennebec22% Knox24% Lincoln24% Oxford14% Penobscot24% Piscataquis25% Sagadahoc*12%* Somerset28% Waldo17% Washington*31%* York18%")
58
CMS Heart Failure – 1 Discharge Instructions Heart failure patients discharged home with written instructions or educational material given to patient or caregiver at discharge or during the hospital stay addressing all of the following: activity level diet discharge medications follow-up appointment weight monitoring, and what to do if symptoms worsen

59
CMS Heart Failure – 1 Discharge Instructions Rationale: Non-compliance with diet/medications important reason for changes in clinical status National guidelines strongly support the role of patient education But despite this recommendation, comprehensive discharge instructions rarely provided to eligible older patients hospitalized with heart failure (per CMS National Heart Failure Project baseline data)
")
71
HF-1 Correlation with Readmission? Also performed correlation analysis using Pearson correlation coefficient Used HF-1 Rates from each hospital Compared to CMS 30-day Risk-adjusted Readmission Rate for Heart Failure from Hospital Compare website R = 0.04 - No Correlation (hint: small correlation = 0.1 to 0.3) Again dates not comparable: HF-1 = June 2008 to July 2009 Readmission Rates = July 2005 to June 2008 If able to identify specific HF-1 patients and track for readmission status “Gold standard”
 Again dates not comparable: HF-1 = June 2008 to July 2009 Readmission Rates = July 2005 to June 2008 If able to identify specific HF-1 patients and track for readmission status Gold standard .")
72
Literature “Public Reporting of Discharge Planning and Rates of Readmissions” also found no association between HF-1 and readmission rates Only modest association between readmission rates and HCAHPS (discharge-related questions Q19 & Q20) No association between performance on 2 discharge measures HF-1 specific to CHF patients / HCAHPS measures all patients Therefore, even if improve HF-1 rates, may not see effect in HCAHPS (or CTM) Concludes readmission rates will not be reduced by improvement/public reporting on discharge planning measures Suggests changes must occur in the ambulatory care setting 1 Ashish K. et al, NEJM, 2009

Similar presentations


 Changes Iowa Medicaid Enterprise October 14, 2008.>")


>")

