Download presentation
Presentation is loading. Please wait.

1
NORMAL DISTRIBUTION & Z-SCORES MICHELLE BROOKS SECTION 1 MATH 11

2
IS YOUR DATA NORMALLY DISTRIBUTED? No I don’t think my data is evenly distributed because most of my data is close together and there isn’t a good variation in numbers, nor does it form a bell curve when plotted on a graph.

4
Z-SCORES My z-score: 11-7.2/2.7= 1.41=.9207 on the z-score chart I have more tables than: 92.07 % I have less tables than: 7.93% Largest: 3-7.2/2.7= -1.52= 0.0643 on the z-score chart = 6.43% Smallest: 13-7.2/2.7= 2.15= 0.9842 on the z-score chart = 98.42%

6
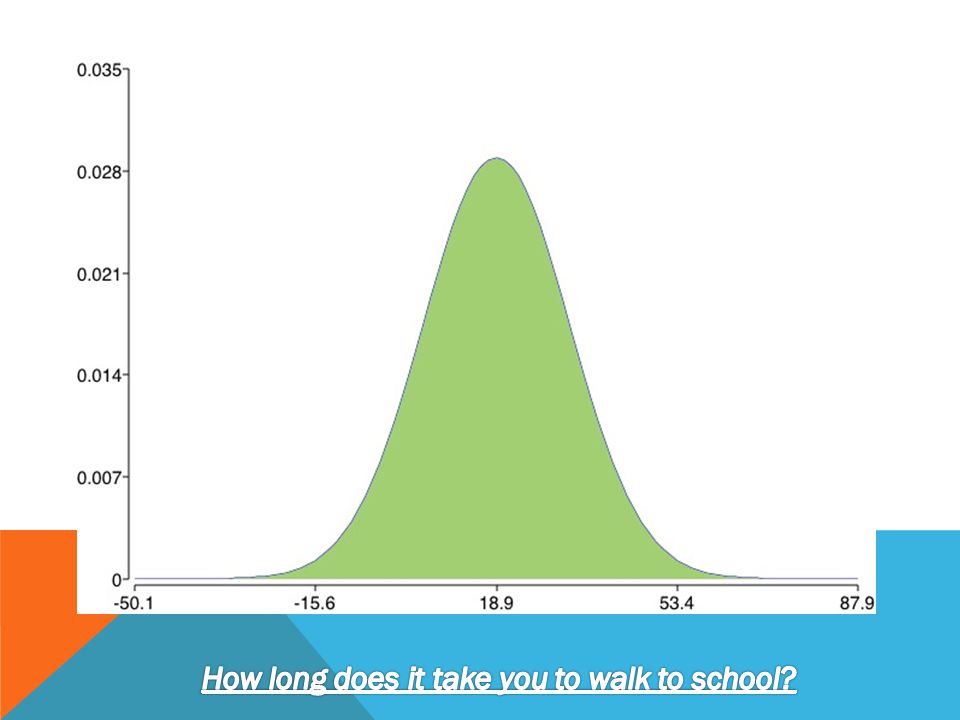
Z-SCORES My z-score: 35-18.9/13.8= 1.17=.8790 on the z-score chart I take more time to walk to school than: 87.9% I take less time to walk to school than: 12.1% Largest: 55-18.9/13.8= 2.62=.9956 on the z-score chart = 99.56% Smallest: 5-18.9/13.8= -1.01=.1562 on the z-score chart = 15.62%

Similar presentations