Download presentation
Presentation is loading. Please wait.

1
ECNS 594 Current Issues in Economics June 20, 2013 Bozeman, Montana

2
3 Intrinsic Goals 1. Improve health (value for $ spent): Positive 2. Improve responsiveness: Positive 3. Ensure financial burdens are distributed fairly: Normative Affordability AccessQuality

3
But levels of health not solely determined by health “systems” Education Income Housing Food quality

4
Health Care: Merit Good?

5
Evolution of Health Systems post WWII Europe and Japan rebuilt from scratch Developed national health systems U.S. chose subsidies for its health care system Hospitals: Hill Burton Act Physicians: NHSC Employers: tax preference treatment for benefits Elderly and low income disabled: Medicare Financially indigent: Medicaid, Community Health Centers

6
How does the U.S. health system rank? http://www.oecd.org

7
AustraliaCanadaGermanyNew Zealand UKUS Rank3.552 16 Quality462.5 15 Access351246 Efficiency453216 Equity254316 Healthy Lives 1324.5 6 Per Cap Spending $2,876$3,165$3,005$2,083$2,546$6,102 Commonwealth Fund Comparative Ranking

8
International Comparison of Spending on Health total expenditures per capita, U.S. $ PPP Source: OECD Health Data 2009 (June 2009).
..")
9
Total expenditures on health as a percent of GDP

10
U.S. Health Care We are the biggest spender Per capita As a share of GDP High expenditures may have 3 meanings: High average level of use? (large income elasticity) High resource costs? (supplier induced demand) Inefficient provision of services (fee for service)
 High resource costs. (supplier induced demand) Inefficient provision of services (fee for service).")
11
General observations about health care spending… Income groupSpending on health/GDP Gov. health spending/total health spending Gov. health spending/total Gov. Spending Low income4.336.25.9 Lower middle income 4.543.28.2 Upper middle income 6.355.19.8 High income11.260.717.1 Global8.757.614.3

12
Choice is important… “Our founders thought politicians should be accountable when it comes to citizens’ right to life, liberty and the pursuit of heart surgery” Gottlieb, American Enterprise Institute

13
Any System Must Ration Any and all systems, for all kinds of goods and services, must ration resources someway, somehow, according to… price time in queue budgets geography (access) specialty, type of service Each has unintended consequences
 specialty, type of service Each has unintended consequences")
14
Unintended consequences are seldom good…. …If a federal program was established to give financial assistance to Boy Scouts to enable them to help old ladies cross busy intersections, we could be sure that: not all the money would go to Boy Scouts, that some of those they helped would be neither old nor ladies, that part of the program would be devoted to preventing old ladies from crossing busy intersections, and that many of them would be killed because they would now cross at places where, unsupervised, they were at least permitted to cross.” (Ronald Coase)
.")
15
We often compare our system to others Canada France Germany United Kingdom

16
So Who Has the Best System? Source: Schoen November 2005 ()= Pew Research Center, June 2009 Overall System View (%) Minor change needed Fundamental change needed Completely rebuild system Australia234826 Canada216117 New Zealand275220 U. K.305214 U.S.23 (24)44 (30)30 (41) Germany165431
= Pew Research Center, June 2009 Overall System View (%) Minor change needed Fundamental change needed Completely rebuild system Australia Canada New Zealand U. K U.S.23 (24)44 (30)30 (41) Germany")
17
How Valid are Comparisons? No standard taxonomy Purchasing power parities errors Income/prices/taxes Quality comparisons

18
What Are Some of the Safer Conclusions? Availability of medical resources does not explain high health care costs in the U.S. (or does it?) Japan and Italy have more MRI and CT Scanners per million population Spend more on medical care in absolute terms ($5,635 per capita) and in relative terms (15% GDP) High income elasticity of demand (income is U.S. 20% higher than average, hence, supports more spending on medical care)
 Japan and Italy have more MRI and CT Scanners per million population Spend more on medical care in absolute terms ($5,635 per capita) and in relative terms (15% GDP) High income elasticity of demand (income is U.S. 20% higher than average, hence, supports more spending on medical care).")
19
Some of the Safer Conclusions, continued… Lifestyle choices of U.S. citizens (obesity) Shorter waiting times (we pay for convenience) 18% of U.S. population has no insurance Would more government and universal access improve the U.S. situation?
 Shorter waiting times (we pay for convenience) 18% of U.S. population has no insurance Would more government and universal access improve the U.S. situation .")
20
Questions to Ask with Each Reform? Does the plan achieve universal coverage? How is the plan financed, will it add to the federal deficit and national debt? Will it contain costs without sacrificing quality? Will it slow cost growth? How will it affect overall employment? Freedom of choice?

21
Elasticity has to do with the ability to stretch your demand or supply when price changes…

22
Recall in ELM 9 and 11 the concept of a “change in the quantity demanded…?” A 10% increase in the price of _______ results in a decrease in the quantity demanded of _______% physician price Good health3.5% Poor health1.6% hospital price 1.4% nursing home price 6.9% to 7.6%

23
Demand, Elasticity and Opportunity Cost

24
Remember in your ELM’s the concept of a “change in demand?” a 10% increase in income results in a _____% increase in the demand for ______. 0.2% to 0.4%hospital services 24% to 32%dental services 2.0% to 5.7%physician services 6.0% to 9.0%nursing homes

25
And the supply response is important too

26
Does the law of demand apply to health care? Coinsurance %# visits/yearTotal spending on outpatient care Probability of use Free4.6$34087% 25%3.3$26079% 50%3.0$22477%

27
What happens to resource use when its virtually “free?” Percent Waiting AustraliaCanadaNew Zealand UKUS % waiting >week to see specialist 4657406023

28
So is “price” the perfect way to ration use? PercentAustraliaCanadaNew ZealandUKUS Did not fill Rx 222019840 Did not visit MD when sick 18729434 Did not get rec. test 201221533 > $1,000 out of pocket 14 8434

29
The dilemma worldwide then is providing… Accessibility Geographically Wait time (time is not free) Affordability Quality Personnel Equipment (technology)
 Affordability Quality Personnel Equipment (technology)")
30
Health Care System Typology Sickness Insurance (Germany) Private insurance market with state subsidy National Health Insurance (Canada) National level health insurance system National Health Services (United Kingdom) State provides health care Mixed System (U.S.) Sickness insurance and national health coverage)
 Private insurance market with state subsidy National Health Insurance (Canada) National level health insurance system National Health Services (United Kingdom) State provides health care Mixed System (U.S.) Sickness insurance and national health coverage)")
31
Overview of Health System Types National Health Service Great Britain, Sweden, Norway, Finland, Spain, Italy, Greece National Health Insurance Japan, France, Russia, Canada, Australia Mixed U.S., China (post reform efforts)
")
32
National Health Service Universal coverage-Single Payer Financing via general revenues, income taxes District budgets control spending Patients seen in public hospitals and clinics Physicians work for NHS Private practices often allowed

33
National Health Insurance Universal coverage via employer and employee mandates May be both single and multiple payers Financing via employment taxes, Social Security Public and private hospitals exist France: 87% have supplemental insurance

34
Mixed No universal coverage Multiple payers No individual or employer mandates Financing via individual, government, private insurance Hodge-podge of providers and payers

35
The UK Experience All British citizens have access to universal health care Financing: payroll taxes, general fund, fees 10% Britons buy private health insurance Chief benefit is reduced wait time for elective surgery Not all services are free (dental, Rx) GP is gatekeeper Good access to emergency and primary care For specialty care: rationed via wait lists and limits to technology
 GP is gatekeeper Good access to emergency and primary care For specialty care: rationed via wait lists and limits to technology")
36
Canadian Experience 13 different provincial healthcare systems Quebec is unique: administers its own system for physician licensing Hospitals: owned by provincial governments, private not for profits, and some by federal government Financing for Medicare: provincial and federal taxes Hospitals on global budgets regardless of ownership Wait times are big although only 20% Canadians consider it a problem

37
The German Experience World’s oldest social health insurance Universal coverage: 88% have social insurance, 10% private insurance Financing: almost entirely via labor market (employer-employee) Hospitals are private, not for profit and state/federal/local owned Privately insured: shorter wait times, more elective surgery, more likely to see specialists
 Hospitals are private, not for profit and state/federal/local owned Privately insured: shorter wait times, more elective surgery, more likely to see specialists")
38
All Non US Systems have… Individual and/or employer mandates Universal coverage Less expensive Better outcomes?

39
Can health care be “too” universal? Recent case of Spain as point of “health tourism” Northern Europeans relocate to Mediterranean area in Spain for medical care Spain recovers only fraction of cost from EU health fund ($10 million of $67 million)
.")
40
U.S. System No central governing Little coordination and integration Hodge-podge of public and private financing Technology Driven Lack of central control credited with innovation, diffusion, utilization Technology as bellwether indicator of quality Dartmouth Studies Uninsured use safety nets: CHC, ER, Outpatient Dept. Delivery in imperfect market: consumer knows little of cost Asymmetry of info between principals-agents

41
So Who Has It Right? France & Japan & Netherlands Rapidly increasing costs Benefit reductions Germany Increased payroll tax to meet spiraling costs England 2006 report “the present system is incomprehensible and its outcomes unjust”

42
The “health” of health systems Ultimately depends on… Public values which are culturally dependent UK: right to free care as citizens Canada: “just, fair, and equitable principal” Germany: solidarity and subsidiarity U.S.: self reliance, aversion to taxation, limited role for government

43
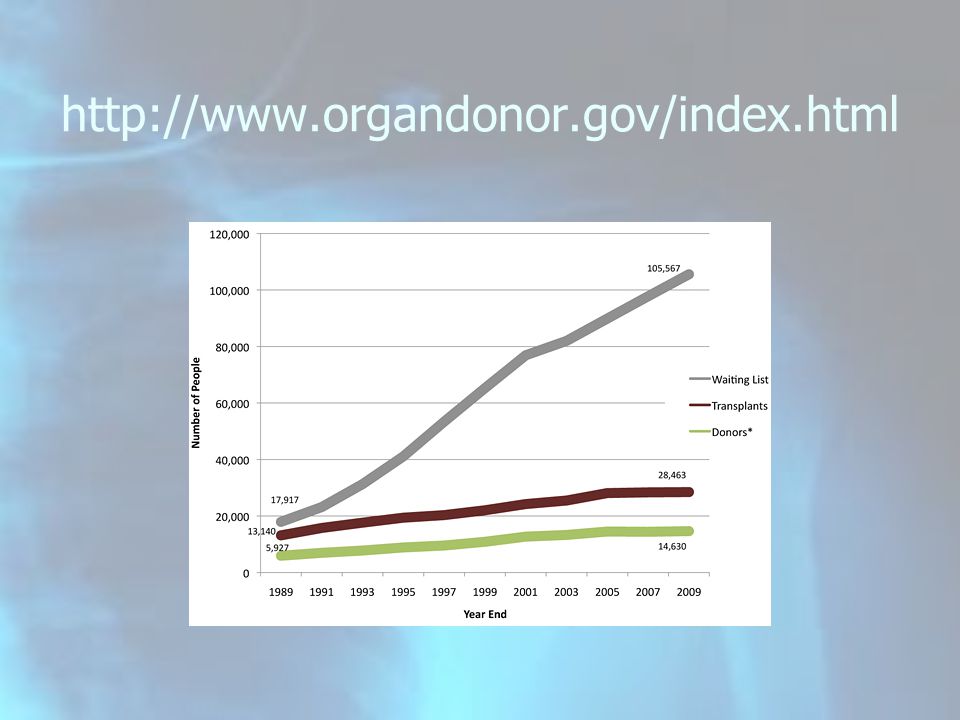
Human organs are scarce

44
http://www.organdonor.gov/index.html
45
“Commercialize” human organs? Assisted-suicide pioneer Jack Kevorkian temporarily commercialize organ harvesting and auctioning off body parts online to pay donors and provide an expense fund for poor recipients.

46
Is the same thing as saying scarce resources have alternative uses Saying economic choices have an opportunity cost…

47
TANSTAAFL

48
Can’t have it all…

49
Salient Features Requiring Special Attention #1 Uncertainty Irregular demand Inelastic demand Provider responses

50
Salient Feature # 2 Third Party Payers Deductibles, co-pays-co-insurance Fee for service reimbursement Dartmouth Studies Moral hazard of insurance Even with red light cameras!

51
Salient Feature #3 Information Asymmetry Adverse selection in health insurance (individual mandate) Quality chasm: providers provide both info and service
 Quality chasm: providers provide both info and service")
52
Salient Feature #4 Role of not-for-profits Usually assume firms maximize profits

53
Salient Feature #5 Monopoly, Oligopoly, Monopsonistic Competition Licensure Direct to consumer advertising Regulation Patent protection Anti-trust

54
Salient Feature #6 Concerns for Equity, Need for Health Care Is health care a merit good? All health care?

55
Salient Feature #7 Government As direct provider (VA, CHC, IHS, State and County hospitals, nursing homes, etc.) As financier of health care Who really pays, really?
 As financier of health care Who really pays, really")
56
Salient Feature # 8 Taxing ESI Health Coverage likely… Increases demand for elaborate and many perk health plans (Cadillac tax of ACA) Big loss of tax revenue for government Think “budget deficits and the national debt” federal revenue lost = $268 B in 2011 federal deficit = $642 B (4% of GDP)
 Big loss of tax revenue for government Think budget deficits and the national debt federal revenue lost = $268 B in 2011 federal deficit = $642 B (4% of GDP)")
57
ESI and the demand for health care Gross Pay/Week Marginal Tax Rate Take Home Pay Insurance Cost $60/Week Net Take Home Pay Difference $1,00028%$720Employee Pays $660$17 $94028%$677Employer Pays $677 Assume Marginal Tax Rate Increases to 35 Percent $1,00035%$650Employee Pays $590$21 $94035%$611Employer Pays $611

58
Know Your Facts: Some Examples The uninsured go without coverage because they believe they do not need it or simply don’t want it.

59
Know Your Facts: Some Examples The uninsured don’t have ESI because they are not working

60
5 factors will shape the trajectory of future spending on health care.. 1. state of economy 2. impact of ACA, and future of 3. industry consolidation 4. shift toward value 5. empowerment of health care consumer

61
New trends? Share of population with private insurance dropped Share with public insurance and the uninsured increased Sustained in reductions in utilization Growth in hospital admissions and physician visits down

62
354,000 May Change Health Insurance

63
Stretch Time

Similar presentations


