Download presentation
Presentation is loading. Please wait.

1
Time Study=Work Measurement Part 1
Prof.Dr.Yasemin Claire ERENSAL

2
Work Standards Are based on the data collected through
work measurement processes. They should not be set at such a level that only the most productive worker will be able to attain them. Nor should they be set at such a level that nearly every employee can attain them with putting forth little effort to do so.

3
Advantages of Work Standards (1 of 2)
1. They help increase the efficiency with which employees perform their jobs. 2. They help inform employees of their expected production levels. 3. They assist managers in making personnel decisions, because employees who are performing beyond expected levels of production can be readily identified.

4
Advantages of Work Standards (2 of 2)
4. Because employees are aware of the procedures for performing their jobs, less supervision is needed and greater control over the work process is possible. 5. They provide the basis for incentive wage systems. 6. They help improve employee morale by making employees aware of what is expected of them.

5
Types of Standards Are expressed in units of Quantity
output per unit of time. Quantity Standards Measure the accuracy and acceptability of work. Quality Standards Identify what is acceptable in terms of the descriptive nature of something in an office, such as furniture. Descriptive Standards

6
Work Measurement Work measurement refers to the process of estimating the amount of worker time required to produce one unit of output. Work measurement is a process of analyzing jobs for the purpose of setting time standards. The goal of work measurement is to develop labor standards that can be used for planning and controlling operations.

7
Objectives of Work Measurement (1/2)
1. To express expected output or production levels. 2. To aid in the planning and scheduling of work. 3. To aid in determining the number of employees needed to complete a project in the allotted time. 4. To aid in determining the efficiency of work methods and procedures.

8
Objectives of Work Measurement (2/2)
5. To aid in determining the cost of office operations. 6. To aid in determining equitable work loads for employees.

9
Labor Standards A labor standard can be determined using one or more of the following approaches: subjective Historical standards Supervisor estimates objective Standard Data Work sampling Time study Predetermined time standards

10
Production Records and Expert Opinion Time Standards and Historical Data (Subjective)
Estimation of time required to do a specific time, normally performed by a supervisor – expert opinion Unfair due to variability among estimators Looking at a job and judging the amount of the time needed Historical data – records of previous times used on each job– does not include what time it should have taken Relatively easy, convenient, and inexpensive Not objective, unknown accuracy Not recommended

11
Production Records and Expert Opinion Time Standards and Historical Data (Subjective)
1. It is simple, easily understood, and inexpensive. 2. It facilitates the quick development and implementation of a work measurement program without the need for specially trained individuals.

12
Disadvantages of Production Records and Expert Opinion Time Standards and Historical Data (Subjective) It may produce inaccurate standards if employees don’t prepare accurate time logs. It results in preparation of standards on the basis of “what is” rather than on the basis of “what should be.”

13
Standard Data Fastest & cheapest technique – may be more accurate & consistent than any other time study technique. Compare previously set time standards to varying times on specific machines or class of machines. Communicate time standards through graphs, tables, worksheets, and formulas. Reference text (i.e. Machinery Handbook) or equipment manufacturers are a good source of standard data.
 or equipment manufacturers are a good source of standard data.")
14
Work Sampling Technique (1/2)
Uses a statistical base that requires random observations to determine the amount of time taken by each element of an office procedure. Statistical element is based on this law of probability: If a procedure is observed a sufficient number of times, the results will be as reliable as when the procedure is observed continuously over a period of time.

15
Work Sampling Technique (2/2)
The process helps determine what percent each activity consumes in a whole work process. Observe people working & draw conclusions This subject will furtherly handled on the next weeks.

16
Time Study Establishes a standard for a given task
Measures work content, allows for fatigue, personal and unavoidable delays Increases the efficiency of the equipment and personnel If standards are accurately established, they can increase the efficiency of the equipment and personnel. Poorly established standards result in high costs, labor dissension, possibly failure of an enterprise.

17
Advantages of the Time Study Technique
1. Results in the development of accurate standards. 2. Produces more accurate results when measuring work processes comprised of minute elements than either the production records technique or the work sampling technique. 3. Results in the development of standards that can be readily used for assessing the performance of employees.

18
Disadvantages of Time Study Technique
1. The measurement process often requires the use of a trained analyst. 2. Office employees tend to have a negative reaction to standards determined by the use of a stopwatch. 3. The technique is not useful for measuring time- consuming elements of a work process.

19
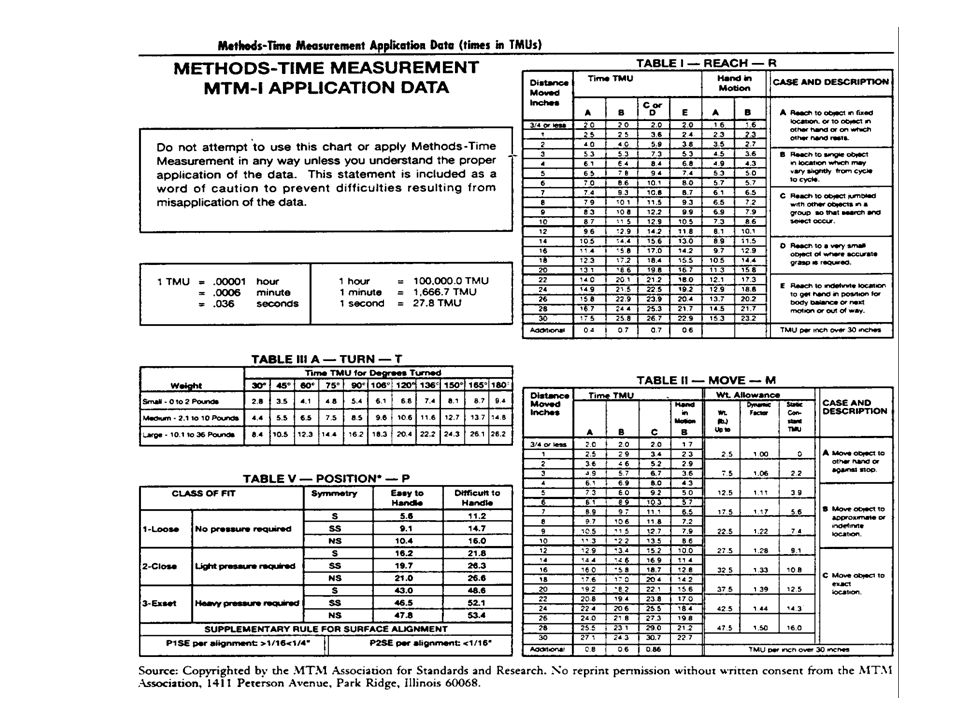
Predetermined Standard Time Data Technique (1 of 2)
Uses data typically obtained from external sources, such as purchased data. Tends to produce highly uniform results when based on standards that are consistent from one situation to another. Visualize needed tools, equipment, & work methods– work divided into 17 work elements (therbligs)
")
20
Predetermined Standard Time Data Technique (2 of 2)
Steps 1. The work process is broken down into its minute elements. 2. Each element is analyzed in terms of the motion involved. 3. To determine the appropriate standard, each motion of the work process is compared with the purchased predetermined standard time data. 4. The standard for the entire process is found by adding the standard times for each of the motions.

22
Advantages of Predetermined Standard Time Data Technique
1. It results in accurate standards. 2. Employees tend to accept results readily because of the specificity of the process. 3. Application of process is fairly rapid.

23
Disadvantages of Predetermined Standard Time Data Technique
1. It is a costly technique. 2. It is not suitable for certain types of office operations.

24
Performance Leveling Is a process that results in the adjustment of employee work standards, helping determine what constitutes a fair day’s work for both the employer and employee. The amount of work that can be produced by a qualified employee when working at a normal pace and effectively utilizing their time where work is not restricted by process limitations

25
Responsibilities in Work Measurement Activities

26
Analysts Responsibility
Normalize time Correct method, and understanding by all those involved in the study Accuracy and good judgment essential Good human relations most important: show respect Answer questions to allieviate fears: TS must never become vindictive: Sally Fields Sign the study

27
Supervisor's Responsibility
Notify operator in advance Verify correct tools, equipment, supplies, and method. Select a qualified, cooperative operator and answer all questions in advance of the study. Sign the study

28
Union’s Responsibility
Most are opposed. They must recognize the necessity for profitability. Provide members training in TS to promote acceptance and validity. Make sure study includes a complete record of the job. May wish to be present at the time of the study.

29
Operator’s Responsibility
Assist in the establishment of the most efficient method for the job. Assist in breaking down job into elements that can be useful Cooperate during the study Avoid vigorous application of non-essential elements. Sign the study Do not sit during the time study

30
Work Measurement Standard time: (Labor standards)
The length of time a qualified worker, using appropriate tools & procedures, will take to complete a job A labor standard is the number of worker-minutes required to complete an element, operation, or product under ordinary operating conditions. Ordinary operating conditions refers to a hypothetical average situation ….. average or typical worker, material, machinery, environment, etc.

31
Labor (Time) Standard Time required to produce a product at a work station with the following: Qualified, well-trained operator Working at a normal pace Doing s specific task Before data are gathered, all wasted motions are eliminated from the process being analyzed. Time in decimal minutes (3 decimal places) Pieces per hour Hours per piece Qualified , well-trained operator – time for training varies with job and personnel – minimum two weeks on job prior to time study (predetermined time studies used with new jobs) Normal pace – walking 3 mi/hr; dealing 52 cards into 4 equal stacks in minutes; filling a 30pin pinboard in minutes using 2 hands Specific task – detailed description of what needs to be done – includes prescribed work method; material specification; tools & equipment being used; positions of ingoing and outgoing material; safety, housekeeping, and maintenance tasks Time standard good for only one set of specific conditions – if anything changes, then need to change time standard
 Pieces per hour. Hours per piece. Qualified , well-trained operator – time for training varies with job and personnel – minimum two weeks on job prior to time study (predetermined time studies used with new jobs) Normal pace – walking 3 mi/hr; dealing 52 cards into 4 equal stacks in minutes; filling a 30pin pinboard in minutes using 2 hands. Specific task – detailed description of what needs to be done – includes prescribed work method; material specification; tools & equipment being used; positions of ingoing and outgoing material; safety, housekeeping, and maintenance tasks. Time standard good for only one set of specific conditions – if anything changes, then need to change time standard.")
32
Learning Curves

33
Workforce Productivity Improvement – Learning Curves
A learning curve shows the reduction in time it takes to complete a task as the number of times it has been completed increases. Individuals, groups, and organizations all have learning curves The learning rate is the amount of improvement obtained as a task is repeated. The gain expressed by the learning rate is achieved every time the number of repetitions doubles. The learning rate is almost always a prediction. There are always errors in predictions, and errors in estimating the learning rate can have a tremendous impact on the projected time

34
Workforce Productivity Improvement – Learning Curves
If an individual completed a task for the first time in 4 hours and his learning rate was expected to be 90%, we would observe the following pattern: Exhibit 16.7 Learning Curve Pattern

35
Workforce Productivity Improvement – Learning Curves
A lower percentage means faster learning. 85% vs. 97% learning curves: Exhibit percent learning curve Exhibit percent learning curve

36
Workforce Productivity Improvement – Learning Curves
The equation for the learning curve is Tn = T1nr Where Tn = time in hours to produce nth unit T1 = time in hours to produce the first unit n = number of the unit of interest r = log l/log 2 where l is the expected learning rate

37
Workforce Productivity Improvement – Learning Curves
Example 16.3: A producer of machined components wants to determine the time it will take to produce the 300th unit on a new machine. The time for the first unit is 1.75 hours and the learning rate is 96% Tn = T1nr T300 = 1.75(300)log 0.96/log 2 = 1.75(300) = 1.75(300)0.0589 = hours
log 0.96/log 2. = 1.75(300) = 1.75(300) = hours.")
38
Training approaches INSTALL NEW METHOD:Need to train workers in new method 1) 'Learn-on-the-job' approach - learn wrong method - bother other operators, lower production - anxiety 2) Simple written instructions - only good for very simple jobs 3) Pictorial instructions - 'pictures worth 1000 words‘ 4) Videotapes - dynamic rather than static 5) Physical training - - real equipment or simulators, valid - doesn't interrupt production - monitor performance - simulate emergencies
 Simple written instructions - only good for very simple jobs. 3) Pictorial instructions - pictures worth 1000 words‘ 4) Videotapes - dynamic rather than static. 5) Physical training - - real equipment or simulators, valid. - doesn t interrupt production. - monitor performance. - simulate emergencies.")
39
Factors that affect human learning
1) Job complexity - long cycle length, more training, amount of uncertainty in movements, more C-type motions, simultaneous motions 2) Individual capabilities- age, rate of learning declines in older age, amount of prior training, physical capabilities, active, good circulation of oxygen to brain
 Job complexity - long cycle length, more training, amount of uncertainty in movements, more C-type motions, simultaneous motions. 2) Individual capabilities- age, rate of learning declines in older age, amount of prior training, physical capabilities, active, good circulation of oxygen to brain.")
40
Learning Curves Assumption is that given exposure to repetitive tasks workers are likely to learn from cumulative experience how such tasks can be performed more quickly and efficiently, e.g. the second identical house can be constructed for less than the first; learning reduces the cost of succeeding units learning curves relate cost to cumulative nr.s of units produced

41
Learning Curve For Mass Production
Processing time decreases with worker learning (experience) Time per unit decreases by constant percentage each time output doubles Use to plan labour, budget & scheduling requirements
 Time per unit decreases by constant percentage each time output doubles. Use to plan labour, budget & scheduling requirements.")
42
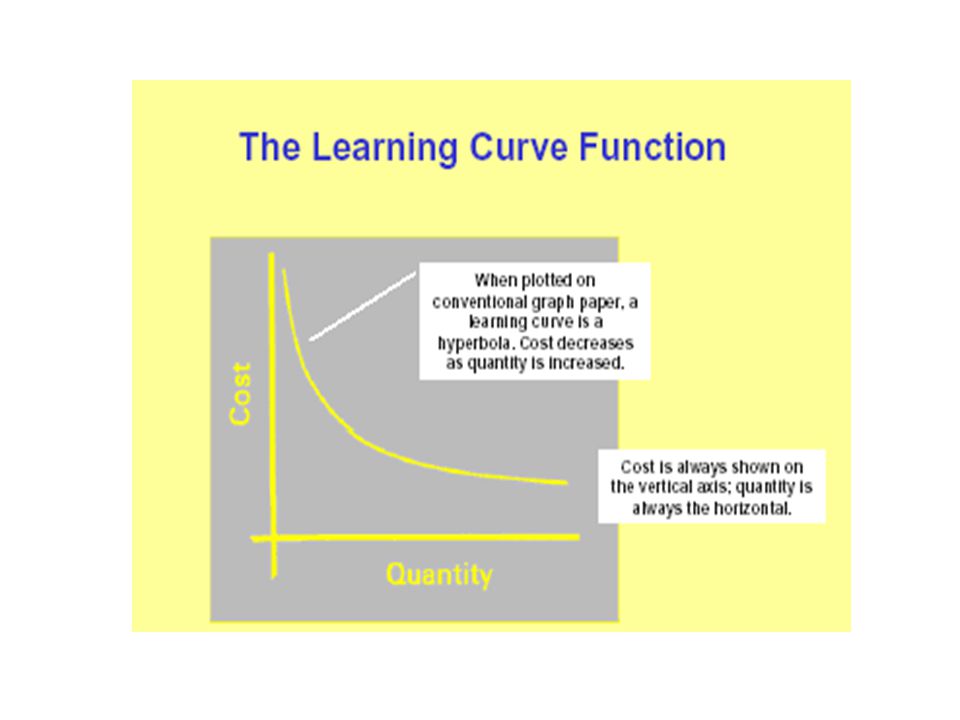
Learning Curve Definition
The Learning Curve is a tool to help estimate future manufacturing costs. It is based on a relationship between cost (the dependent variable) and quantity (the independent variable)
 and quantity (the independent variable)")
43
History of Learning Curve
• The concept of the learning curve was introduced to the aircraft industry in 1936 when T. P. Wright published an article in the February 1936 Journal of the Aeronautical Science. • Wright described a basic theory for obtaining cost estimates based on repetitive production of airplane assemblies. • Since then, learning curves (also known as progress functions) have been applied to all types of work from simple tasks to complex jobs like manufacturing a Space Shuttle.
 have been applied to all types of work from. simple tasks to complex jobs like manufacturing a Space. Shuttle.")
44
Theory of Learning Curve
• The theory of learning is recognized that repetition of the same operation results in less time or effort expended on that operation. • For the Wright learning curve, the underlying hypothesis is that the direct labor man-hours necessary to complete a unit of production will decrease by a constant percentage each time the production quantity is doubled. • If the rate of improvement is 20% between doubled quantities, then the learning percent would be 80% (100- 20=80). • While the learning curve emphasizes time, it can be easily extended to cost as well.
. • While the learning curve emphasizes time, it can be easily extended to cost as well.")
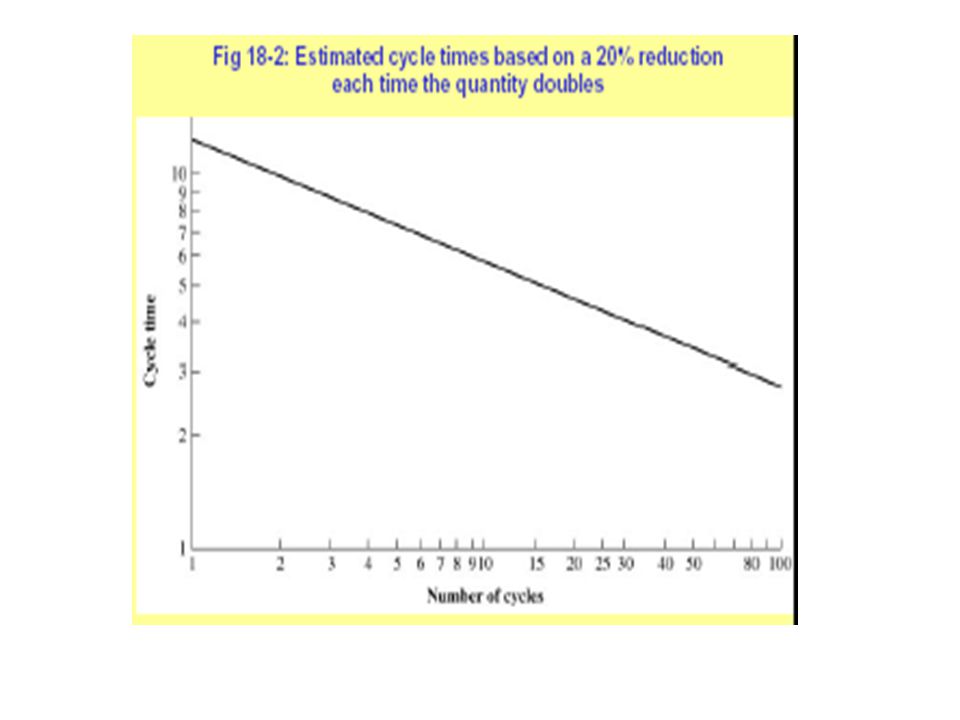
45
The Learning Curve • Learning Curve - the longer a person performs a task, the quicker it takes him Fig 18-2: Estimated cycle times based on a 20% reduction each time the quantity doubles

47
Learning Effect Time per repetition Number of repetitions

49
Types of Learning Individual Learning Improvement when individuals gain a skill or efficiency by repetition of a job. Organizational Learning Improvement from the groups of individuals from repetition and changes in administration, equipment, and product design.

50
Learning Curves At the start of production runs:
Workers are unfamiliar with their tasks Time it takes to produce the first few units is high As the workers learn their tasks: Their output per day increases up to a point Then their output levels off to a rather constant rate

51
Learning with Improvements
Time per unit Time Average Improvements may create a scallop effect in the curve.

52
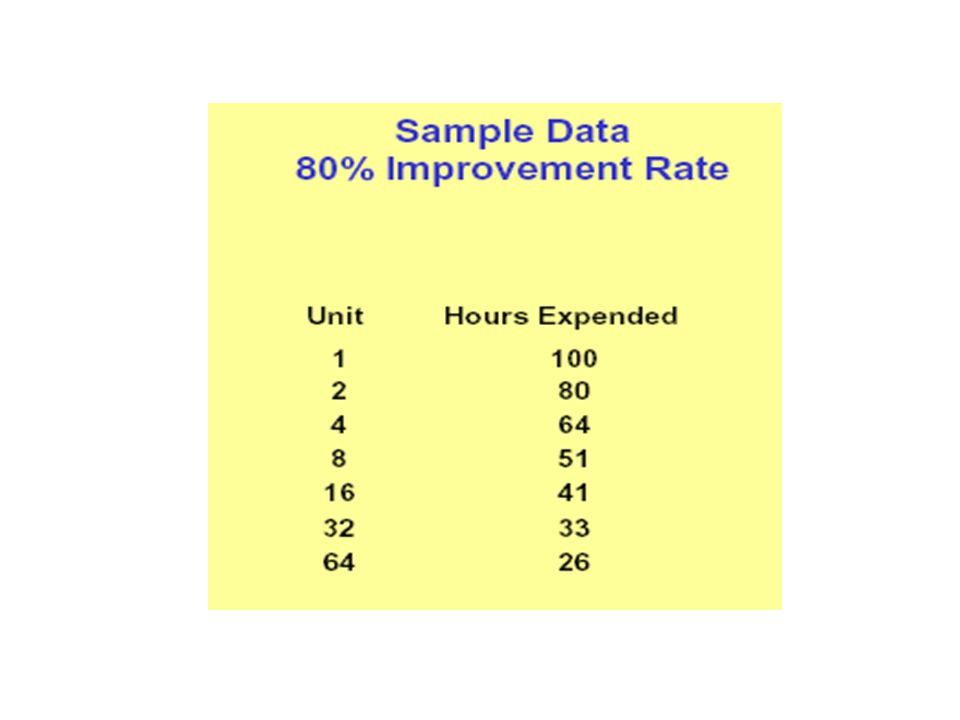
Learning Curves Most aircraft manufacturing tasks experience an 80% learning rate Labor-hours required to assemble an aircraft is reduced by a factor of 0.8 as the production quantity doubles If first aircraft assembled requires 100 labor-hours Second aircraft would require 80 labor-hours Fourth aircraft would require 64 labor-hours Eighth aircraft would require 51.2 labor-hours … and so on

53
Labor-Hours for nth Unit
Learning Curves 20 80 40 100 60 Unit Number (n) 120 Labor-Hours for nth Unit Aircraft Assembly 80% Learning Curve
 120. Labor-Hours for nth Unit. Aircraft Assembly. 80% Learning Curve.")
54
Learning Curves By analyzing workers’ learning situations, we are able to estimate: The average number of labor-hours required per unit for N units in a production run The total number of labor-hours required to produce N units in a production run The exact number of labor-hours required to produce the nth unit of a production run

55
Worker Learning Curves
Time/cycles A (underqualified) B (average) Standard time C (overqualified) One week Training time
 B (average) Standard time. C (overqualified) One week. Training time.")
56
Learning Curve for Mass Production Job
Standard time End of improvement Units produced Processing time per unit Figure 17.7

57
Some Other Names of Learning Curves
Experience Curve Improvement Curve Manufacturing Progress Curve Cost Curve Cost Reduction Curve

58
Learning curve assumptions
• The time required to complete a specified task or unit of a product or item will be less each time the task is performed; • The unit time will reduce at a decreasing rate; • The decrease in time will follow a certain pattern, such as negative exponential distribution shape. • The learning curve may vary one product to another and from one organization to another. The rate of learning depends on factors such as the quality of management and the potential of the process and products

59
• The Table presents data on learning curve effects in the U.S.
industrial sector . An 80% learning rate is descriptive of certain operations in such areas as ship construction, electronic data processing equipment, automatic machine production, and aircraft instruments and frame assemblies. • The learning curves are found to be quite useful in a variety of applications, including strategic evaluation of company and industry performance, internal labor forecasting, establishing costs and budgets, production planning, external purchasing, and subcontracting of items • The learning curve theory is based on a doubling of productivity. More specifically, when output or production doubles, the reduction in time per unit affects the learning curve rate. For example, an 80% learning rate means the second unit takes 80% of the time of the first unit, the fourth unit takes 80% of the second unit, the eighth unit takes 80% of the fourth unit, and so

65
Curve slope can always be found using the relationship between doubled quantities

66
Theory Theory = as number of cycles doubles, cycle time decreases by a constant %

67
Theory Result: 20% decrease or 80% learning ratio or 80% learning curve, or mathematically y = kxn • However, easier to plot and calculate if on log-log paper log10 y = log10k + n×log10 x where: y = cycle time x = number of cycles or units produced n = exponential representing the slope k = value of first cycle time or, rearranging and solving for n: n = log10(learning percent)/log102 For 80% learning: n = log10(0.80)/log102= /0.301 =
/log102. For 80% learning: n = log10(0.80)/log102= /0.301 =")
68
Theory Or from the slope:
n = (log10 y1 - log10 y2)/(log10 x1 - log10 x2) n = (log log )/(log log10 16) = ( )/( ) = -.322 • solve for k, by substituting (1,12) into the main equation yielding k=12, therefore the final equation for the learning curve: y = 12 x -.322
/(log10 x1 - log10 x2) n = (log log )/(log log10 16) = ( )/( ) = • solve for k, by substituting (1,12) into the main equation yielding k=12, therefore the final equation for the learning curve: y = 12 x")
69
Theory • a) MTM-2 analysis shows a standard time of 2 min. How many cycles does it take to reach it? • 2 = 12 x -.322 • Then take logs of both sides and solve for x: log10 (2/12) = log10 x log10 x = /-.322 = 2.417 x = antilog = = 262 (round up!!)
 = log10 x. log10 x = /-.322 = x = antilog = = 262 (round up!!)")
70
Learning Curves Three approaches to learning-curve problems are:
Arithmetic analysis Logarithmic analysis Learning curve tables

71
Learning Curves Arithmetic Analysis
The simplest approach to learning-curve problems If we wish to find the labor-hours required to produce n units, and n just happens to be a number that is one of the doubled values, then this approach works

72
Example: EZ Machine Shop (A)
Learning Curve - Arithmetic Analysis EZ Machine Shop has a contract to manufacture 100 turbines. The first 20 turbines have been completed. The labor-hours required for a portion of the completed turbines are listed below. Use this data to estimate the shop’s learning rate in manufacturing the turbines. Unit No. Labor-Hours Unit No. Labor-Hours

73
Example: EZ Machine Shop (A)
Learning Curve - Arithmetic Analysis Compute the learning rate for each of the “doubles”. Units 1 and 2 118/140 = Units 2 and 4 102/118 = Units 5 and 10 81/ = Units 10 and 20 68/ = ( )/4 = .8499 The approximate learning rate is 85%.
/4 = The approximate learning rate is 85%.")
74
Learning Curves Learning-Curve Tables
A table of learning curve coefficients allows us to compute: The labor-hours for the nth unit in a production run The total labor-hours for the entire production run, where the nth unit is the last unit in the run

75
Example: EZ Machine Shop (B)
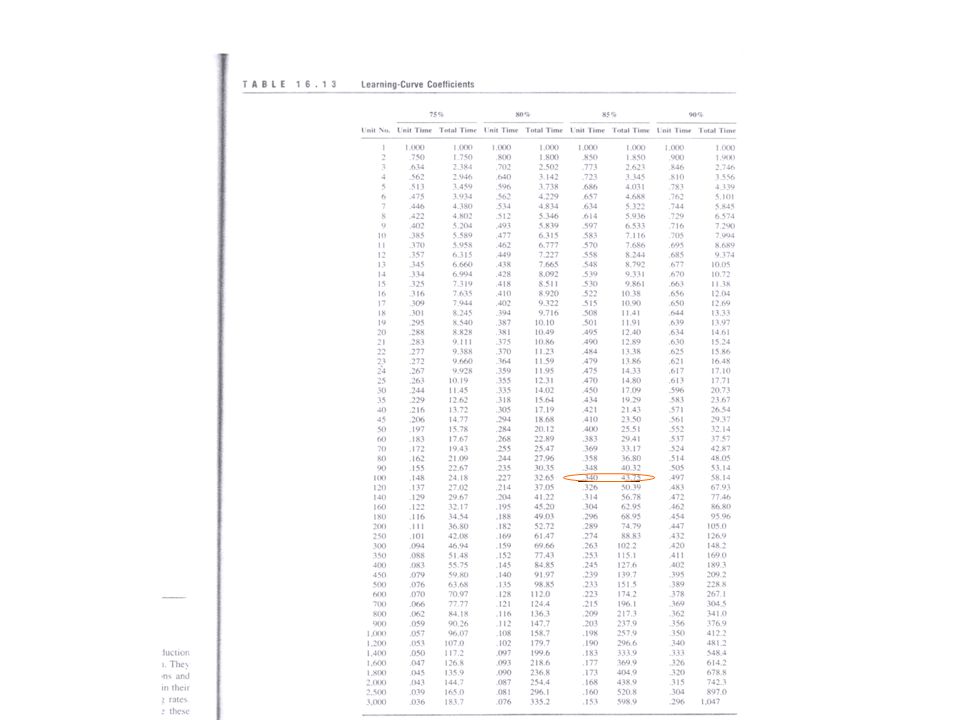
Learning-Curve Tables The manager of EZ Machine Shop wants a good estimate of the total labor-hours required to manufacture the entire 100 turbines. Also, he is curious about how many labor-hours will be needed for the last (100th) unit. Use the observed 85% learning rate and 140 labor-hours required for the first turbine to compute your estimates.
 unit. Use the observed 85% learning rate and 140 labor-hours required for the first turbine to compute your estimates.")
77
Example: EZ Machine Shop (B)
Learning-Curve Tables Total Labor-Hours Required for 100 Units = (Hours for 1st unit)(Table total time: 85%, 100th unit) Look at Table, locate the line for the 100th unit and read across to the Total Time column under the 85% learning rate. The value is = 140(43.75) = 6,125 labor-hours
(Table total time: 85%, 100th unit) Look at Table, locate the line for the 100th unit and read across to the Total Time column under the 85% learning rate. The value is = 140(43.75) = 6,125 labor-hours.")
78
Example: EZ Machine Shop (B)
Learning-Curve Tables Labor Hours Required for the 100th Unit = (Hours for 1st unit)(Table unit time: 85%, 100th unit) In Table, locate the line for the 100th unit and read across to the Unit Time column under the 85% learning rate. The value is .340. = 140(.340) = labor-hours (100th unit will require 34% of the time 1st unit required)
(Table unit time: 85%, 100th unit) In Table, locate the line for the 100th unit and read across to the Unit Time column under the 85% learning rate. The value is = 140(.340) = 47.6 labor-hours. (100th unit will require 34% of the time 1st unit required)")
79
Learning Curves Logarithmic Analysis
The following relationship allows us to compute Tn, the labor-hours required to produce the nth unit: Tn = T1(nb) and b = log r/log 2 where: T1 = labor-hours to produce the first unit b = slope of the learning curve b = ln r / ln 2, where r is the percentage rate of improvement r = learning rate percentage
 and b = log r/log 2. where: T1 = labor-hours to produce the first unit. b = slope of the learning curve. b = ln r / ln 2, where r is the percentage rate of improvement. r = learning rate percentage.")
80
Example: EZ Machine Shop (C)
Logarithmic Analysis Compute, using logarithmic analysis, the labor-hours required for the 50th turbine (assuming an 85% learning rate and 140 labor-hours required for the 1st unit). b = log (.85)/log (2) = T50 = 140( ) = or (Our result agrees with the value in Table 18.12)
. b = log (.85)/log (2) = T50 = 140( ) = or (Our result agrees with the value in Table 18.12)")
81
Major Issues in Application
Selection of Slope Rate of Production Breaks in Production How long does learning go on?

83
More On Learning Curves
Not effective for mass production jobs Product modifications negate effects Improvement can derive from sources besides learning Industry-derived learning curve rates may be inappropriate

84
Some Factors Affecting Improvement Rate
Previous experience Design complexity Labor grades/mix Training/supervision Parts availability Workmanship standards Tooling availability Degree of automation Changes in configuration Support and services Personnel turnover Rate of production Total quantity Lapses in production Schedule fluctuation Parts quality Tolerances Outside influences (e.g., the customer)
")
85
Some Problems in Curve Application
Learning Curves are a technique to help predict the future; they are inherently inexact Technique is subjective and judgmental Frequent misuse Occasional abuse Lack of complete understanding by many practitioners

Similar presentations


 © 2001 by Prentice Hall, Inc., Upper Saddle River, N.J. 07458 S10-1 Operations.>")


