Download presentation
Presentation is loading. Please wait.

1
Interim Report Charter Schools in New Jersey

2
Charter Landscape Expand Options and Encourage Innovation Charters provide families—especially low-income families—with much- needed alternatives within public education. The charter sector provides a supportive environment for innovative programs We recently approved 23 new charters, including a number in struggling districts as well as the first virtual charters. This fall, we will have nearly 100 charters across the state, making NJDOE the nation’s 4 th largest charter authorizer Accountability But not all charters are high-performing—and that’s our standard. “Just better than the nearby neighborhood school” is not good enough. We will continue to support charter school expansion, but it will always be with an eye on quality. We will not hesitate to close charters failing to live up to their promise. We recently placed two charters on probation.

3
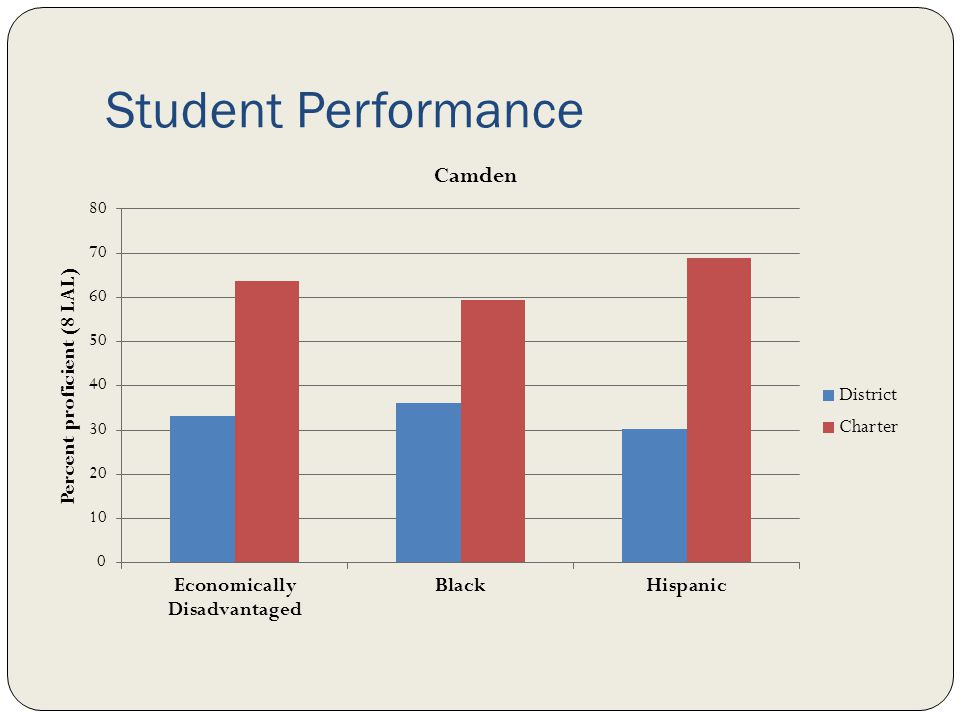
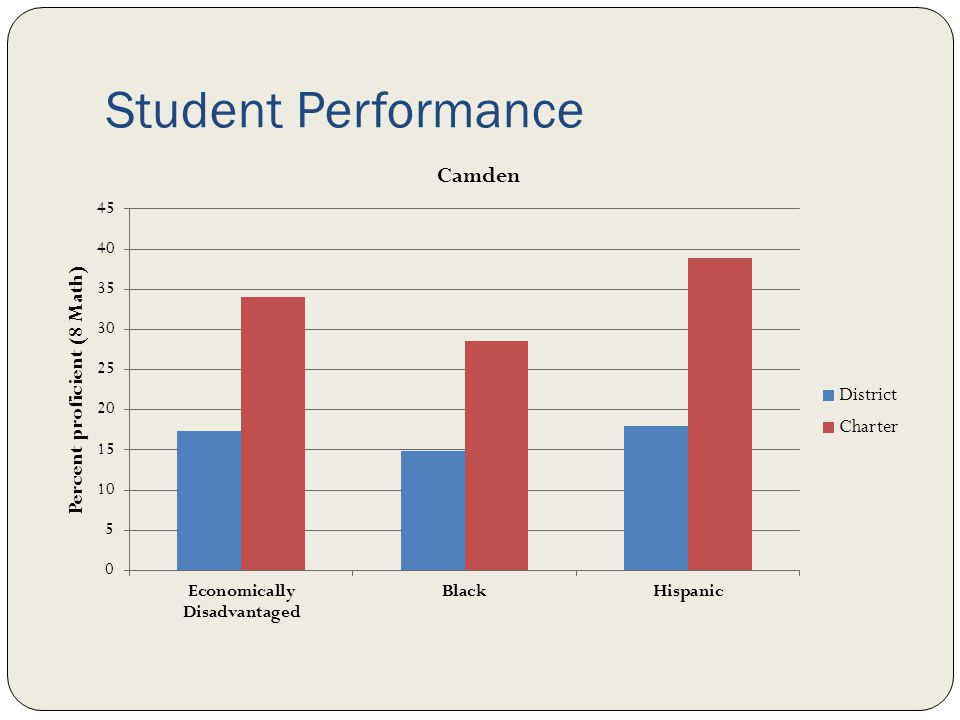
Charter Performance: Initial Data Charters and Districts Charter advantage across Abbotts: In LAL, 79 percent of charters outperformed their home districts In math, 69 percent of charters outperformed their home districts Newark 7 of 9 charters outperformed district Several charters outperformed the state average Camden: 4 of 4 charters outperformed district But this is high level data, requiring much deeper analysis http://www.nj.gov/education/chartsch/expectations.pdf

4
Ongoing Analysis While these data are directionally informative, we will continue to pursue deeper analysis to understand: Charter performance for all student groups; The reasons why some charters out / under perform their home districts We will expand the quantity and quality of data that is on the internet about all schools, including charters, to encourage thoughtful analysis and transparency. In the very near future, we will commission an independent analysis of all this data to further inform our charter policies

5
Special Education On average, charters serve a smaller number of students with disabilities than traditional public schools District public school average:15.87% Charter public school average:8.24% Although lower, this figure dispels the myth that charters aren’t serving special needs children As of October 2009, more than 1,700 students with disabilities were attending charters. New Jersey ‘s special education classification rate consistently ranks among the nation’s highest In Camden, 30% of district 8 th grade test takers are identified as students with disabilities

6
Special Education It is also important to note the variation in classification percentages within the charter sector.

7
Special Education Do charters push out special education students? Some charter schools may directly or indirectly indicate to families of students with disabilities that they are not able to address the individual needs of the students. Other possible explanations: Parents of some special education students with intensive needs are satisfied with the specialized services their children receive Charters might successfully educate students in their general education programs and not need to refer students for special education Some parents of students with disabilities are reluctant to send their children to new programs that do not have a history of serving students with disabilities. Charters currently serve fewer high grades, and in some urban district schools, special education classifications grow each year

8
Free and Reduced-price Lunch The state aid formula does not distinguish between “free” and “reduced”-price lunch count. Federal programs and accountability, such as AYP, also combine the two categories All students in both these categories are generally used by researchers throughout the country as a good enough proxy for “economically disadvantaged” And most important, research shows that concentration of poverty in schools creates unique challenges, and most charters in NJ cross a threshold of concentrated poverty that makes these distinctions meaningless

10
Urban Student Poverty, by Sector

11
Free vs. Reduced-price Lunch

14
Charter Performance: Follow-up Data Removed special education and ELL from comparison Still a charter advantage: more charters outscored their local districts statewide. The charter advantage appears to grow in higher grades

15
Student Performance

16
Pride North Star

17
Student Performance Lady Liberty

18
Student Performance NPS North Star

19
Student Performance Foundation Emily Fisher TPS

20
Student Performance Foundation TPS Emily Fisher

21
Student Performance

27
Charter Advantage Grows

28
+5 +13 +25 +26 +23

29
Charter Advantage Grows

30
+8 +11 +23 +32 +15 +26

31
Next Steps Continue internal research Increase transparency – expand the quantity of data available online Commission independent researchers to conduct deeper analysis Restructure charter schools office to improve services, accountability and support

Similar presentations


 U.S. Department of Education Adapted by TEA September 2003.>")


 1 October 22, 2012 Westlawn Elementary School.>")

