Download presentation
Presentation is loading. Please wait.

1
CH217 Fundamentals of Analytical Chemistry
Module Leader: Dr. Alison Willows

3
Assessment Practicals 60% End of module examination 40%
Practical 1: online quiz during lab session Practicals 2 & 3: electronic reports, see lab scripts End of module examination 40% In addition you are also required to: Complete the guided study (not assessed) Attend all the labs Attend at least 80% lectures/workshops
 Attend all the labs. Attend at least 80% lectures/workshops.")
4
Studentcentral Module content and assignments are available through studentcentral You will be required to submit your coursework electronically via studentcentral The guided study will be an electronic test on studentcentral Feedback on assessments will also be electronic Please familiarise yourself with studentcentral!

5
Recommended reading The module descriptor tells you what you should know by the end of this module The information given in lectures and on studentcentral is only a guideline to aid your study Please refer to the module learning handbook and studentcentral for a list of recommended books and other useful resources. You will not achieve a good grade in this module without doing additional reading outside of the lectures

6
Principles of Analytical design
DTI's Valid Analytical Measurement programme The six principles of good analytical practice Analytical measurements should be made to satisfy an agreed requirement. Analytical measurements should be made using methods and equipment which have been tested to ensure they are fit for purpose. Staff making analytical measurements should be both qualified and competent to undertake the task. There should be a regular independent assessment of the technical performance of a laboratory Analytical measurements made in one location should be consistent with those elsewhere. Organisations making analytical measurements should have well defined quality control and quality assurance procedures. Principles of Analytical design DTI's Valid Analytical Measurement programme The six principles of good analytical practice Analytical measurements should be made to satisfy an agreed requirement. Analytical measurements should be made using methods and equipment which have been tested to ensure they are fit for purpose. Staff making analytical measurements should be both qualified and competent to undertake the task. There should be a regular independent assessment of the technical performance of a laboratory Analytical measurements made in one location should be consistent with those elsewhere. Organisations making analytical measurements should have well defined quality control and quality assurance procedures. role of analytical chemistry in science Do I need analytical chemistry? Analytical chemistry might enable you to pass your course help you to understand other modules be useful in your career be interesting help with your final year project change your life! What is analytical chemistry? Dictionary definitions Analytical (adj) examining or tending to examine things very carefully Cambridge Advanced Learner's dictionary Analytical chemistry encompasses any type of test that provides information on the amount or identification of the chemical composition of a sample. This breaks down into two main areas of analysis: qualitative and quantitative Qualitative analyses give a positive/negative or yes/no answer. This tells us whether a substance (the analyte) is present but doesn't tell us how much is there. One example is a home pregnancy test which indicates the presence (positive) or lack (negative) of a pregnancy by analysing a hormone that appears in a woman's blood and urine, human chorionic gonadotropin (HCG). In this case we do not need to know how much of the hormone is present so a qualitative analysis is sufficient. A qualitative analysis may also identify substances in a sample Quantitative analyses tell us how much of a substance is in the sample. One example is a diabetes glucose monitor that measures the amount of glucose in the blood When and where is analytical chemistry used? Food industry - wine production; contaminants; process lines Medical - blood analysis; imaging; pharmaceutical - drug analysis environmental - water, gas & soil analysis engineering - materials characterisation crime - forensics (CSI) sport & leisure - pool chlorination; drugs tests Research Calibration Analytical methods, particularly those using instruments, frequently require calibration procedures These are to establish: the response to known quantities of analyte (standards) within the range used the reliability/drift of the method limits beyond which detection/quantitation is unreliable Calibration normally involves: measurement of samples of known concentrations measurement of a relevant range of concentrations a range in which the response is linear graphical treatment of results modified calculation of errors reporting Analytical Documentation Written analytical procedures are used to allow other competent analysts to reproduce the method. Sufficient detail is required to obtain consistent results. Trained and competent personnel are still required even when a full detailed document is available Analytical Documentation for Procedures Scope and applicability Samples Analytes Ranges Description and principle of the method Equipment Specification Calibration and qualification Range of operability Reference materials and reagents Preparation Storage Health & Safety Sampling Methods Limitations Analytical Procedure Preparation of samples Preparation of standards Critical factors Detailed description of all steps Typical outputs; chromatograms, spectra, etc. Recording and reporting of data Method Rounding and significant figures Data treatments Calculation of results Calibration model Calculation methods Assumptions and limitations Method performance Statistical measures Control charting References & Bibliography Drawing conclusions In a written report of an experiment you must come to some conclusion about the work Use the information from the statistical tests and performance parameters Pull together all the information Keep the wording ‘analytical’ i.e. use ‘accurate’ and ‘precise’ correctly, and don’t over-generalise Make informed judgements about the technique and compare to other possible techniques
 examining or tending to examine things very carefully. Cambridge Advanced Learner s dictionary. Analytical chemistry encompasses any type of test that provides information on the amount or identification of the chemical composition of a sample. This breaks down into two main areas of analysis: qualitative and quantitative. Qualitative analyses give a positive/negative or yes/no answer. This tells us whether a substance (the analyte) is present but doesn t tell us how much is there. One example is a home pregnancy test which indicates the presence (positive) or lack (negative) of a pregnancy by analysing a hormone that appears in a woman s blood and urine, human chorionic gonadotropin (HCG). In this case we do not need to know how much of the hormone is present so a qualitative analysis is sufficient. A qualitative analysis may also identify substances in a sample. Quantitative analyses tell us how much of a substance is in the sample. One example is a diabetes glucose monitor that measures the amount of glucose in the blood. When and where is analytical chemistry used Food industry - wine production; contaminants; process lines. Medical - blood analysis; imaging; pharmaceutical - drug analysis. environmental - water, gas & soil analysis. engineering - materials characterisation. crime - forensics (CSI) sport & leisure - pool chlorination; drugs tests. Research. Calibration. Analytical methods, particularly those using instruments, frequently require calibration procedures. These are to establish: the response to known quantities of analyte (standards) within the range used. the reliability/drift of the method. limits beyond which detection/quantitation is unreliable. Calibration normally involves: measurement of samples of known concentrations. measurement of a relevant range of concentrations. a range in which the response is linear. graphical treatment of results. modified calculation of errors. reporting. Analytical Documentation. Written analytical procedures are used to allow other competent analysts to reproduce the method. Sufficient detail is required to obtain consistent results. Trained and competent personnel are still required even when a full detailed document is available. Analytical Documentation for Procedures. Scope and applicability. Samples. Analytes. Ranges. Description and principle of the method. Equipment. Specification. Calibration and qualification. Range of operability. Reference materials and reagents. Preparation. Storage. Health & Safety. Sampling. Methods. Limitations. Analytical Procedure. Preparation of samples. Preparation of standards. Critical factors. Detailed description of all steps. Typical outputs; chromatograms, spectra, etc. Recording and reporting of data. Method. Rounding and significant figures. Data treatments. Calculation of results. Calibration model. Calculation methods. Assumptions and limitations. Method performance. Statistical measures. Control charting. References & Bibliography. Drawing conclusions. In a written report of an experiment you must come to some conclusion about the work. Use the information from the statistical tests and performance parameters. Pull together all the information. Keep the wording ‘analytical’ i.e. use ‘accurate’ and ‘precise’ correctly, and don’t over-generalise. Make informed judgements about the technique and compare to other possible techniques.")
7
Role of analytical chemistry in science
Do I need analytical chemistry? Analytical chemistry might: enable you to pass your course help you to understand other modules be useful in your career be interesting help with your final year project change your life! role of analytical chemistry in science Do I need analytical chemistry? Analytical chemistry might enable you to pass your course help you to understand other modules be useful in your career be interesting help with your final year project change your life! What is analytical chemistry? Dictionary definitions Analytical (adj) examining or tending to examine things very carefully Cambridge Advanced Learner's dictionary Analytical chemistry encompasses any type of test that provides information on the amount or identification of the chemical composition of a sample. This breaks down into two main areas of analysis: qualitative and quantitative Qualitative analyses give a positive/negative or yes/no answer. This tells us whether a substance (the analyte) is present but doesn't tell us how much is there. One example is a home pregnancy test which indicates the presence (positive) or lack (negative) of a pregnancy by analysing a hormone that appears in a woman's blood and urine, human chorionic gonadotropin (HCG). In this case we do not need to know how much of the hormone is present so a qualitative analysis is sufficient. A qualitative analysis may also identify substances in a sample Quantitative analyses tell us how much of a substance is in the sample. One example is a diabetes glucose monitor that measures the amount of glucose in the blood When and where is analytical chemistry used? Food industry - wine production; contaminants; process lines Medical - blood analysis; imaging; pharmaceutical - drug analysis environmental - water, gas & soil analysis engineering - materials characterisation crime - forensics (CSI) sport & leisure - pool chlorination; drugs tests Research Analytical Process The analytical process Formulating the question Selecting analytical procedures conducting the analysis Sampling Sample preparation calibration of method Sample analysis collection and processing of data and calculation of errors method validation Reporting and interpretation (Results & discussion) Drawing conclusions (answering the question!)
 examining or tending to examine things very carefully. Cambridge Advanced Learner s dictionary. Analytical chemistry encompasses any type of test that provides information on the amount or identification of the chemical composition of a sample. This breaks down into two main areas of analysis: qualitative and quantitative. Qualitative analyses give a positive/negative or yes/no answer. This tells us whether a substance (the analyte) is present but doesn t tell us how much is there. One example is a home pregnancy test which indicates the presence (positive) or lack (negative) of a pregnancy by analysing a hormone that appears in a woman s blood and urine, human chorionic gonadotropin (HCG). In this case we do not need to know how much of the hormone is present so a qualitative analysis is sufficient. A qualitative analysis may also identify substances in a sample. Quantitative analyses tell us how much of a substance is in the sample. One example is a diabetes glucose monitor that measures the amount of glucose in the blood. When and where is analytical chemistry used Food industry - wine production; contaminants; process lines. Medical - blood analysis; imaging; pharmaceutical - drug analysis. environmental - water, gas & soil analysis. engineering - materials characterisation. crime - forensics (CSI) sport & leisure - pool chlorination; drugs tests. Research. Analytical Process. The analytical process. Formulating the question. Selecting analytical procedures. conducting the analysis. Sampling. Sample preparation. calibration of method. Sample analysis. collection and processing of data and calculation of errors. method validation. Reporting and interpretation (Results & discussion) Drawing conclusions (answering the question!)")
8
What is analytical chemistry?
Dictionary definitions Analytical (adj) examining or tending to examine things very carefully Chemistry(noun) 1.(the part of science which studies) the basic characteristics of substances and the different ways in which they react or combine with other substances. 2. INFORMAL understanding and attraction between two people Cambridge Advanced Learner's dictionary Analytical chemistry encompasses any type of test that provides information on the amount or identification of the chemical composition of a sample. This breaks down into two main areas of analysis: qualitative and quantitative
 examining or tending to examine things very carefully. Chemistry(noun) 1.(the part of science which studies) the basic characteristics of substances and the different ways in which they react or combine with other substances. 2. INFORMAL understanding and attraction between two people. Cambridge Advanced Learner s dictionary. Analytical chemistry encompasses any. type of test that provides information. on the amount or identification of the. chemical composition of a sample. This breaks down into two main. areas of analysis: qualitative and quantitative.")
9
Qualitative vs.. Quantitative
Qualitative analyses give a positive/negative or yes/no answer. This tells us whether a substance (the analyte) is present but doesn't tell us how much is there. A qualitative analysis may also identify substances in a sample Quantitative analyses tell us how much of a substance is in the sample.
 is present but doesn t tell us how much is there. A qualitative analysis may also identify substances in a sample. Quantitative analyses tell us how much of a substance is in the sample.")
10
When and where is analytical chemistry used?
Food industry - wine production; contaminants; process lines Medical - blood analysis; imaging; Pharmaceutical - drug analysis Environmental - water, gas & soil analysis Engineering - materials characterisation Crime - forensics (CSI) Sport & leisure - pool chlorination; drugs tests Research
 Sport & leisure - pool chlorination; drugs tests. Research.")
11
Analytical Process Formulating the question
Selecting analytical procedures Conducting the analysis Sampling Sample preparation calibration of method Sample analysis Collection and processing of data and calculation of errors Analytical Process The analytical process Formulating the question Selecting analytical procedures conducting the analysis Sampling Sample preparation calibration of method Sample analysis collection and processing of data and calculation of errors method validation Reporting and interpretation (Results & discussion) Drawing conclusions (answering the question!)
 Drawing conclusions (answering the question!)")
12
Analytical Process, cont.
Method validation Reporting and interpretation (results & discussion) Drawing conclusions (answering the question!)
 Drawing conclusions (answering the question!)")
13
Method selection Valid Analytical Measurement (VAM)
A result is fit for purpose when its uncertainty maximises its expected utility (cost, usually) reducing uncertainty generally increases the cost of analysis most users have tight budgets uncertainty in measurement should be as large as can be tolerated to keep costs down other factors can affect fitness for purpose sensitivity of technique sample throughput accuracy and precision that is obtainable sample type and preparation Valid Analytical Measurement (VAM) A result is fit for purpose when its uncertainty maximises its expected utility (cost, usually) reducing uncertainty generally increases the cost of analysis most users have tight budgets uncertainty in measurement should be as large as can be tolerated to keep costs down other factors can affect fitness for purpose sensitivity of technique sample throughput accuracy and precision that is obtainable sample type and preparation Ultimately, the results are fit for purpose if they meet the specific needs of the customer, the customer is confident in the results and they represent value for money. comparing techniques statistically Student's t test A t test can be used to decide if two sets of results are "the same" or to compare a set of results with a known value. You will have learnt the t test in your QS modules, please refresh your memory if you are unsure how to perform it. Worked examples Practice questions F test Is there a significant difference between the precision of two methods? i.e. are the standard deviations of the two methods significantly different? Worked Examples Categories: know basics
 reducing uncertainty generally increases the cost of analysis. most users have tight budgets. uncertainty in measurement should be as large as can be tolerated to keep costs down. other factors can affect fitness for purpose. sensitivity of technique. sample throughput. accuracy and precision that is obtainable. sample type and preparation. Valid Analytical Measurement (VAM) A result is fit for purpose when its uncertainty maximises its expected utility (cost, usually) reducing uncertainty generally increases the cost of analysis. most users have tight budgets. uncertainty in measurement should be as large as can be tolerated to keep costs down. other factors can affect fitness for purpose. sensitivity of technique. sample throughput. accuracy and precision that is obtainable. sample type and preparation. Ultimately, the results are fit for purpose if they meet the specific needs of the customer, the customer is confident in the results and they represent value for money. comparing techniques statistically. Student s t test. A t test can be used to decide if two sets of results are the same or to compare a set of results with a known value. You will have learnt the t test in your QS modules, please refresh your memory if you are unsure how to perform it. Worked examples. Practice questions. F test. Is there a significant difference between the precision of two methods i.e. are the standard deviations of the two methods significantly different Worked Examples. Categories: know basics.")
14
VAM, cont Ultimately, the results are fit for purpose if they meet the specific needs of the customer, the customer is confident in the results and they represent value for money.

15
Valid Analytical Measurement (VAM)
Goldmine A sampling and analysis game for Minitab can be found here Valid Analytical Measurement (VAM) A result is fit for purpose when its uncertainty maximises its expected utility (cost, usually) reducing uncertainty generally increases the cost of analysis most users have tight budgets uncertainty in measurement should be as large as can be tolerated to keep costs down other factors can affect fitness for purpose sensitivity of technique sample throughput accuracy and precision that is obtainable sample type and preparation Ultimately, the results are fit for purpose if they meet the specific needs of the customer, the customer is confident in the results and they represent value for money. Goldmine A sampling and analysis game for Minitab can be found at
 A result is fit for purpose when its uncertainty maximises its expected utility (cost, usually) reducing uncertainty generally increases the cost of analysis. most users have tight budgets. uncertainty in measurement should be as large as can be tolerated to keep costs down. other factors can affect fitness for purpose. sensitivity of technique. sample throughput. accuracy and precision that is obtainable. sample type and preparation. Ultimately, the results are fit for purpose if they meet the specific needs of the customer, the customer is confident in the results and they represent value for money. Goldmine. A sampling and analysis game for Minitab can be found at")
16
Comparing techniques statistically The F test and Student's t test
F test -Is there a significant difference between the precision of two methods? i.e. are the standard deviations of the two methods significantly different? Student’s t test - used to decide if two sets of results are "the same" or to compare a set of results with a known value. You will have learnt these tests in your QS modules, please refresh your memory if you are unsure how to perform it. You will be expected to be able to compare a set of results with a known value, compare two sets of matched results and compare two sets of unmatched results, please see me if you can not do this Further information and worked examples are available on the CH217 studentcentral website comparing techniques statistically Student's t test A t test can be used to decide if two sets of results are "the same" or to compare a set of results with a known value. You will have learnt the t test in your QS modules, please refresh your memory if you are unsure how to perform it. Worked examples Practice questions F test Is there a significant difference between the precision of two methods? i.e. are the standard deviations of the two methods significantly different? Worked Examples Categories: know basics

17
Samples - sampling strategy
Probably the most important stage in any analysis. If the sample taken is not representative of the original material everything you do next is worthless. sampling strategy Probably the most important stage in any analysis. If the sample taken is not representative of the original material everything you do next is worthless. Sample nomenclature: lot - quantity of material which is assumed to represent a single population for sampling purposes batch - quantity of material known (or assumed) to have been produced under uniform conditions increments - portions of material obtained using a sampling device from lot/batch primary/gross sample - combination of increments composite/aggregate sample - combination of primary samples laboratory sample - portion of material delivered to lab for analysis test (analytical) portion - material actually submitted for analysis Horowitz. Pure and Applied Chemistry, 1990, 62, Obtaining a representative sample: Usually the lot is not homogeneous but may be randomly heterogeneous (different compositions occur on a small scale and randomly) or segregated heterogeneous (large patches of different compositions) A representative sample will not reflect the composition of the target exactly but will be adequate enough to be 'fit for purpose'.There will always be a degree of uncertainty from sampling. n numbers How many replicate samples do we need to analyse? Often in biology you will come across n=6 for all analyses. so where does this come from? Confidence limits - met in QS modules Rearrange to make n the subject Use the acceptable error and confidence level to calculate n. Worked example
 to have been produced under uniform conditions. increments - portions of material obtained using a sampling device from lot/batch. primary/gross sample - combination of increments. composite/aggregate sample - combination of primary samples. laboratory sample - portion of material delivered to lab for analysis. test (analytical) portion - material actually submitted for analysis. Horowitz. Pure and Applied Chemistry, 1990, 62, Obtaining a representative sample: Usually the lot is not homogeneous but may be. randomly heterogeneous (different compositions occur on a small scale and randomly) or. segregated heterogeneous (large patches of different compositions) A representative sample will not reflect the composition of the target exactly but will be adequate enough to be fit for purpose .There will always be a degree of uncertainty from sampling. n numbers. How many replicate samples do we need to analyse Often in biology you will come across n=6 for all analyses. so where does this come from Confidence limits - met in QS modules. Rearrange to make n the subject. Use the acceptable error and confidence level to calculate n. Worked example.")
18
Sample nomenclature lot - quantity of material which is assumed to represent a single population for sampling purposes batch - quantity of material known (or assumed) to have been produced under uniform conditions increments - portions of material obtained using a sampling device from lot/batch primary/gross sample - combination of increments composite/aggregate sample - combination of primary samples laboratory sample - portion of material delivered to lab for analysis test (analytical) portion - material actually submitted for analysis
 to have been produced under uniform conditions. increments - portions of material obtained using a sampling device from lot/batch. primary/gross sample - combination of increments. composite/aggregate sample - combination of primary samples. laboratory sample - portion of material delivered to lab for analysis. test (analytical) portion - material actually submitted for analysis.")
19
Sampling - stages Horwitz. Pure and Applied Chemistry, 1990, 62,

20
Obtaining a representative sample
Usually the lot is not homogeneous but may be randomly heterogeneous (different compositions occur on a small scale and randomly) or segregated heterogeneous (large patches of different compositions) A representative sample will not reflect the composition of the target exactly but will be adequate enough to be 'fit for purpose'. There will always be a degree of uncertainty from sampling.
 or. segregated heterogeneous (large patches of different compositions) A representative sample will not reflect the composition of the target exactly but will be adequate enough to be fit for purpose . There will always be a degree of uncertainty from sampling.")
21
Sampling - n numbers How many replicate samples do we need to analyse?
Often in biology you will come across n=6 for all analyses. so where does this come from? Confidence limits - met in QS modules Rearrange to make n the subject Use the acceptable error and confidence level (to find t) to calculate n. n numbers How many replicate samples do we need to analyse? Often in biology you will come across n=6 for all analyses. so where does this come from? Confidence limits - met in QS modules Rearrange to make n the subject Use the acceptable error and confidence level to calculate n. Worked example
 to calculate n. n numbers. How many replicate samples do we need to analyse Often in biology you will come across n=6 for all analyses. so where does this come from Confidence limits - met in QS modules. Rearrange to make n the subject. Use the acceptable error and confidence level to calculate n. Worked example.")
22
Sampling - n numbers Worked Example
The concentration of lead in the bloodstream was measured for a sample of children from a large school near a busy main road. A preliminary sampling of 50 children gave a mean concentration of ng ml-1 and standard deviation of ng ml-1. How big does the sample need to be to give an error of less than ±0.1 ng ml-1 with 95% confidence? For 95% confidence t = 1.96 (n = ∞) So 160 children would need to be tested
 So 160 children would need to be tested.")
23
sample preparation Preparing samples for analysis
Depends on the form required for analysis Samples may require Moisture control Fusion Grinding Extraction Dissolving Preconcentration/dilution Ashing Derivatisation or a combination of several of these Instruments such as microwave ovens, sonicating baths, pressure vessels (digestion bombs) and extraction cartridges may also be used. Please see recommended reading for further details on these preparation techniques (ch28 Harris) sample preparation Preparing samples for analysis Depends on the form required for analysis Samples may require 1) Moisture control 2) Grinding 3) Dissolving 4) Ashing 5) Fusion 6) Extraction 7) Preconcentration/dilution 8) Derivatisation or a combination of several of these Instruments such as microwave ovens, sonicating baths, pressure vessels (digestion bombs) and extraction cartridges may also be used. Please see recommended reading for further details on these preparation techniques (ch28 Harris) Remember: The success of the analysis depends on minimising errors throughout all stages including sample preparation Every additional step must be carefully controlled and included in error calculations The greater the n the more confident we can be solid phase extraction Analyte is removed from sample by passing a solution over a solid. Analyte is adsorbed, or absorbed by the solid and the remaining liquid can be discarded Analyte is eluted by use of a stronger solvent (Harris ch28) SPE uses the principles of chromatographic separation - works on ion exchange, reverse phase and normal phase SPE can reduce solvent consumption SPE is now often used as an efficient alternative to liquid extraction - depends on availability of selective adsorbents cartridges are available commercially for many analyses often used to change the buffer or matrix that the analyte is held in
 and extraction cartridges may also be used. Please see recommended reading for further details on these preparation techniques (ch28 Harris) sample preparation. Preparing samples for analysis. Depends on the form required for analysis. Samples may require. 1) Moisture control. 2) Grinding. 3) Dissolving. 4) Ashing. 5) Fusion. 6) Extraction. 7) Preconcentration/dilution. 8) Derivatisation. or a combination of several of these. Instruments such as microwave ovens, sonicating baths, pressure vessels (digestion bombs) and extraction cartridges may also be used. Please see recommended reading for further details on these preparation techniques (ch28 Harris) Remember: The success of the analysis depends on minimising errors throughout all stages including sample preparation. Every additional step must be carefully controlled and included in error calculations. The greater the n the more confident we can be. solid phase extraction. Analyte is removed from sample by passing a solution over a solid. Analyte is adsorbed, or absorbed by the solid and the remaining liquid can be discarded. Analyte is eluted by use of a stronger solvent. (Harris ch28) SPE uses the principles of chromatographic separation - works on ion exchange, reverse phase and normal phase. SPE can reduce solvent consumption. SPE is now often used as an efficient alternative to liquid extraction - depends on availability of selective adsorbents. cartridges are available commercially for many analyses. often used to change the buffer or matrix that the analyte is held in.")
24
solid phase extraction
Analyte is removed from sample by passing a solution over a solid. Analyte is adsorbed, or absorbed by the solid and the remaining liquid can be discarded Analyte is eluted by use of a stronger solvent solid phase extraction Analyte is removed from sample by passing a solution over a solid. Analyte is adsorbed, or absorbed by the solid and the remaining liquid can be discarded Analyte is eluted by use of a stronger solvent (Harris ch28) SPE uses the principles of chromatographic separation - works on ion exchange, reverse phase and normal phase SPE can reduce solvent consumption SPE is now often used as an efficient alternative to liquid extraction - depends on availability of selective adsorbents cartridges are available commercially for many analyses often used to change the buffer or matrix that the analyte is held in
 SPE uses the principles of chromatographic separation - works on ion exchange, reverse phase and normal phase. SPE can reduce solvent consumption. SPE is now often used as an efficient alternative to liquid extraction - depends on availability of selective adsorbents. cartridges are available commercially for many analyses. often used to change the buffer or matrix that the analyte is held in.")
25
solid phase extraction

26
Sample storage To keep samples reflective we must prevent contamination & decomposition Problems & Solutions Dirty containers - ensure adequate washing; use disposable containers Type of Container - Avoid “ion-exchange” and adsorption of analyte Light - use brown/foil-covered bottles Air may oxidise sample - store under vacuum, or in a protective atmosphere Moisture - keep tightly sealed Evaporation - keep tightly sealed Heat/cold - store in fridge/temperature controlled room The measures chosen will depend on the analyte and its sample matrix storage Storing Samples To keep samples reflective we must prevent contamination decomposition Problems & Solutions 1) Dirty containers - ensure adequate washing; use disposable containers 2) Type of Container - Avoid “ion-exchange” and adsorption of analyte 3) Light - use brown/foil-covered bottles 4) Air may oxidise sample - store under vacuum, or in a protective atmosphere 5) Moisture - keep tightly sealed 6) Evaporation - keep tightly sealed 7) Heat/cold - store in fridge/temperature controlled room The measures chosen will depend on the analyte and its sample matrix
 Dirty containers - ensure adequate washing; use disposable containers. 2) Type of Container - Avoid ion-exchange and adsorption of analyte. 3) Light - use brown/foil-covered bottles. 4) Air may oxidise sample - store under vacuum, or in a protective atmosphere. 5) Moisture - keep tightly sealed. 6) Evaporation - keep tightly sealed. 7) Heat/cold - store in fridge/temperature controlled room. The measures chosen will depend on the analyte and its sample matrix.")
27
Calibration Analytical methods, particularly those using instruments, frequently require calibration procedures These are to establish: the response to known quantities of analyte (standards) within the range used the reliability/drift of the method limits beyond which detection/quantitation is unreliable Calibration normally involves: measurement of samples of known concentrations measurement of a relevant range of concentrations a range in which the response is linear graphical treatment of results modified calculation of errors Calibration Analytical methods, particularly those using instruments, frequently require calibration procedures the reliability/drift of the method the response to known quantities of analyte (standards) within the range used These are to establish: limits beyond which detection/quantitation is unreliable measurement of samples of known concentrations Calibration normally involves: measurement of a relevant range of concentrations modified calculation of errors graphical treatment of results a range in which the response is linear External Standard Prepare samples containing known quantities of analyte over a relevant range including blanks Simplest and most common form of calibration. Controls for sample preparation/matrix should be used, matched to the unknown samples Linear regression with least squares analysis is used to determine response (expressed as y = bx+a) Plot quantity/concentration of analyte vs. response Carry out and record measurements Repeat as and when appropriate (when it is likely that an unacceptable drift will have occurred) May only need one calibration plot (of 5-10 samples) for 10’s to 100’s of unknown samples Advantages Can be easily automated Simple statistics will provide estimates of uncertainty for the method Requires care to match conditions and matrix to that of the unknown samples Disadvantages Does not control for sudden changes in method performance You will have done this in more detail in BY131 You should be able to use linear regression to calculate the line of best fit and calulate the errors in the calibration line to calculate the concentration of the analyte and its error from this information (see sec 5.4, 5.5, 5.6 in Miller & Miller).The ability to do this is assumed in this module. know basics Categories: Internal Standard Useful for methods which are not very reproducible; e.g. Gas chromatography uses very small volumes (<1 ml) - difficult to measure accurately 1) The instrument responses to mixtures of known amounts of analyte and of a different compound (internal standard) are measured, and response factor determined 4) Response factor allows determination of analyte concentration 3) Signals from the analyte and from the internal standard are measured 2) A known amount of internal standard is added to the unknown sample. Controls for unexpected changes in method performance Can control for loss during sample preparation The two compounds (standard and analyte) must be quantifiable independently and have linear responses over a range of concentrations Requires suitable reference standard Must account for dilution steps in calculations Worked Example Standard addition Frequently used where matrix effects and interferents are prevalent e.g. atomic absorption/emission 2) “Spike” each sample with known, different amounts of standard (same analyte, including a range from 0 to ~5x expected unknown concentration) 1) Prepare samples containing equal volumes of unknown analyte concentration 3) Dilute all samples to the same volume 6) Linear regression with least squares analysis is used to determine response (expressed as y = bx+a) 5) Plot quantity/concentration of known analyte added vs. response 4) Carry out and record measurements 8) Repeat for each unknown sample 7) Concentration of unknown = - (x-intercept) = a/b Controls for matrix effects Must be careful to account for dilution steps in calculations May use more unknown sample than other methods Requires several measurements for each unknown
 within the range used. the reliability/drift of the method. limits beyond which detection/quantitation is unreliable. Calibration normally involves: measurement of samples of known concentrations. measurement of a relevant range of concentrations. a range in which the response is linear. graphical treatment of results. modified calculation of errors. Calibration. Analytical methods, particularly those using instruments, frequently require calibration procedures. the reliability/drift of the method. the response to known quantities of analyte (standards) within the range used. These are to establish: limits beyond which detection/quantitation is unreliable. measurement of samples of known concentrations. Calibration normally involves: measurement of a relevant range of concentrations. modified calculation of errors. graphical treatment of results. a range in which the response is linear. External Standard. Prepare samples containing known quantities of analyte over a relevant range including blanks. Simplest and most common form of calibration. Controls for sample preparation/matrix should be used, matched to the unknown samples. Linear regression with least squares analysis is used to determine response (expressed as y = bx+a) Plot quantity/concentration of analyte vs. response. Carry out and record measurements. Repeat as and when appropriate (when it is likely that an unacceptable drift will have occurred) May only need one calibration plot (of 5-10 samples) for 10’s to 100’s of unknown samples. Advantages. Can be easily automated. Simple statistics will provide estimates of uncertainty for the method. Requires care to match conditions and matrix to that of the unknown samples. Disadvantages. Does not control for sudden changes in method performance. You will have done this in more detail in BY131 You should be able to use linear regression to calculate the line of best fit and calulate the errors in the calibration line to calculate the concentration of the analyte and its error from this information (see sec 5.4, 5.5, 5.6 in Miller & Miller).The ability to do this is assumed in this module. know basics. Categories: Internal Standard. Useful for methods which are not very reproducible; e.g. Gas chromatography uses very small volumes (<1 ml) - difficult to measure accurately. 1) The instrument responses to mixtures of known amounts of analyte and of a different compound (internal standard) are measured, and response factor determined. 4) Response factor allows determination of analyte concentration. 3) Signals from the analyte and from the internal standard are measured. 2) A known amount of internal standard is added to the unknown sample. Controls for unexpected changes in method performance. Can control for loss during sample preparation. The two compounds (standard and analyte) must be quantifiable independently and have linear responses over a range of concentrations. Requires suitable reference standard. Must account for dilution steps in calculations. Worked Example. Standard addition. Frequently used where matrix effects and interferents are prevalent e.g. atomic absorption/emission. 2) Spike each sample with known, different amounts of standard (same analyte, including a range from 0 to ~5x expected unknown concentration) 1) Prepare samples containing equal volumes of unknown analyte concentration. 3) Dilute all samples to the same volume. 6) Linear regression with least squares analysis is used to determine response (expressed as y = bx+a) 5) Plot quantity/concentration of known analyte added vs. response. 4) Carry out and record measurements. 8) Repeat for each unknown sample. 7) Concentration of unknown = - (x-intercept) = a/b. Controls for matrix effects. Must be careful to account for dilution steps in calculations. May use more unknown sample than other methods. Requires several measurements for each unknown.")
28
External Standard Simplest and most common form of calibration.
Prepare samples containing known quantities of analyte over a relevant range including blanks Controls for sample preparation/matrix should be used, matched to the unknown samples Carry out and record measurements Plot quantity/concentration of analyte vs. response Linear regression with least squares analysis is used to determine response (expressed as y = bx+a) Repeat as and when appropriate (when it is likely that an unacceptable drift will have occurred) External Standard Simplest and most common form of calibration. Prepare samples containing known quantities of analyte over a relevant range including blanks Controls for sample preparation/matrix should be used, matched to the unknown samples Carry out and record measurements Plot quantity/concentration of analyte vs. response Linear regression with least squares analysis is used to determine response (expressed as y = bx+a) Repeat as and when appropriate (when it is likely that an unacceptable drift will have occurred) Advantages May only need one calibration plot (of 5-10 samples) for 10’s to 100’s of unknown samples Can be easily automated Simple statistics will provide estimates of uncertainty for the method Disadvantages Requires care to match conditions and matrix to that of the unknown samples Does not control for sudden changes in method performance You will have done this in more detail in BY131 You should be able to use linear regression to calculate the line of best fit and calulate the errors in the calibration line to calculate the concentration of the analyte and its error from this information (see sec 5.4, 5.5, 5.6 in Miller & Miller).The ability to do this is assumed in this module. Categories: know basics
 Repeat as and when appropriate (when it is likely that an unacceptable drift will have occurred) External Standard. Simplest and most common form of calibration. Prepare samples containing known quantities of analyte over a relevant range including blanks. Controls for sample preparation/matrix should be used, matched to the unknown samples. Carry out and record measurements. Plot quantity/concentration of analyte vs. response. Linear regression with least squares analysis is used to determine response (expressed as y = bx+a) Repeat as and when appropriate (when it is likely that an unacceptable drift will have occurred) Advantages. May only need one calibration plot (of 5-10 samples) for 10’s to 100’s of unknown samples. Can be easily automated. Simple statistics will provide estimates of uncertainty for the method. Disadvantages. Requires care to match conditions and matrix to that of the unknown samples. Does not control for sudden changes in method performance. You will have done this in more detail in BY131 You should be able to use linear regression to calculate the line of best fit and calulate the errors in the calibration line to calculate the concentration of the analyte and its error from this information (see sec 5.4, 5.5, 5.6 in Miller & Miller).The ability to do this is assumed in this module. Categories: know basics.")
29
External Standard Advantages
May only need one calibration plot (of 5-10 samples) for 10’s to 100’s of unknown samples Can be easily automated Simple statistics will provide estimates of uncertainty for the method Disadvantages Requires care to match conditions and matrix to that of the unknown samples Does not control for sudden changes in method performance
 for 10’s to 100’s of unknown samples. Can be easily automated. Simple statistics will provide estimates of uncertainty for the method. Disadvantages. Requires care to match conditions and matrix to that of the unknown samples. Does not control for sudden changes in method performance.")
30
External standard You will have done this in more detail in BY131
You should be able to use linear regression to calculate the line of best fit and the errors in the calibration line to calculate the concentration of the analyte and its error from this information (see sec 5.4, 5.5, 5.6 in Miller & Miller) The ability to do this is assumed in this module.
 The ability to do this is assumed in this module.")
31
Internal Standard Useful for methods which are not very reproducible; e.g. Gas chromatography uses very small volumes (<1 ml) - difficult to measure accurately The instrument responses to mixtures of known amounts of analyte and of a different compound (internal standard) are measured, and response factor determined A known amount of internal standard is added to the unknown sample. Signals from the analyte and from the internal standard are measured Response factor allows determination of analyte concentration Internal Standard Useful for methods which are not very reproducible; e.g. Gas chromatography uses very small volumes (<1 ml) - difficult to measure accurately 1) The instrument responses to mixtures of known amounts of analyte and of a different compound (internal standard) are measured, and response factor determined 2) A known amount of internal standard is added to the unknown sample. 3) Signals from the analyte and from the internal standard are measured 4) Response factor allows determination of analyte concentration Advantages Can control for loss during sample preparation Controls for unexpected changes in method performance Disadvantages Requires suitable reference standard The two compounds (standard and analyte) must be quantifiable independently and have linear responses over a range of concentrations Must account for dilution steps in calculations Worked Example
 - difficult to measure accurately. The instrument responses to mixtures of known amounts of analyte and of a different compound (internal standard) are measured, and response factor determined. A known amount of internal standard is added to the unknown sample. Signals from the analyte and from the internal standard are measured. Response factor allows determination of analyte concentration. Internal Standard. Useful for methods which are not very reproducible; e.g. Gas chromatography uses very small volumes (<1 ml) - difficult to measure accurately. 1) The instrument responses to mixtures of known amounts of analyte and of a different compound (internal standard) are measured, and response factor determined. 2) A known amount of internal standard is added to the unknown sample. 3) Signals from the analyte and from the internal standard are measured. 4) Response factor allows determination of analyte concentration. Advantages. Can control for loss during sample preparation. Controls for unexpected changes in method performance. Disadvantages. Requires suitable reference standard. The two compounds (standard and analyte) must be quantifiable independently and have linear responses over a range of concentrations. Must account for dilution steps in calculations. Worked Example.")
32
Internal Standard Advantages
Can control for loss during sample preparation Controls for unexpected changes in method performance Disadvantages Requires suitable reference standard The two compounds (standard and analyte) must be quantifiable independently and have linear responses over a range of concentrations Must account for dilution steps in calculations
 must be quantifiable independently and have linear responses over a range of concentrations. Must account for dilution steps in calculations.")
33
Internal Standard-Worked Example
Measurement of caffeine concentration by HPLC, using theophyline as an internal standard. Standard solutions containing a range of known amounts of both caffeine and theophyline are prepared. These are subjected to HPLC and the relative instrument response (area under each peak) is determined, and response factor determined. Absorbance Caffeine Theophyline solution caffeine Theophyline Conc./mg.l-1 Peak area A 1 20000 50000 B 2 38400 48000 c 4 89600 56000
 is determined, and response factor determined. Absorbance. Caffeine Theophyline. solution. caffeine. Theophyline. Conc./mg.l-1. Peak area. A B c")
34
Internal Standard-Worked Example
Response Factor In reality there would be some variation and multiple calibration samples would be used to determine precision of response factor A 10ml of a 1mg.L-1 internal standard is added to 10ml of an unknown sample . Instrument signals measured: Analyte: 30,000, Internal Standard: 27,000

35
Internal Standard-Worked Example
Response factor allows determination of analyte concentration in sample: Original concentration = 1.39 x 20/10 = 2.78mg.L-1

36
Standard addition Frequently used where matrix effects and interferents are prevalent e.g. atomic absorption/emission Prepare samples containing equal volumes of unknown analyte concentration “Spike” each sample with known, different amounts of standard (same analyte, including a range from 0 to ~5x expected unknown concentration) Dilute all samples to the same volume Carry out and record measurements Plot quantity/concentration of known analyte added vs.. response Linear regression with least squares analysis is used to determine response (expressed as y = bx+a) Concentration of unknown = - (x-intercept) = a/b Repeat for each unknown sample Standard addition Frequently used where matrix effects and interferents are prevalent e.g. atomic absorption/emission 1) Prepare samples containing equal volumes of unknown analyte concentration 2) “Spike” each sample with known, different amounts of standard (same analyte, including a range from 0 to ~5x expected unknown concentration) 3) Dilute all samples to the same volume 4) Carry out and record measurements 5) Plot quantity/concentration of known analyte added vs. response 6) Linear regression with least squares analysis is used to determine response (expressed as y = bx+a) 7) Concentration of unknown = - (x-intercept) = a/b 8) Repeat for each unknown sample Advantages Controls for matrix effects Controls for unexpected changes in method performance Disadvantages Requires several measurements for each unknown May use more unknown sample than other methods Must be careful to account for dilution steps in calculations Worked Example
 Dilute all samples to the same volume. Carry out and record measurements. Plot quantity/concentration of known analyte added vs.. response. Linear regression with least squares analysis is used to determine response (expressed as y = bx+a) Concentration of unknown = - (x-intercept) = a/b. Repeat for each unknown sample. Standard addition. Frequently used where matrix effects and interferents are prevalent e.g. atomic absorption/emission. 1) Prepare samples containing equal volumes of unknown analyte concentration. 2) Spike each sample with known, different amounts of standard (same analyte, including a range from 0 to ~5x expected unknown concentration) 3) Dilute all samples to the same volume. 4) Carry out and record measurements. 5) Plot quantity/concentration of known analyte added vs. response. 6) Linear regression with least squares analysis is used to determine response (expressed as y = bx+a) 7) Concentration of unknown = - (x-intercept) = a/b. 8) Repeat for each unknown sample. Advantages. Controls for matrix effects. Controls for unexpected changes in method performance. Disadvantages. Requires several measurements for each unknown. May use more unknown sample than other methods. Must be careful to account for dilution steps in calculations. Worked Example.")
37
Standard addition Advantages Controls for matrix effects
Controls for unexpected changes in method performance Disadvantages Requires several measurements for each unknown May use more unknown sample than other methods Must be careful to account for dilution steps in calculations

38
Standard addition - Worked Example Measurement of Copper concentration by atomic absorption spectrometry Five 10ml solutions of unknown (approx. 2mg.L-1) copper concentration were prepared and to these was added: 0, 2, 4, 6 and 8 cm3 of 10mg.L-1 standard analyte solution in water (one volume to each flask). All samples diluted to 25cm3 with water and mixed well. The solutions were then measured using AAS and the results recorded Solution Added volume/ cm3 Absorbance 1 0.150 2 0.312 3 4 0.446 6 0.580 5 8 0.762
 copper concentration were prepared and to these was added: 0, 2, 4, 6 and 8 cm3 of 10mg.L-1 standard analyte solution in water (one volume to each flask). All samples diluted to 25cm3 with water and mixed well. The solutions were then measured using AAS and the results recorded. Solution. Added volume/ cm3. Absorbance")
39
Calculate concentration of copper added to solution, using c1V1 = c2V2
i.e. 2 cm3 added: 10 x 2/1000 = c2 x 25/1000 c2 = 0.8 mg.L-1 etc Plot quantity/concentration of known analyte added vs. response, and plot line using linear regression with least square analysis (expressed as y = bx+a) Solution Added volume/ cm3 Absorbance Added concentration/ mg.l-1 1 0.150 2 0.312 0.8 3 4 0.446 1.6 6 0.580 2.4 5 8 0.762 3.2
 Solution. Added volume/ cm3. Absorbance. Added concentration/ mg.l")
40
Conc. of unknown in samples = - (x-intercept) = a/b
= 0.813mg.L-1 NB: 10cm3 aliquots of the original solution were diluted to 25cm3 in the samples, so concentration of original solution = x 25/10 = ~ 2.03mg.L-1

41
validation Standards Performance parameters Errors in Analysis
Record Keeping standards The results from any analytical measurement depends upon and is traceable to the measurement standards used in the process. These include standards for mass, volume and amount of a chemical species. Equipment is usually periodically calibrated using standards that can be traced back to an International Primary Standard. Example: An analytical balance will be calibrated periodically using calibrated weights. These weights are regularly checked against a set of weights held at a reference laboratory. The reference laboratory's weights will be checked periodically against the national standard kilogram (held at the National Physical Laboratory, NPL). This national standard kilogram is occasionally compared to the international standard kilogram. Each stage introduces a measurement uncertainty which has to be taken into account. This means that the standards used in a laboratory will always have a greater uncertainty associated with them than those from the reference laboratories. The UK National Standard Kilogram - a cylinder of platinum-iridium alloy and numbered '18' - is kept in a basement vault at NPL. It is stored in an air-tight enclosure, only exposed to the air via two micropore filters. Conditions in the basement are very stable - although not temperature controlled - with the temperature remaining in the range 19 °C ±1 °C throughout the year. While the temperature in the vault is monitored, the storage temperature of the kilogram is not critical provided it remains within a few degrees of 19 °C. If is gets too cold condensation may form on the surface - resulting in physisorption of water into the surface layers. If it gets too hot the rate of surface contamination and adsorption of hydrocarbons from the surrounding air may increase. Where and how is the UK's National Standard Kilogram stored? (FAQ - Mass & Density) From Standard solutions can be used to help with calibration and to compare results against to establish the accuracy of a technique. High purity Primary standards should meet the following requirements: Primary standards are highly purified compounds that are used, directly or indirectly, to establish the concentration of standard solutions. Stability toward air Reasonable solubility in titration medium Ready availability at reasonable cost Absence of hydrate water so composition does not change with variations in humidity Reasonably large molar mass so that relative error associated with weighing the standard is minimised often a less pure compound has to be used: There are few compounds that meet these criteria. So secondary standard React rapidly with the analyte Be sufficiently stable that its concentration needs to be determined only once The ideal standard solution should: Undergo selective reaction with simple balanced equation React more or less completely with the analyte for good end points Few reagents meet all of these requirements Certified Reference Materials (CRM) - specially prepared samples containing an analyte at a pre-determined concentration . hey are often used to analyse the performance of a method or laboratory and are used as part of a quality control procedure. Performance parameters Precision – measure of agreement between observed values obtained by repeated application of the same analytical procedure Accuracy – measure of agreement between a single analytical result and the true value Selectivity – measure of the discriminating power of an analytical procedure in differentiating between the analyte and other components in the test sample Limit of Quantitation – minimum content of the analyte that can be quantitatively determined with reasonable statistical confidence. Equivalent to 6 time the sd of the blank sample Limit of detection – calculated amount of analyte in the sample which corresponds to 3 times the sd of the blank sample Sensitivity – the change of the measured signal as a result of one unit change in the content of the analyte (calculated from the calibration line) Linearity – a measure of the linearity of the calibration Standard deviation and relative standard deviation (RSD) – measures of the spread in the observed values as a result of random errors Ruggedness – insensibility of the method for variations during execution Range – concentration range to which the technique is applicable Between-lab reproducibility - expected maximum difference between two results obtained by repeated application of the analytical procedure to an identical test sample in different laboratories (e.g. different operators, different instrumentation in different labs on different days using same method Within-lab reproducibility – expected maximum difference between two results obtained by repeated application of the analytical procedure to an identical test sample under different conditions (e.g. different operator, different days) but in the same laboratory Repeatability – expected maximum difference between two results of identical test samples obtained under identical conditions Errors in Analysis The key to any successful analysis is ensuring that it will “answer the question” No analysis can be absolutely error-free All analyses must be designed to produce acceptable levels of errors and uncertainty (Miller and Miller Chapters 1-3, Harris Chapters 3 & 4) Even the simplest analytical experiment is likely to have more than ten stages, each of which may introduce errors The best way to minimise errors is by careful experimental design Record Keeping Ensure results are recorded in a laboratory notebook even if they are available electronically. Enough information should be included to ensure a colleague can repeat the experiment using only your notes. It is also a good idea to keep a copy of the notebook (preferably in a separate location). Many employers have their own prescribed methods for laboratory record keeping and usually require that each page is signed and dated by both the employee and their line manager. This is useful when it comes to intellectual property rights. title and date In general for each experiment include: objectives method hazard assessment, if necessary reaction scheme, if applicable conclusion results and calculations, including any instrument readouts and graphs
. This national standard kilogram is occasionally compared to the international standard kilogram. Each stage introduces a measurement uncertainty which has to be taken into account. This means that the standards used in a laboratory will always have a greater uncertainty associated with them than those from the reference laboratories. The UK National Standard Kilogram - a cylinder of platinum-iridium alloy and numbered 18 - is kept in a basement vault at NPL. It is stored in an air-tight enclosure, only exposed to the air via two micropore filters. Conditions in the basement are very stable - although not temperature controlled - with the temperature remaining in the range 19 °C ±1 °C throughout the year. While the temperature in the vault is monitored, the storage temperature of the kilogram is not critical provided it remains within a few degrees of 19 °C. If is gets too cold condensation may form on the surface - resulting in physisorption of water into the surface layers. If it gets too hot the rate of surface contamination and adsorption of hydrocarbons from the surrounding air may increase. Where and how is the UK s National Standard Kilogram stored (FAQ - Mass & Density) From Standard solutions can be used to help with calibration and to compare results against to establish the accuracy of a technique. High purity. Primary standards should meet the following requirements: Primary standards are highly purified compounds that are used, directly or indirectly, to establish the concentration of standard solutions. Stability toward air. Reasonable solubility in titration medium. Ready availability at reasonable cost. Absence of hydrate water so composition does not change with variations in humidity. Reasonably large molar mass so that relative error associated with weighing the standard is minimised. often a less pure compound has to be used: There are few compounds that meet these criteria. So. secondary standard. React rapidly with the analyte. Be sufficiently stable that its concentration needs to be determined only once. The ideal standard solution should: Undergo selective reaction with simple balanced equation. React more or less completely with the analyte for good end points. Few reagents meet all of these requirements. Certified Reference Materials (CRM) - specially prepared samples containing an analyte at a pre-determined concentration . hey are often used to analyse the performance of a method or laboratory and are used as part of a quality control procedure. Performance parameters. Precision – measure of agreement between observed values obtained by repeated application of the same analytical procedure. Accuracy – measure of agreement between a single analytical result and the true value. Selectivity – measure of the discriminating power of an analytical procedure in differentiating between the analyte and other components in the test sample. Limit of Quantitation – minimum content of the analyte that can be quantitatively determined with reasonable statistical confidence. Equivalent to 6 time the sd of the blank sample. Limit of detection – calculated amount of analyte in the sample which corresponds to 3 times the sd of the blank sample. Sensitivity – the change of the measured signal as a result of one unit change in the content of the analyte (calculated from the calibration line) Linearity – a measure of the linearity of the calibration. Standard deviation and relative standard deviation (RSD) – measures of the spread in the observed values as a result of random errors. Ruggedness – insensibility of the method for variations during execution. Range – concentration range to which the technique is applicable. Between-lab reproducibility - expected maximum difference between two results obtained by repeated application of the analytical procedure to an identical test sample in different laboratories (e.g. different operators, different instrumentation in different labs on different days using same method. Within-lab reproducibility – expected maximum difference between two results obtained by repeated application of the analytical procedure to an identical test sample under different conditions (e.g. different operator, different days) but in the same laboratory. Repeatability – expected maximum difference between two results of identical test samples obtained under identical conditions. Errors in Analysis. The key to any successful analysis is ensuring that it will answer the question No analysis can be absolutely error-free. All analyses must be designed to produce acceptable levels of errors and uncertainty. (Miller and Miller Chapters 1-3, Harris Chapters 3 & 4) Even the simplest analytical experiment is likely to have more than ten stages, each of which may introduce errors. The best way to minimise errors is by careful experimental design. Record Keeping. Ensure results are recorded in a laboratory notebook even if they are available electronically. Enough information should be included to ensure a colleague can repeat the experiment using only your notes. It is also a good idea to keep a copy of the notebook (preferably in a separate location). Many employers have their own prescribed methods for laboratory record keeping and usually require that each page is signed and dated by both the employee and their line manager. This is useful when it comes to intellectual property rights. title and date. In general for each experiment include: objectives. method. hazard assessment, if necessary. reaction scheme, if applicable. conclusion. results and calculations, including any instrument readouts and graphs.")
42
“How long is a piece of string?”
The results from any analytical measurement depends upon and is traceable to the measurement standards used in the process. These include standards for mass, volume and amount of a chemical species. Equipment is usually periodically calibrated using standards that can be traced back to an International Primary Standard. standards The results from any analytical measurement depends upon and is traceable to the measurement standards used in the process. These include standards for mass, volume and amount of a chemical species. Equipment is usually periodically calibrated using standards that can be traced back to an International Primary Standard. Example: An analytical balance will be calibrated periodically using calibrated weights. These weights are regularly checked against a set of weights held at a reference laboratory. The reference laboratory's weights will be checked periodically against the national standard kilogram (held at the National Physical Laboratory, NPL). This national standard kilogram is occasionally compared to the international standard kilogram. Each stage introduces a measurement uncertainty which has to be taken into account. This means that the standards used in a laboratory will always have a greater uncertainty associated with them than those from the reference laboratories. From Where and how is the UK's National Standard Kilogram stored? (FAQ - Mass & Density) The UK National Standard Kilogram - a cylinder of platinum-iridium alloy and numbered '18' - is kept in a basement vault at NPL. It is stored in an air-tight enclosure, only exposed to the air via two micropore filters. Conditions in the basement are very stable - although not temperature controlled - with the temperature remaining in the range 19 °C ±1 °C throughout the year. While the temperature in the vault is monitored, the storage temperature of the kilogram is not critical provided it remains within a few degrees of 19 °C. If is gets too cold condensation may form on the surface - resulting in physisorption of water into the surface layers. If it gets too hot the rate of surface contamination and adsorption of hydrocarbons from the surrounding air may increase. Standard solutions can be used to help with calibration and to compare results against to establish the accuracy of a technique. Primary standards are highly purified compounds that are used, directly or indirectly, to establish the concentration of standard solutions. Primary standards should meet the following requirements: High purity Stability toward air Absence of hydrate water so composition does not change with variations in humidity Ready availability at reasonable cost Reasonable solubility in titration medium Reasonably large molar mass so that relative error associated with weighing the standard is minimised There are few compounds that meet these criteria. So often a less pure compound has to be used: secondary standard The ideal standard solution should: Be sufficiently stable that its concentration needs to be determined only once React rapidly with the analyte React more or less completely with the analyte for good end points Undergo selective reaction with simple balanced equation Few reagents meet all of these requirements Certified Reference Materials (CRM) - specially prepared samples containing an analyte at a pre-determined concentration . hey are often used to analyse the performance of a method or laboratory and are used as part of a quality control procedure.
. This national standard kilogram is occasionally compared to the international standard kilogram. Each stage introduces a measurement uncertainty which has to be taken into account. This means that the standards used in a laboratory will always have a greater uncertainty associated with them than those from the reference laboratories. From Where and how is the UK s National Standard Kilogram stored (FAQ - Mass & Density) The UK National Standard Kilogram - a cylinder of platinum-iridium alloy and numbered 18 - is kept in a basement vault at NPL. It is stored in an air-tight enclosure, only exposed to the air via two micropore filters. Conditions in the basement are very stable - although not temperature controlled - with the temperature remaining in the range 19 °C ±1 °C throughout the year. While the temperature in the vault is monitored, the storage temperature of the kilogram is not critical provided it remains within a few degrees of 19 °C. If is gets too cold condensation may form on the surface - resulting in physisorption of water into the surface layers. If it gets too hot the rate of surface contamination and adsorption of hydrocarbons from the surrounding air may increase. Standard solutions can be used to help with calibration and to compare results against to establish the accuracy of a technique. Primary standards are highly purified compounds that are used, directly or indirectly, to establish the concentration of standard solutions. Primary standards should meet the following requirements: High purity. Stability toward air. Absence of hydrate water so composition does not change with variations in humidity. Ready availability at reasonable cost. Reasonable solubility in titration medium. Reasonably large molar mass so that relative error associated with weighing the standard is minimised. There are few compounds that meet these criteria. So. often a less pure compound has to be used: secondary standard. The ideal standard solution should: Be sufficiently stable that its concentration needs to be determined only once. React rapidly with the analyte. React more or less completely with the analyte for good end points. Undergo selective reaction with simple balanced equation. Few reagents meet all of these requirements. Certified Reference Materials (CRM) - specially prepared samples containing an analyte at a pre-determined concentration . hey are often used to analyse the performance of a method or laboratory and are used as part of a quality control procedure.")
43
Example An analytical balance will be calibrated periodically using calibrated weights. These weights are regularly checked against a set of weights held at a reference laboratory. The reference laboratory's weights will be checked periodically against the national standard kilogram (held at the National Physical Laboratory, NPL). This national standard kilogram is occasionally compared to the international standard kilogram. Each stage introduces a measurement uncertainty which has to be taken into account. This means that the standards used in a laboratory will always have a greater uncertainty associated with them than those from the reference laboratories.
. This national standard kilogram is occasionally compared to the international standard kilogram. Each stage introduces a measurement uncertainty which has to be taken into account. This means that the standards used in a laboratory will always have a greater uncertainty associated with them than those from the reference laboratories.")
44
Standard solutions Standard solutions can be used to help with calibration and to compare results against to establish the accuracy of a technique. The two main grades of standard are: Primary Secondary Certified Reference Materials (CRM) - specially prepared samples containing an analyte at a pre-determined concentration .
 - specially prepared samples containing an analyte at a pre-determined concentration .")
45
Primary standards Primary standards are highly purified compounds that are used, directly or indirectly, to establish the concentration of standard solutions. Primary standards should meet the following requirements: High purity Stability toward air Absence of hydrate water so composition does not change with variations in humidity Ready availability at reasonable cost Reasonable solubility in titration medium Reasonably large molar mass so that relative error associated with weighing the standard is minimised

46
Secondary standards There are few compounds that meet these criteria. So often a less pure compound has to be used: secondary standard The ideal standard solution should: Be sufficiently stable that its concentration needs to be determined only once React rapidly with the analyte React more or less completely with the analyte for good end points Undergo selective reaction with simple balanced equation Few reagents meet all of these requirements

47
Performance parameters
Accuracy – measure of agreement between a single analytical result and the true value Precision – measure of agreement between observed values obtained by repeated application of the same analytical procedure Selectivity – measure of the discriminating power of an analytical procedure in differentiating between the analyte and other components in the test sample Sensitivity – the change of the measured signal as a result of one unit change in the content of the analyte (calculated from the calibration line) Limit of Detection – calculated amount of analyte in the sample which corresponds to 3 times the sd of the blank sample Limit of Quantitation – minimum content of the analyte that can be quantitatively determined with reasonable statistical confidence. Equivalent to 6 time the sd of the blank sample Performance parameters Accuracy – measure of agreement between a single analytical result and the true value Precision – measure of agreement between observed values obtained by repeated application of the same analytical procedure Selectivity – measure of the discriminating power of an analytical procedure in differentiating between the analyte and other components in the test sample Sensitivity – the change of the measured signal as a result of one unit change in the content of the analyte (calculated from the calibration line) Limit of detection – calculated amount of analyte in the sample which corresponds to 3 times the sd of the blank sample Limit of Quantitation – minimum content of the analyte that can be quantitatively determined with reasonable statistical confidence. Equivalent to 6 time the sd of the blank sample Linearity – a measure of the linearity of the calibration Range – concentration range to which the technique is applicable Ruggedness – insensibility of the method for variations during execution Standard deviation and relative standard deviation (RSD) – measures of the spread in the observed values as a result of random errors Repeatability – expected maximum difference between two results of identical test samples obtained under identical conditions Within-lab reproducibility – expected maximum difference between two results obtained by repeated application of the analytical procedure to an identical test sample under different conditions (e.g. different operator, different days) but in the same laboratory Between-lab reproducibility - expected maximum difference between two results obtained by repeated application of the analytical procedure to an identical test sample in different laboratories (e.g. different operators, different instrumentation in different labs on different days using same method
 Limit of Detection – calculated amount of analyte in the sample which corresponds to 3 times the sd of the blank sample. Limit of Quantitation – minimum content of the analyte that can be quantitatively determined with reasonable statistical confidence. Equivalent to 6 time the sd of the blank sample. Performance parameters. Accuracy – measure of agreement between a single analytical result and the true value. Precision – measure of agreement between observed values obtained by repeated application of the same analytical procedure. Selectivity – measure of the discriminating power of an analytical procedure in differentiating between the analyte and other components in the test sample. Sensitivity – the change of the measured signal as a result of one unit change in the content of the analyte (calculated from the calibration line) Limit of detection – calculated amount of analyte in the sample which corresponds to 3 times the sd of the blank sample. Limit of Quantitation – minimum content of the analyte that can be quantitatively determined with reasonable statistical confidence. Equivalent to 6 time the sd of the blank sample. Linearity – a measure of the linearity of the calibration. Range – concentration range to which the technique is applicable. Ruggedness – insensibility of the method for variations during execution. Standard deviation and relative standard deviation (RSD) – measures of the spread in the observed values as a result of random errors. Repeatability – expected maximum difference between two results of identical test samples obtained under identical conditions. Within-lab reproducibility – expected maximum difference between two results obtained by repeated application of the analytical procedure to an identical test sample under different conditions (e.g. different operator, different days) but in the same laboratory. Between-lab reproducibility - expected maximum difference between two results obtained by repeated application of the analytical procedure to an identical test sample in different laboratories (e.g. different operators, different instrumentation in different labs on different days using same method.")
48
Linearity – a measure of the linearity of the calibration
Range – concentration range to which the technique is applicable Ruggedness – insensibility of the method for variations during execution Standard deviation and relative standard deviation (RSD) – measures of the spread in the observed values as a result of random errors Repeatability – expected maximum difference between two results of identical test samples obtained under identical conditions Within-lab reproducibility – expected maximum difference between two results obtained by repeated application of the analytical procedure to an identical test sample under different conditions (e.g. different operator, different days) but in the same laboratory Between-lab reproducibility - expected maximum difference between two results obtained by repeated application of the analytical procedure to an identical test sample in different laboratories (e.g. different operators, different instrumentation in different labs on different days using same method
 – measures of the spread in the observed values as a result of random errors. Repeatability – expected maximum difference between two results of identical test samples obtained under identical conditions. Within-lab reproducibility – expected maximum difference between two results obtained by repeated application of the analytical procedure to an identical test sample under different conditions (e.g. different operator, different days) but in the same laboratory. Between-lab reproducibility - expected maximum difference between two results obtained by repeated application of the analytical procedure to an identical test sample in different laboratories (e.g. different operators, different instrumentation in different labs on different days using same method.")
49
Errors in Analysis The key to any successful analysis is ensuring that it will “answer the question” No analysis can be absolutely error-free All analyses must be designed to produce acceptable levels of errors and uncertainty The best way to minimise errors is by careful experimental design Errors in Analysis The key to any successful analysis is ensuring that it will “answer the question” No analysis can be absolutely error-free All analyses must be designed to produce acceptable levels of errors and uncertainty (Miller and Miller Chapters 1-3, Harris Chapters 3 & 4) Even the simplest analytical experiment is likely to have more than ten stages, each of which may introduce errors The best way to minimise errors is by careful experimental design types of error Three main types of error e.g. dropping a key sample, instrumental breakdown Gross: So serious the experiment must be abandoned Random: When an experiment is repeated as exactly as possible, the replicate results will differ due to random errors. Estimates of random errors gives the precision or reproducibility of the analysis. Systematic: An experimental method gives a reproducible under- or overestimate of the real result. Total of all systematic errors gives the bias of an analysis. May be personal, instrumental or methodological Typical sources of error Random b) Weight - sensitivity of the balance a) Volume - not reading the burette reproducibly a) Volume Systematic incomplete drainage of pipette/burette ”indicator errors” glassware not exact lab temperature air buoyancy effect vessel at different temperature to balance b) Weight Both Interfering species Incomplete reaction, decomposition or moisture absorbance of sample/analyte Incomplete transference between vessels With good tools and careful measurement, traditional methods (gravimetry, titrimetry) are generally more accurate than instrumental method. Error Avoidance After considering each stage of the process, employ: Random Errors sufficient repeated measurements (replicates) (see also later notes for estimating required replicates) a more accurate balance improved technique (e.g. reading burette volumes) a different scale (g are easier to weigh than mg) temperature controls replicates in different glassware Systematic errors difference weighing a different/additional method purified reagents “reference standards” and “blank” measurements interlaboratory trials Systematic errors are not always obvious - but the methods above can often be used to detect them! Categories: know basics accuracy & precision Uncertainty A measure of both precision and accuracy, i.e. is an indicator of overall errors associated with the method. May be quoted using s, RSD or CI (should state which) Size of the uncertainty dictates how many significant figures to quote (see next page) Analytical results are quoted as a mean ± uncertainty s and RSD should be quoted with the relevant n Calculating uncertainty Problem: This can be very complex, and it is difficult to include systematic errors Combine all known errors (e.g. weighing, glassware, reagent purity) to give an estimate of uncertainty 1) Bottom-up method Conduct multiple replicates of the experiment, varying as many conditions that cause bias as possible - operator, reagent source, glassware etc. - then mathematically estimate the uncertainty. 2) Top-down method Often quoted as a indicators of uncertainty Measures of Spread Range: Difference between highest and lowest values Standard Deviation (s): A good measure of precision. A small s means that the data is more precise than data with a large s - but not necessarily more accurate Variance (s2): The square of the standard deviation Coefficient of Variation (CV) OR Relative Standard Deviation (RSD): A relative error estimate expressed as a % of the mean of the measurements. Used to compare the precision of methods with different units/ranges. Confidence interval (CI): A range which has a high statistical likelihood (e.g.95%) of containing the true value (see later) significant figures You should have covered this in more detail in BY131 (also see Harris ) Don’t just write down all the digits your calculator gives you! Quote the minimum number of digits needed to write a value in scientific notation without loss of accuracy e.g.9.34 (±0.02) x 102 not 93400, and not ±0.02 Rules The last digit will always have uncertainty associated with it (unless the data is discrete) Generally only the last digit should have uncertainty associated with it Zeros at the end of a number imply you know the value ends in 0 (4.56 is not the same as 4.560) Use literature examples and common sense if you are unsure! If you are worried about loss of information you may put an extra digit as a subscript (e.g ) Calculations should be carried out without rounding - only round up the answer propagation of errors Propagation of Uncertainty (Harris Ch.3-5) “bottom up” estimation of uncertainty Necessary to calculate combined errors for: estimating uncertainty for results based on two or more values each with its own uncertainty e.g. For data reported as ratios - we cannot simply add the errors - sometimes they will cancel each other out Value = (sample result (±error) : control result (±error)) How do we combine uncertainties? e.g. x = (a/b) + c combine one stage at a time can use simple formulae to combine uncertainties 2) Combine the result with c to get uncertainty in x 1) Combine a and b uncertainty, then NOTE: The methods described here are only used for random errors, and assume that systematic errors have been identified and eliminated limit of detection & limit of quantitation The concentration which gives an instrument signal (y) significantly different from the blank (or background) signal Limit of Detection (LOD) This is generally calculated as: Concentration x which gives rise to a signal of yB + 3sB where yB and sB are the mean and s.d. of blank solutions NB the method used may vary according to the purpose of the analysis - so it should always be quoted The concentration above which precise quantitative measurement is possible Limit of Quantitation (LOQ) Concentration x which gives rise to a signal of yB + 10sB This calculation is often conducted in different ways - again the method used should always be quoted Measuring LOD/LOQ 1) Practically Perform the analysis on matched solutions containing no analyte BUT this can be very time- and reagent- consuming Calculate the mean (yB) and standard deviation (sB) of the signals/measurements obtained 2) Mathematically This is more accurate than using the single blank value included as part of the calibration process, and eliminates the need for repetition Use sy/x as an estimate of sB Use the calculated value of the intercept (a) as an estimate of yB Sensitivity vs. Detectivity Sensitivity is a measure of instrument response to changes in concentration across the entire linear range and is only dependent on the slope of the plot LOD and LOQ are measures of detectivity and are dependent on both the slope and the intercept of the calibration plot
 Even the simplest analytical experiment is likely to have more than ten stages, each of which may introduce errors. The best way to minimise errors is by careful experimental design. types of error. Three main types of error. e.g. dropping a key sample, instrumental breakdown. Gross: So serious the experiment must be abandoned. Random: When an experiment is repeated as exactly as possible, the replicate results will differ due to random errors. Estimates of random errors gives the precision or reproducibility of the analysis. Systematic: An experimental method gives a reproducible under- or overestimate of the real result. Total of all systematic errors gives the bias of an analysis. May be personal, instrumental or methodological. Typical sources of error. Random. b) Weight - sensitivity of the balance. a) Volume - not reading the burette reproducibly. a) Volume. Systematic. incomplete drainage of pipette/burette. indicator errors glassware not exact. lab temperature. air buoyancy effect. vessel at different temperature to balance. b) Weight. Both. Interfering species. Incomplete reaction, decomposition or moisture absorbance of sample/analyte. Incomplete transference between vessels. With good tools and careful measurement, traditional methods (gravimetry, titrimetry) are generally more accurate than instrumental method. Error Avoidance. After considering each stage of the process, employ: Random Errors. sufficient repeated measurements (replicates) (see also later notes for estimating required replicates) a more accurate balance. improved technique (e.g. reading burette volumes) a different scale (g are easier to weigh than mg) temperature controls. replicates in different glassware. Systematic errors. difference weighing. a different/additional method. purified reagents. reference standards and blank measurements. interlaboratory trials. Systematic errors are not always obvious - but the methods above can often be used to detect them! Categories: know basics. accuracy & precision. Uncertainty. A measure of both precision and accuracy, i.e. is an indicator of overall errors associated with the method. May be quoted using s, RSD or CI (should state which) Size of the uncertainty dictates how many significant figures to quote (see next page) Analytical results are quoted as a mean ± uncertainty. s and RSD should be quoted with the relevant n. Calculating uncertainty. Problem: This can be very complex, and it is difficult to include systematic errors. Combine all known errors (e.g. weighing, glassware, reagent purity) to give an estimate of uncertainty. 1) Bottom-up method. Conduct multiple replicates of the experiment, varying as many conditions that cause bias as possible - operator, reagent source, glassware etc. - then mathematically estimate the uncertainty. 2) Top-down method. Often quoted as a indicators of uncertainty. Measures of Spread. Range: Difference between highest and lowest values. Standard Deviation (s): A good measure of precision. A small s means that the data is more precise than data with a large s - but not necessarily more accurate. Variance (s2): The square of the standard deviation. Coefficient of Variation (CV) OR Relative Standard Deviation (RSD): A relative error estimate expressed as a % of the mean of the measurements. Used to compare the precision of methods with different units/ranges. Confidence interval (CI): A range which has a high statistical likelihood (e.g.95%) of containing the true value (see later) significant figures. You should have covered this in more detail in BY131 (also see Harris ) Don’t just write down all the digits your calculator gives you! Quote the minimum number of digits needed to write a value in scientific notation without loss of accuracy. e.g.9.34 (±0.02) x 102 not 93400, and not ±0.02. Rules. The last digit will always have uncertainty associated with it (unless the data is discrete) Generally only the last digit should have uncertainty associated with it. Zeros at the end of a number imply you know the value ends in 0 (4.56 is not the same as 4.560) Use literature examples and common sense if you are unsure! If you are worried about loss of information you may put an extra digit as a subscript (e.g ) Calculations should be carried out without rounding - only round up the answer. propagation of errors. Propagation of Uncertainty (Harris Ch.3-5) bottom up estimation of uncertainty. Necessary to calculate combined errors for: estimating uncertainty for results based on two or more values each with its own uncertainty. e.g. For data reported as ratios. - we cannot simply add the errors - sometimes they will cancel each other out. Value = (sample result (±error) : control result (±error)) How do we combine uncertainties e.g. x = (a/b) + c. combine one stage at a time. can use simple formulae to combine uncertainties. 2) Combine the result with c to get uncertainty in x. 1) Combine a and b uncertainty, then. NOTE: The methods described here are only used for random errors, and assume that systematic errors have been identified and eliminated. limit of detection & limit of quantitation. The concentration which gives an instrument signal (y) significantly different from the blank (or background) signal. Limit of Detection (LOD) This is generally calculated as: Concentration x which gives rise to a signal of yB + 3sB. where yB and sB are the mean and s.d. of blank solutions. NB the method used may vary according to the purpose of the analysis - so it should always be quoted. The concentration above which precise quantitative measurement is possible. Limit of Quantitation (LOQ) Concentration x which gives rise to a signal of yB + 10sB. This calculation is often conducted in different ways - again the method used should always be quoted. Measuring LOD/LOQ. 1) Practically. Perform the analysis on matched solutions containing no analyte. BUT this can be very time- and reagent- consuming. Calculate the mean (yB) and standard deviation (sB) of the signals/measurements obtained. 2) Mathematically. This is more accurate than using the single blank value included as part of the calibration process, and eliminates the need for repetition. Use sy/x as an estimate of sB. Use the calculated value of the intercept (a) as an estimate of yB. Sensitivity vs. Detectivity. Sensitivity is a measure of instrument response to changes in concentration across the entire linear range and is only dependent on the slope of the plot. LOD and LOQ are measures of detectivity and are dependent on both the slope and the intercept of the calibration plot.")
50
types of error Three main types of error
Gross: So serious the experiment must be abandoned. e.g. dropping a key sample, instrumental breakdown Random: When an experiment is repeated as exactly as possible, the replicate results will differ due to random errors. Estimates of random errors gives the precision or reproducibility of the analysis. Systematic: An experimental method gives a reproducible under- or overestimate of the real result. Total of all systematic errors gives the bias of an analysis. types of error Three main types of error Gross: So serious the experiment must be abandoned e.g. dropping a key sample, instrumental breakdown Random: When an experiment is repeated as exactly as possible, the replicate results will differ due to random errors. Estimates of random errors gives the precision or reproducibility of the analysis. Systematic: An experimental method gives a reproducible under- or overestimate of the real result. Total of all systematic errors gives the bias of an analysis. Typical sources of error May be personal, instrumental or methodological Random a) Volume - not reading the burette reproducibly b) Weight - sensitivity of the balance Systematic a) Volume glassware not exact ”indicator errors” incomplete drainage of pipette/burette lab temperature b) Weight vessel at different temperature to balance air buoyancy effect Both Incomplete transference between vessels Incomplete reaction, decomposition or moisture absorbance of sample/analyte Interfering species With good tools and careful measurement, traditional methods (gravimetry, titrimetry) are generally more accurate than instrumental method. Error Avoidance After considering each stage of the process, employ: Random Errors improved technique (e.g. reading burette volumes) a more accurate balance sufficient repeated measurements (replicates) (see also later notes for estimating required replicates) a different scale (g are easier to weigh than mg) Systematic errors replicates in different glassware temperature controls difference weighing “reference standards” and “blank” measurements purified reagents a different/additional method interlaboratory trials Systematic errors are not always obvious - but the methods above can often be used to detect them! Categories: know basics
 Volume - not reading the burette reproducibly. b) Weight - sensitivity of the balance. Systematic. a) Volume. glassware not exact. indicator errors incomplete drainage of pipette/burette. lab temperature. b) Weight. vessel at different temperature to balance. air buoyancy effect. Both. Incomplete transference between vessels. Incomplete reaction, decomposition or moisture absorbance of sample/analyte. Interfering species. With good tools and careful measurement, traditional methods (gravimetry, titrimetry) are generally more accurate than instrumental method. Error Avoidance. After considering each stage of the process, employ: Random Errors. improved technique (e.g. reading burette volumes) a more accurate balance. sufficient repeated measurements (replicates) (see also later notes for estimating required replicates) a different scale (g are easier to weigh than mg) Systematic errors. replicates in different glassware. temperature controls. difference weighing. reference standards and blank measurements. purified reagents. a different/additional method. interlaboratory trials. Systematic errors are not always obvious - but the methods above can often be used to detect them! Categories: know basics.")
51
Typical sources of error
May be personal, instrumental or methodological Random Volume - not reading the burette reproducibly Weight - sensitivity of the balance Systematic Volume - glassware not exact; ”indicator errors”; incomplete drainage of pipette/burette; lab temperature Weight - vessel at different temperature to balance; air buoyancy effect Both Incomplete transference between vessels Incomplete reaction, decomposition or moisture absorbance of sample/analyte Interfering species With good tools and careful measurement, traditional methods (gravimetry, titrimetry) are generally more accurate than instrumental method.
 are generally more accurate than instrumental method.")
52
Error Avoidance After considering each stage of the process, employ:
Random Errors improved technique (e.g. reading burette volumes) a more accurate balance sufficient repeated measurements (replicates) a different scale (g are easier to weigh than mg) Systematic errors replicates in different glassware temperature controls difference weighing “reference standards” and “blank” measurements purified reagents a different/additional method interlaboratory trials Systematic errors are not always obvious - but the methods above can often be used to detect them!
 a more accurate balance. sufficient repeated measurements (replicates) a different scale (g are easier to weigh than mg) Systematic errors. replicates in different glassware. temperature controls. difference weighing. reference standards and blank measurements. purified reagents. a different/additional method. interlaboratory trials. Systematic errors are not always obvious - but the methods above can often be used to detect them!")
53
Accuracy and precision
Accurate and Precise Precise but not accurate Accurate but not precise Inaccurate and Imprecise

54
accuracy & precision Uncertainty - A measure of both precision and accuracy, i.e. is an indicator of overall errors associated with the method. May be quoted using s, RSD or CI (should state which) s and RSD should be quoted with the relevant n Analytical results are quoted as a mean ± uncertainty Size of the uncertainty dictates how many significant figures to quote accuracy & precision Uncertainty A measure of both precision and accuracy, i.e. is an indicator of overall errors associated with the method. May be quoted using s, RSD or CI (should state which) s and RSD should be quoted with the relevant n Analytical results are quoted as a mean ± uncertainty Size of the uncertainty dictates how many significant figures to quote (see next page) Calculating uncertainty 1) Bottom-up method Combine all known errors (e.g. weighing, glassware, reagent purity) to give an estimate of uncertainty Problem: This can be very complex, and it is difficult to include systematic errors 2) Top-down method Conduct multiple replicates of the experiment, varying as many conditions that cause bias as possible - operator, reagent source, glassware etc. - then mathematically estimate the uncertainty. Measures of Spread Often quoted as a indicators of uncertainty Range: Difference between highest and lowest values Standard Deviation (s): A good measure of precision. A small s means that the data is more precise than data with a large s - but not necessarily more accurate Variance (s2): The square of the standard deviation Coefficient of Variation (CV) OR Relative Standard Deviation (RSD): A relative error estimate expressed as a % of the mean of the measurements. Used to compare the precision of methods with different units/ranges. Confidence interval (CI): A range which has a high statistical likelihood (e.g.95%) of containing the true value (see later) Categories: know basics
 s and RSD should be quoted with the relevant n. Analytical results are quoted as a mean ± uncertainty. Size of the uncertainty dictates how many significant figures to quote. accuracy & precision. Uncertainty. A measure of both precision and accuracy, i.e. is an indicator of overall errors associated with the method. May be quoted using s, RSD or CI (should state which) s and RSD should be quoted with the relevant n. Analytical results are quoted as a mean ± uncertainty. Size of the uncertainty dictates how many significant figures to quote (see next page) Calculating uncertainty. 1) Bottom-up method. Combine all known errors (e.g. weighing, glassware, reagent purity) to give an estimate of uncertainty. Problem: This can be very complex, and it is difficult to include systematic errors. 2) Top-down method. Conduct multiple replicates of the experiment, varying as many conditions that cause bias as possible - operator, reagent source, glassware etc. - then mathematically estimate the uncertainty. Measures of Spread. Often quoted as a indicators of uncertainty. Range: Difference between highest and lowest values. Standard Deviation (s): A good measure of precision. A small s means that the data is more precise than data with a large s - but not necessarily more accurate. Variance (s2): The square of the standard deviation. Coefficient of Variation (CV) OR Relative Standard Deviation (RSD): A relative error estimate expressed as a % of the mean of the measurements. Used to compare the precision of methods with different units/ranges. Confidence interval (CI): A range which has a high statistical likelihood (e.g.95%) of containing the true value (see later) Categories: know basics.")
55
Calculating uncertainty
Bottom-up method Combine all known errors (e.g. weighing, glassware, reagent purity) to give an estimate of uncertainty Problem: This can be very complex, and it is difficult to include systematic errors Top-down method Conduct multiple replicates of the experiment, varying as many conditions that cause bias as possible - operator, reagent source, glassware etc. - then mathematically estimate the uncertainty.
 to give an estimate of uncertainty. Problem: This can be very complex, and it is difficult to include systematic errors. Top-down method. Conduct multiple replicates of the experiment, varying as many conditions that cause bias as possible - operator, reagent source, glassware etc. - then mathematically estimate the uncertainty.")
56
Measures of Spread Often quoted as a indicators of uncertainty
Range: Difference between highest and lowest values Standard Deviation (s): A good measure of precision. A small s means that the data is more precise than data with a large s - but not necessarily more accurate Variance (s2): The square of the standard deviation Coefficient of Variation (CV) OR Relative Standard Deviation (RSD): A relative error estimate expressed as a % of the mean of the measurements. Used to compare the precision of methods with different units/ranges. Confidence interval (CI): A range which has a high statistical likelihood (e.g.95%) of containing the true value
: A good measure of precision. A small s means that the data is more precise than data with a large s - but not necessarily more accurate. Variance (s2): The square of the standard deviation. Coefficient of Variation (CV) OR Relative Standard Deviation (RSD): A relative error estimate expressed as a % of the mean of the measurements. Used to compare the precision of methods with different units/ranges. Confidence interval (CI): A range which has a high statistical likelihood (e.g.95%) of containing the true value.")
57
significant figures You should have covered this in more detail in BY131 (also see Harris ) Don’t just write down all the digits your calculator gives you! Quote the minimum number of digits needed to write a value in scientific notation without loss of accuracy e.g (±0.02) x 102 not 93400, and not ±0.02 significant figures You should have covered this in more detail in BY131 (also see Harris ) Don’t just write down all the digits your calculator gives you! Quote the minimum number of digits needed to write a value in scientific notation without loss of accuracy e.g.9.34 (±0.02) x 102 not 93400, and not ±0.02 Rules Generally only the last digit should have uncertainty associated with it The last digit will always have uncertainty associated with it (unless the data is discrete) Zeros at the end of a number imply you know the value ends in 0 (4.56 is not the same as 4.560) Calculations should be carried out without rounding - only round up the answer If you are worried about loss of information you may put an extra digit as a subscript (e.g ) Use literature examples and common sense if you are unsure! Categories: know basics
 x 102 not 93400, and not ±0.02. significant figures. You should have covered this in more detail in BY131 (also see Harris ) Don’t just write down all the digits your calculator gives you! Quote the minimum number of digits needed to write a value in scientific notation without loss of accuracy. e.g.9.34 (±0.02) x 102 not 93400, and not ±0.02. Rules. Generally only the last digit should have uncertainty associated with it. The last digit will always have uncertainty associated with it (unless the data is discrete) Zeros at the end of a number imply you know the value ends in 0 (4.56 is not the same as 4.560) Calculations should be carried out without rounding - only round up the answer. If you are worried about loss of information you may put an extra digit as a subscript (e.g ) Use literature examples and common sense if you are unsure! Categories: know basics.")
58
Rules Generally only the last digit should have uncertainty associated with it The last digit will always have uncertainty associated with it (unless the data is discrete) Zeros at the end of a number imply you know the value ends in 0 (4.56 is not the same as 4.560) Calculations should be carried out without rounding - only round up the answer If you are worried about loss of information you may put an extra digit as a subscript (e.g ) Use literature examples and common sense if you are unsure!
 Zeros at the end of a number imply you know the value ends in 0 (4.56 is not the same as 4.560) Calculations should be carried out without rounding - only round up the answer. If you are worried about loss of information you may put an extra digit as a subscript (e.g ) Use literature examples and common sense if you are unsure!")
59
propagation of errors Necessary to calculate combined errors for:
“bottom up” estimation of uncertainty estimating uncertainty for results based on two or more values each with its own uncertainty e.g. For data reported as ratios Value = (sample result (±error) : control result (±error)) - we cannot simply add the errors - sometimes they will cancel each other out propagation of errors Propagation of Uncertainty (Harris Ch.3-5) Necessary to calculate combined errors for: “bottom up” estimation of uncertainty estimating uncertainty for results based on two or more values each with its own uncertainty e.g. For data reported as ratios Value = (sample result (±error) : control result (±error)) - we cannot simply add the errors - sometimes they will cancel each other out How do we combine uncertainties? can use simple formulae to combine uncertainties combine one stage at a time e.g. x = (a/b) + c 1) Combine a and b uncertainty, then 2) Combine the result with c to get uncertainty in x NOTE: The methods described here are only used for random errors, and assume that systematic errors have been identified and eliminated
 : control result (±error)) - we cannot simply add the errors - sometimes they will cancel each other out. propagation of errors. Propagation of Uncertainty (Harris Ch.3-5) Necessary to calculate combined errors for: bottom up estimation of uncertainty. estimating uncertainty for results based on two or more values each with its own uncertainty. e.g. For data reported as ratios. Value = (sample result (±error) : control result (±error)) - we cannot simply add the errors - sometimes they will cancel each other out. How do we combine uncertainties can use simple formulae to combine uncertainties. combine one stage at a time. e.g. x = (a/b) + c. 1) Combine a and b uncertainty, then. 2) Combine the result with c to get uncertainty in x. NOTE: The methods described here are only used for random errors, and assume that systematic errors have been identified and eliminated.")
60
Relative and Absolute uncertainties
Uncertainties of a measurement x can be quoted as absolute – ex (in same units as x) Relative - %ex ( a percentage of x) Conversion:
 Relative - %ex ( a percentage of x) Conversion:")
61
Example Question A sample weight was measured as 5.1g. The balance used was known to be accurate to 0.02g. What is the relative uncertainty associated with this measurement? So,

62
How do we combine uncertainties?
We can use simple formulae to combine uncertainties Combine one stage at a time e.g. x = (a/b) + c 1) Combine a and b uncertainty, then 2) Combine the result with c to get uncertainty in x NOTE: The methods described here are only used for random errors, and assume that systematic errors have been identified and eliminated
 + c. 1) Combine a and b uncertainty, then. 2) Combine the result with c to get uncertainty in x. NOTE: The methods described here are only used for random errors, and assume that systematic errors have been identified and eliminated.")
63
Combining uncertainties - addition and subtraction
Where the calculation to find x includes addition or subtraction e.g. x = a+b-c We need to combine the absolute uncertainties for a, b and c, i.e. Combine ea eb and ec Uncertainty in x: Method: Calculate x Calculate ex Quote result as x ± ex Square of absolute uncertainties are added (even if result is subtracted)
")
64
Example question Uncertainty in reading a burette:
You measure a volume by subtracting the initial reading from the final reading. Initial reading is 0.05 (0.02) ml Final reading is (0.02) ml If the uncertainty in each reading is known to be 0.02ml what is the volume measured and its overall uncertainty Measured volume is ml = 17.83ml Absolute uncertainty, ex = Volume =17.83 (±0.03)ml
 ml. Final reading is (0.02) ml. If the uncertainty in each reading is known to be 0.02ml what is the volume measured and its overall uncertainty. Measured volume is ml = 17.83ml. Absolute uncertainty, ex = Volume =17.83 (±0.03)ml.")
65
Combining uncertainties – multiplication and division
Where the calculation to find x includes multiplication or division e.g. x = (a×b)/c We need to combine the relative uncertainties for a, b and c, i.e. Combine %ea %eb and %ec Uncertainty in x: Method: Calculate x Convert absolute uncertainties to relative uncertainties Calculate %ex Convert %ex to ex Quote result as x ± ex
/c. We need to combine the relative uncertainties for a, b and c, i.e. Combine %ea %eb and %ec. Uncertainty in x: Method: Calculate x. Convert absolute uncertainties to relative uncertainties. Calculate %ex. Convert %ex to ex. Quote result as x ± ex.")
66
Example question Calculate x Relative uncertainties:
Calculate the value and uncertainty of x where: x= (a.b)/c and: a = 1.76 ( 0.03), b = 1.89 ( 0.02) and c = 0.59 ( 0.02) Calculate x Relative uncertainties:
/c and: a = 1.76 ( 0.03), b = 1.89 ( 0.02) and c = 0.59 ( 0.02) Calculate x. Relative uncertainties:")
67
Example question cont. Combine Convert to absolute uncertainty So,

68
Combining uncertainties – powers and roots
Where the calculation to find x includes a power or root e.g. x = ab or x = √a Using relative uncertainties Uncertainty in x: Method: Express roots as ab e.g. √a = a½ Calculate x Convert ea to %ea Calculate %ex by multiplying by b Convert %ex to ex Quote result as x ± ex

69
Example question Calculate the value and uncertainty of x where: x= a3 and a = 1.76 ( 0.03) Express as x = ab Calculate x Convert absolute uncertainty to relative uncertainty

70
Example question, cont. Multiply by b Convert to absolute uncertainty
(using correct s.f.)
")
71
Combining uncertainties - constants
Where a constant k is part of the calculation, and has no uncertainty associated with it. Rule of thumb: If you are uncertain about the effect of k, include it as a term with an associated uncertainty of 0 Case 1: k is added or subtracted Value and uncertainty of x where x = k + a or x = a - k k does not affect the absolute uncertainty - but will affect relative uncertainty Case 2: k is multiplied or divided Value and uncertainty of x where x = ka or a/k k affects the absolute uncertainty - but not the relative uncertainty

72
Combining uncertainties – combinations
Solve each type of combination separately, one at a time e.g x = (a + b) c Combine errors for a + b to get absolute ea+b Convert ea+b to %ea+b using (a + b) as the measured value Convert ec to %ec and combine with %ea+b to get %ex Calculate x Convert %ex to ex Answer is expressed as x± ex NOTE: All these examples give ex (absolute uncertainty) as an answer. You may be asked to calculate just %ex (relative uncertainty) Read the question carefully!
 c. Combine errors for a + b to get absolute ea+b. Convert ea+b to %ea+b using (a + b) as the measured value. Convert ec to %ec and combine with %ea+b to get %ex. Calculate x. Convert %ex to ex. Answer is expressed as x± ex. NOTE: All these examples give ex (absolute uncertainty) as an answer. You may be asked to calculate just %ex (relative uncertainty) Read the question carefully!")
73
Example question A 50cm3 burette can be read to ± 0.02cm3. In a particular analysis the result is calculated using the formula y = xm/(Ts - Tb) where y is the analyte concentration, in mol.dm-3, and Ts and Tb and the sample and blank titres respectively in cm3. Calculate the uncertainty in the final result when: x = (0.150 ± 0.002) mol.dm-3, m=300, Ts = cm3 and Tb = 0.04 cm3. m is known absolutely.
 where y is the analyte concentration, in mol.dm-3, and Ts and Tb and the sample and blank titres respectively in cm3. Calculate the uncertainty in the final result when: x = (0.150 ± 0.002) mol.dm-3, m=300, Ts = cm3 and Tb = 0.04 cm3. m is known absolutely.")
74
y = xm/(Ts - Tb) Look at subtraction first
Measured volume Ts - Tb = ml = 14.97ml Calculate eTs-Tb Convert to %eTs-Tb

75
Now look at constant y = xm/(Ts-Tb) m only affects absolute uncertainties for y To calculate ey we will be using relative uncertainties (division) Convert ex to %ex Combine relative uncertainties

76
Calculate y Convert relative uncertainty of y to absolute So,

77
Limit of Detection (LoD)
The concentration which gives an instrument signal (y) significantly different from the blank (or background) signal This is generally calculated as: Concentration x which gives rise to a signal of yB + 3sB where yB and sB are the mean and s.d. of blank solutions NB the method used may vary according to the purpose of the analysis - so it should always be quoted limit of detection & limit of quantitation Limit of Detection (LOD) The concentration which gives an instrument signal (y) significantly different from the blank (or background) signal This is generally calculated as: Concentration x which gives rise to a signal of yB + 3sB where yB and sB are the mean and s.d. of blank solutions NB the method used may vary according to the purpose of the analysis - so it should always be quoted Limit of Quantitation (LOQ) The concentration above which precise quantitative measurement is possible Concentration x which gives rise to a signal of yB + 10sB This calculation is often conducted in different ways - again the method used should always be quoted Measuring LOD/LOQ 1) Practically Perform the analysis on matched solutions containing no analyte Calculate the mean (yB) and standard deviation (sB) of the signals/measurements obtained BUT this can be very time- and reagent- consuming 2) Mathematically Use the calculated value of the intercept (a) as an estimate of yB Use sy/x as an estimate of sB This is more accurate than using the single blank value included as part of the calibration process, and eliminates the need for repetition Sensitivity vs. Detectivity LOD and LOQ are measures of detectivity and are dependent on both the slope and the intercept of the calibration plot Sensitivity is a measure of instrument response to changes in concentration across the entire linear range and is only dependent on the slope of the plot
 significantly different from the blank (or background) signal. This is generally calculated as: Concentration x which gives rise to a signal of yB + 3sB. where yB and sB are the mean and s.d. of blank solutions. NB the method used may vary according to the purpose of the analysis - so it should always be quoted. limit of detection & limit of quantitation. Limit of Detection (LOD) The concentration which gives an instrument signal (y) significantly different from the blank (or background) signal. This is generally calculated as: Concentration x which gives rise to a signal of yB + 3sB. where yB and sB are the mean and s.d. of blank solutions. NB the method used may vary according to the purpose of the analysis - so it should always be quoted. Limit of Quantitation (LOQ) The concentration above which precise quantitative measurement is possible. Concentration x which gives rise to a signal of yB + 10sB. This calculation is often conducted in different ways - again the method used should always be quoted. Measuring LOD/LOQ. 1) Practically. Perform the analysis on matched solutions containing no analyte. Calculate the mean (yB) and standard deviation (sB) of the signals/measurements obtained. BUT this can be very time- and reagent- consuming. 2) Mathematically. Use the calculated value of the intercept (a) as an estimate of yB. Use sy/x as an estimate of sB. This is more accurate than using the single blank value included as part of the calibration process, and eliminates the need for repetition. Sensitivity vs. Detectivity. LOD and LOQ are measures of detectivity and are dependent on both the slope and the intercept of the calibration plot. Sensitivity is a measure of instrument response to changes in concentration across the entire linear range and is only dependent on the slope of the plot.")
78
Measuring LOD/LOQ Practically
Perform the analysis on matched solutions containing no analyte Calculate the mean (yB) and standard deviation (sB) of the signals/measurements obtained BUT this can be very time- and reagent- consuming Mathematically Use the calculated value of the intercept (a) as an estimate of yB Use sy/x as an estimate of sB This is more accurate than using the single blank value included as part of the calibration process, and eliminates the need for repetition
 and standard deviation (sB) of the signals/measurements obtained. BUT this can be very time- and reagent- consuming. Mathematically. Use the calculated value of the intercept (a) as an estimate of yB. Use sy/x as an estimate of sB. This is more accurate than using the single blank value included as part of the calibration process, and eliminates the need for repetition.")
79
Sensitivity vs. Detectivity
LOD and LOQ are measures of detectivity and are dependent on both the slope and the intercept of the calibration plot Sensitivity is a measure of instrument response to changes in concentration across the entire linear range and is only dependent on the slope of the plot

80
Limit of Quantitation (LoQ)
The concentration above which precise quantitative measurement is possible This is generally calculated as: Concentration x which gives rise to a signal of yB + 10sB This calculation is often conducted in different ways - again the method used should always be quoted

81
Record Keeping Ensure results are recorded in a laboratory notebook even if they are available electronically. Enough information should be included to ensure a colleague can repeat the experiment using only your notes. Keep a copy of the notebook (preferably in a separate location). Many employers have their own methods for laboratory record keeping and usually require that each page is signed and dated by both the employee and their line manager. This is useful when it comes to intellectual property rights. Record Keeping Ensure results are recorded in a laboratory notebook even if they are available electronically. Enough information should be included to ensure a colleague can repeat the experiment using only your notes. It is also a good idea to keep a copy of the notebook (preferably in a separate location). Many employers have their own prescribed methods for laboratory record keeping and usually require that each page is signed and dated by both the employee and their line manager. This is useful when it comes to intellectual property rights. In general for each experiment include: title and date objectives reaction scheme, if applicable hazard assessment, if necessary method results and calculations, including any instrument readouts and graphs conclusion
. Many employers have their own methods for laboratory record keeping and usually require that each page is signed and dated by both the employee and their line manager. This is useful when it comes to intellectual property rights. Record Keeping. Ensure results are recorded in a laboratory notebook even if they are available electronically. Enough information should be included to ensure a colleague can repeat the experiment using only your notes. It is also a good idea to keep a copy of the notebook (preferably in a separate location). Many employers have their own prescribed methods for laboratory record keeping and usually require that each page is signed and dated by both the employee and their line manager. This is useful when it comes to intellectual property rights. In general for each experiment include: title and date. objectives. reaction scheme, if applicable. hazard assessment, if necessary. method. results and calculations, including any instrument readouts and graphs. conclusion.")
82
Record Keeping In general for each experiment include: title and date
objectives reaction scheme, if applicable hazard assessment, if necessary method results and calculations, including any instrument readouts and graphs conclusion Record Keeping Ensure results are recorded in a laboratory notebook even if they are available electronically. Enough information should be included to ensure a colleague can repeat the experiment using only your notes. It is also a good idea to keep a copy of the notebook (preferably in a separate location). Many employers have their own prescribed methods for laboratory record keeping and usually require that each page is signed and dated by both the employee and their line manager. This is useful when it comes to intellectual property rights. In general for each experiment include: title and date objectives reaction scheme, if applicable hazard assessment, if necessary method results and calculations, including any instrument readouts and graphs conclusion
. Many employers have their own prescribed methods for laboratory record keeping and usually require that each page is signed and dated by both the employee and their line manager. This is useful when it comes to intellectual property rights. In general for each experiment include: title and date. objectives. reaction scheme, if applicable. hazard assessment, if necessary. method. results and calculations, including any instrument readouts and graphs. conclusion.")
83
Reporting - Analytical Documentation
Used to allow other competent analysts to reproduce the method. Sufficient detail is required to obtain consistent results. Trained and competent personnel are still required even when a full detailed document is available Please see studentcentral website for further details Drawing conclusions In a written report of an experiment you must come to some conclusion about the work Use the information from the statistical tests and performance parameters Pull together all the information Keep the wording ‘analytical’ i.e. use ‘accurate’ and ‘precise’ correctly, and don’t over-generalise Make informed judgements about the technique and compare to other possible techniques reporting Analytical Documentation Written analytical procedures are used to allow other competent analysts to reproduce the method. Sufficient detail is required to obtain consistent results. Trained and competent personnel are still required even when a full detailed document is available Analytical Documentation for Procedures Scope and applicability Samples Analytes Ranges Description and principle of the method Equipment Specification Calibration and qualification Range of operability Reference materials and reagents Preparation Storage Health & Safety Sampling Methods Limitations Analytical Procedure Preparation of samples Preparation of standards Critical factors Detailed description of all steps Typical outputs; chromatograms, spectra, etc. Recording and reporting of data Method Rounding and significant figures Data treatments Calculation of results Calibration model Calculation methods Assumptions and limitations Method performance Statistical measures Control charting References & Bibliography Drawing conclusions In a written report of an experiment you must come to some conclusion about the work Use the information from the statistical tests and performance parameters Pull together all the information Keep the wording ‘analytical’ i.e. use ‘accurate’ and ‘precise’ correctly, and don’t over-generalise Make informed judgements about the technique and compare to other possible techniques

Similar presentations
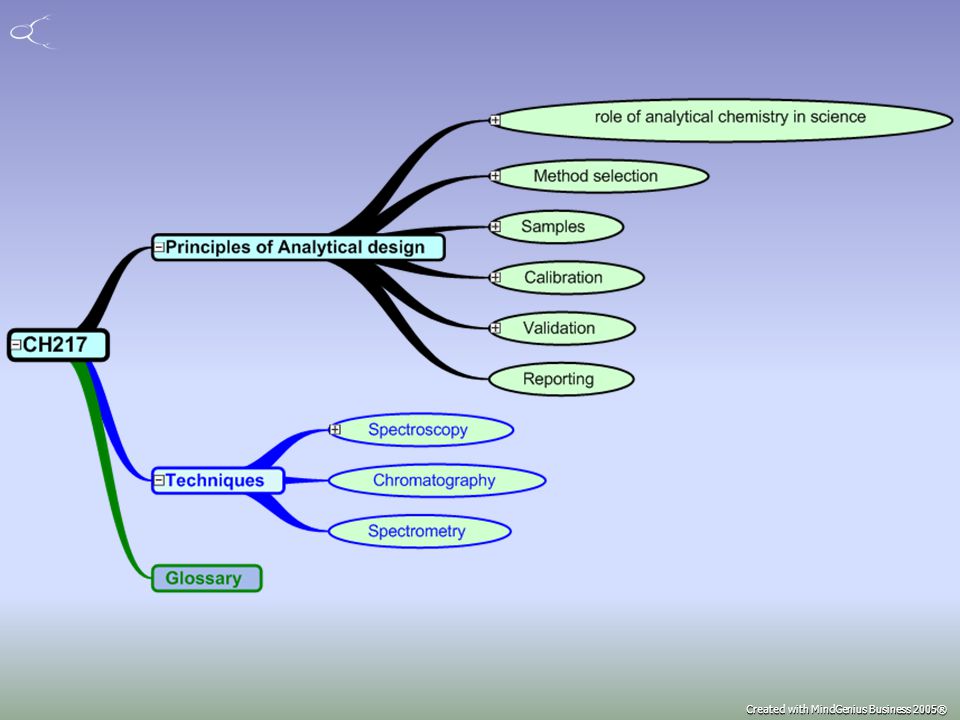


. You can freely download,>")


