Download presentation
Presentation is loading. Please wait.

1
Monitoring and Evaluation of Smart Specialisation Strategy Krzysztof Mieszkowski JRC.IPTS, S 3 Platform 28 th May 2014, Sandomierz

3
Outputs, results and impact in relation to programming, monitoring and evaluation

4
Indicators Outputs are the direct products of programmes; they are intended to contribute to results Result indicators are variables that provide information on some specific aspects of results that lend themselves to be measured. Monitoring Monitoring of outputs means to observe whether intended products are delivered and whether implementation is on track Monitoring also observes changes in the result indicators (policy monitoring) The values of result indicators, both for baselines and at later points in time, in some cases can be obtained from national or regional statistics. In other cases it might be necessary to carry out surveys or to use administrative data, such as registry of enterprises or unemployment benefit recipient data.
 The values of result indicators, both for baselines and at later points in time, in some cases can be obtained from national or regional statistics. In other cases it might be necessary to carry out surveys or to use administrative data, such as registry of enterprises or unemployment benefit recipient data..")
5
Evaluation Change in result indicator ═ contribution of intervention + contribution of other factors Impact is the change that can be credibly attributed to an intervention. "Effect of an intervention" or "contribution of an intervention" are alternative expressions for this idea. Impact evaluation – capturing effects Did the public intervention have an effect at all and if yes, how big – positive or negative – was this effect. The question is: Does it work? Is there a causal link? This is the question counterfactual impact evaluations aim to answer. Why an intervention produces intended (and unintended) effects. The goal is to answer the “why and how it works?” question. To answer this question is the aim of theory-based impact evaluations.
 effects. The goal is to answer the why and how it works question. To answer this question is the aim of theory-based impact evaluations..")
6
Clear objectives and selection of result indicators Result indicators shall meet certain quality criteria. They should be (CPR, annex XI): a)responsive to policy: closely linked to the policy interventions supported. They should capture the essence of a result according to a reasonable argument about which features they can and cannot represent; b)normative: having a clear and accepted normative interpretation (i.e. there must be agreement that a movement in a particular direction is a favourable or an unfavourable result); c)robust: reliable, statistically validated; d)timely collection of data: available when needed, with room built in for debate and for revision when needed and justified. Each result indicator requires a baseline value
: a)responsive to policy: closely linked to the policy interventions supported. They should capture the essence of a result according to a reasonable argument about which features they can and cannot represent; b)normative: having a clear and accepted normative interpretation (i.e. there must be agreement that a movement in a particular direction is a favourable or an unfavourable result); c)robust: reliable, statistically validated; d)timely collection of data: available when needed, with room built in for debate and for revision when needed and justified. Each result indicator requires a baseline value.")
7
Output indicators shall cover all investment priorities of a programme (art. 27.4(b), 96.2(b) CPR). As explained in section 1.1, they should be derived from the intervention logic of the programme, expressing its actions. Output indicators from the list of common indicators may be insufficient to reflect the actions of a certain programme; in this case it is necessary to identify programme specific output indicators. Common indicators are designed to aggregate information in a Member State and across Member States. They reflect frequently used investments of the ERDF and the Cohesion Fund. Common indicators reflect the actions, not the objectives of a programme or of regional policy. Actions reflected in common indicators are not more important than others. Member States shall use indicators from the list of common indicators whenever appropriate (art. 6, ERDF regulation; art. 5, CF regulation; art. 16, ETC regulation; see annex 1). "When appropriate" means, for example, if a programme does not support the construction of roads, the corresponding common indicators "kilometres of new roads" is not applicable.
, 96.2(b) CPR). As explained in section 1.1, they should be derived from the intervention logic of the programme, expressing its actions. Output indicators from the list of common indicators may be insufficient to reflect the actions of a certain programme; in this case it is necessary to identify programme specific output indicators. Common indicators are designed to aggregate information in a Member State and across Member States. They reflect frequently used investments of the ERDF and the Cohesion Fund. Common indicators reflect the actions, not the objectives of a programme or of regional policy. Actions reflected in common indicators are not more important than others. Member States shall use indicators from the list of common indicators whenever appropriate (art. 6, ERDF regulation; art. 5, CF regulation; art. 16, ETC regulation; see annex 1). When appropriate means, for example, if a programme does not support the construction of roads, the corresponding common indicators kilometres of new roads is not applicable..")
8
COMMON OUTPUT INDICATORS FOR ERDF SUPPORT UNDER THE INVESTMENT FOR GROWTH AND JOBS GOAL (ARTICLE 6)
")
9
Monitoring and evaluation systems of regional OPs ≠ monitoring and evaluation systems of S3s. Why? S3 is a top (regional) level (refers to regional economy, regional innovation system) dealing with broader scope of issues. Several OPs and sources of funds (regional, national, inter-regional, and EU – public and private) might be used to implement the strategy; also non-financial tools and actions can be considered. But OPs should reflect policy-mixes developed in S3 processes and should consider actions to reach the S3 strategic objectives seriously. Because of that The OP monitoring system should be also considered as a source of monitoring and evaluation information for S3.
 level (refers to regional economy, regional innovation system) dealing with broader scope of issues. Several OPs and sources of funds (regional, national, inter-regional, and EU – public and private) might be used to implement the strategy; also non-financial tools and actions can be considered. But OPs should reflect policy-mixes developed in S3 processes and should consider actions to reach the S3 strategic objectives seriously. Because of that The OP monitoring system should be also considered as a source of monitoring and evaluation information for S3..")
10
PoziomCelMiernik Krajowy1.Utrzymanie realnego wzrostu PKB na poziomie 3.5% 2.Zwiększenie liczby miejsc pracy 3.Zwiększenie innowacyjności gospodarki 1.Stopa wzrostu PKB 2.Stopa bezrobocia 3.IUS Regionalny1.Zwiększenie innowacyjności regionalnej gospodarki 1.RIS Program (IP 1.2) 1.Zwiększenie zaangażowania biznesu w finansowanie i prowadzenie prac B+R 1.Wzrost BERD 2.Wzrost udziału biznesu w finansowaniu B+R. 3.Wzrost udziału środków publicznych w finansowaniu BERD. 1.Zwiększenie współpracy w zakresie B+R między biznesem a jednostkami naukowymi 2.Zwiększenie zatrudnienia personelu B+R w przedsiębiorstwach 1.Liczba projektów B+R prowadzonych przed przedsiębiorstwa 2.Liczba projektów B+R prowadzonych we współpracy z jednostkami naukowymi 3.Liczba projektów B+R prowadzonych przez nowo-zatrudniony personel B+R w przedsiębiorstwach Projekt1.Opracowanie innowacyjnej technologii w oparciu o prace B+R 1.Liczna pracowników B+R zatrudniona przy projekcie 2.Wartość nakładów poniesionych na prace B+R w podziale na źródła finansowania 3.Oczekiwane korzyści ekonomiczne projektu. W obszarach regionalnej inteligentnej specjalizacji

11
11 RIS3 guide – Key steps for developing a RIS3 Step 1 – Analysis of regional context/potential Step 2 – Governance Step 3 – Vision for the future Step 4 – Selection of priorities Step 5 – Policy mix Step 6 – Monitoring and evaluation RIS3 AnalysisProcessVisionPrioritiesPolicy mixMonitoring

12
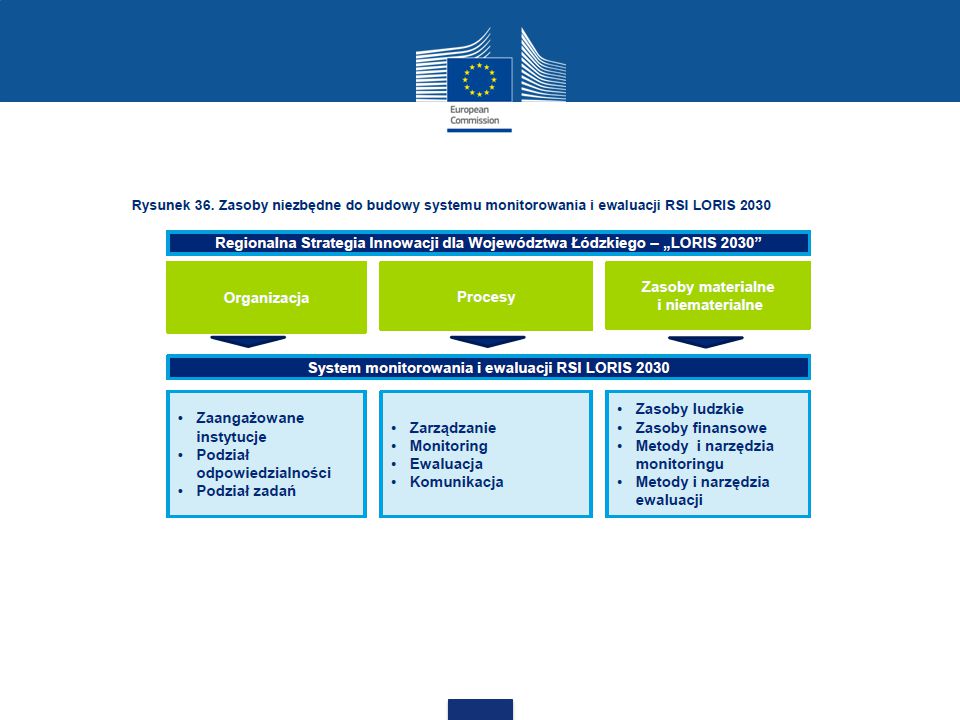
Step 6 – Integration of monitoring and evaluation mechanisms Monitoring to verify the correct and efficient implementation of activities Evaluation to verify whether and how strategic goals are met Importance of ex-ante setting of measurable targets and output/ outcome indicators Mechanisms integrated in the strategy:

13
So what do we need? 1.The policy-mix (objectives and adequate instruments) 2.The roadmap and milestones (a need for time and mid-term objectives) 3.The chosen indicators (measuring the progress in reaching the strategic objectives) 4.Monitoring mechanism (monitoring processes and products of them) 5.Governance structure (who is doing what, responsibility)
 2.The roadmap and milestones (a need for time and mid-term objectives) 3.The chosen indicators (measuring the progress in reaching the strategic objectives) 4.Monitoring mechanism (monitoring processes and products of them) 5.Governance structure (who is doing what, responsibility).")
14
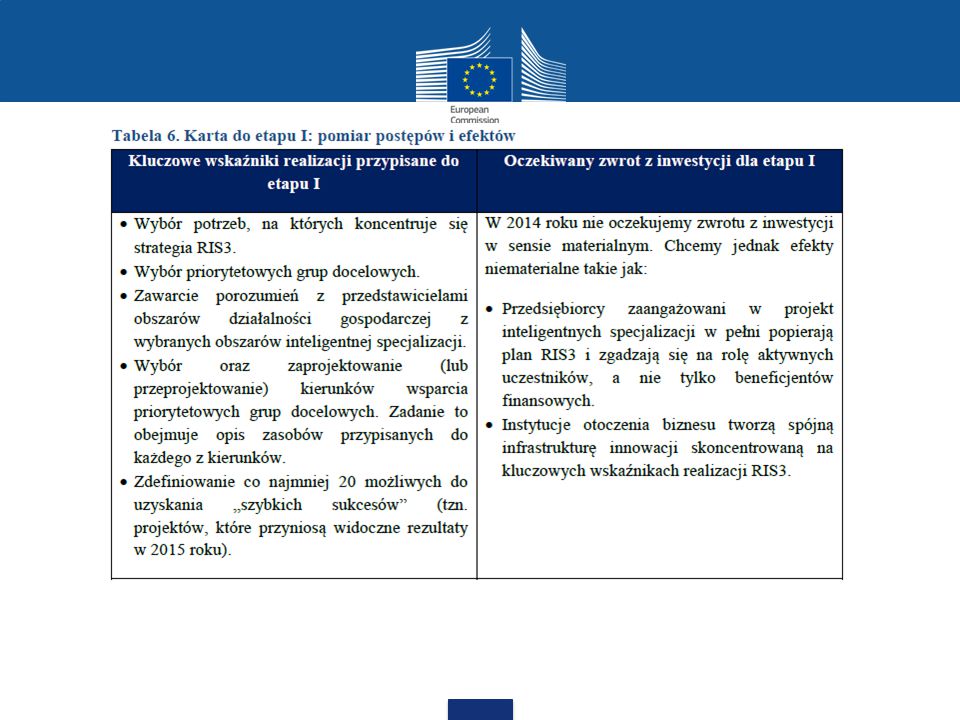
S3 roadmap and milestones

18
Regionalne Obserwatoria Terytorialne

21
Monitoring of improvement in innovativeness of a region – Regional Innovation Scoreboard

22
Monitoring of S3-based policy

23
Ramy definiujące inteligentne specjalizacje regionu w wymiarze naukowym, edukacyjnym i gospodarczym

29
Badania postaw przedsiębiorczości => bazy danych Możliwość przeprowadzenia badania pogłębionego Cykliczność badania pozwala znaleźć różnice – dynamiki dla określonych czynników Instrument szybkiego reagowania http://www.isr.parp.gov.pl/ 29 Raporty monitorujące

30
Database of Andalusian companies La Central de Balances de Andalucía (CBA) es un sistema de información concebido como instrumento para conocer la realidad y la evolución de la empresa andaluza a través de sus cuentas públicas. Creada en el año 1992 por la Agencia de Innovación y Desarrollo de Andalucía (entonces denominada Instituto de Fomento), en su proceso de desarrollo ha contado con la decisiva colaboración de Unicaja mediante sus sociedades Analistas Económicos de Andalucía e Instituto de Análisis Económico y Empresarial. En el año 2006 se integran la CBA y la Central de Balances de Actividad Empresarial en Andalucía, elaborada por el Instituto de Estadística de Andalucía, en virtud de un convenio firmado por sus instituciones promotoras. De esta forma, los resultados agregados de la CBA pasan a formar parte de la estadística oficial de la Comunidad Autónoma de Andalucía. http://www.centraldebalancesdeandalucia.es/ CBSO Andalusia (CBA) is an information system designed as a tool for understanding reality and the evolution of the Andalusian company through its public accounts. Created in 1992 by the Agency for Innovation and Development of Andalusia (then Institute of Development), in their development process has had the decisive collaboration of Unicaja by their societies Economic Analysts of Andalusia and Institute of Economic and Business Analysis. In 2006, the CBA and the CBSO Entrepreneurial Activity in Andalusia, developed by the Institute of Statistics of Andalusia, under an agreement signed by their sponsoring institutions are integrated. Thus, the aggregate results of the CBA become part of the official statistics of the Autonomous Community of Andalusia.
, en su proceso de desarrollo ha contado con la decisiva colaboración de Unicaja mediante sus sociedades Analistas Económicos de Andalucía e Instituto de Análisis Económico y Empresarial. En el año 2006 se integran la CBA y la Central de Balances de Actividad Empresarial en Andalucía, elaborada por el Instituto de Estadística de Andalucía, en virtud de un convenio firmado por sus instituciones promotoras. De esta forma, los resultados agregados de la CBA pasan a formar parte de la estadística oficial de la Comunidad Autónoma de Andalucía. CBSO Andalusia (CBA) is an information system designed as a tool for understanding reality and the evolution of the Andalusian company through its public accounts. Created in 1992 by the Agency for Innovation and Development of Andalusia (then Institute of Development), in their development process has had the decisive collaboration of Unicaja by their societies Economic Analysts of Andalusia and Institute of Economic and Business Analysis. In 2006, the CBA and the CBSO Entrepreneurial Activity in Andalusia, developed by the Institute of Statistics of Andalusia, under an agreement signed by their sponsoring institutions are integrated. Thus, the aggregate results of the CBA become part of the official statistics of the Autonomous Community of Andalusia..")
31
Monitoring and Evaluation - Lithuania To follow up activites in projects and programmes Learning for future But also to adapt and change areas of focus Stakeholders engaged in governance structure MOSTA in Lithuania

32
Integration of monitoring and evaluation mechanism – Lower Austria 32 Target group Level CompanyIntermediaryPolicy Maker Project Program Region Cockpit: Monitor of results and regional effects Cockpit: Monitor of results and regional effects In–process monitoring and ex-post evaluation BSC Balanced Scorecard Methodology External evaluations External evaluations standardised pilot Enterprise Dialogue incl. online questionnaire RIS NÖ Large scale questionnaire Enterprise Dialogue incl. online questionnaire RIS NÖ Large scale questionnaire NÖ Innovations index and other studies CIS extension for regional data bi annual National complete R&D inventory count bi annual

33
Stakeholder Engagement & Intervention 33 Requirement within BSC to have an ongoing strategy reviewing process External - Enterprise Dialogue with minister and top management representatives – once a year - thematic small dialogues with ministers on demand - RIS Steering Committee – once a year - Online Large Scale Questionnaire – every 5 years - Bi-annual meetings with key stakeholders (chamber of commerce, federation of industries) - Steering committee of Clusters Internal - Top-level: Bi-annual strategy meetings (top management + minister) - Programme Level: Bi-annual BSC reviews Inputs lead to changes/adaption of strategy
 - Steering committee of Clusters Internal - Top-level: Bi-annual strategy meetings (top management + minister) - Programme Level: Bi-annual BSC reviews Inputs lead to changes/adaption of strategy")
34
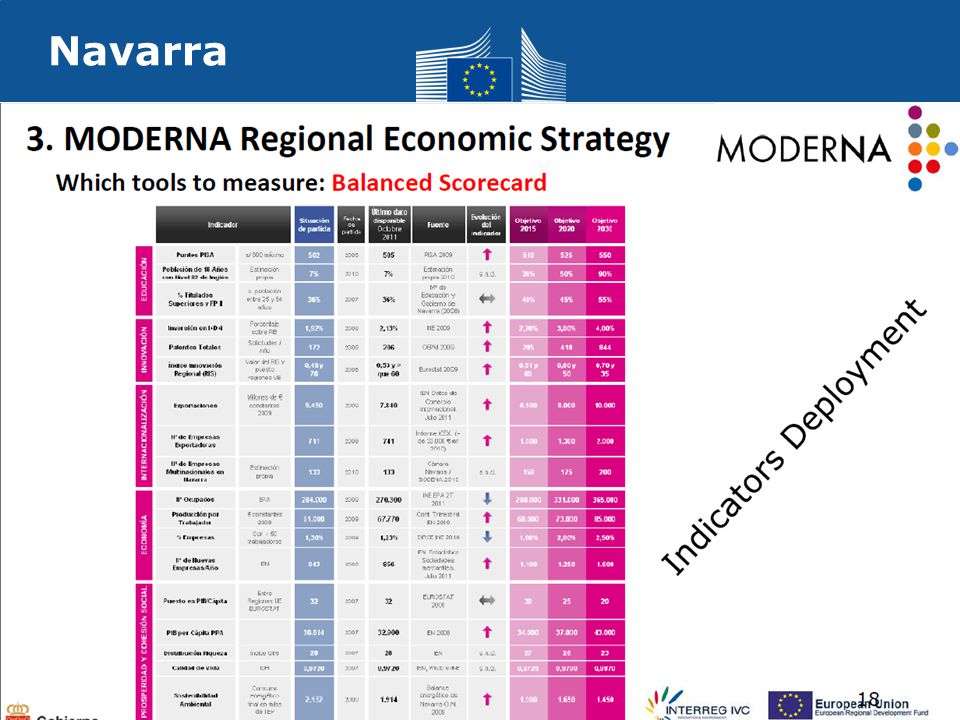
Navarra

36
Berlin Brandenburg – cluster focus 36

37
Scotland 37

Similar presentations


 financial engineering instruments for SMEs 5 th Plenary Meeting JEREMIE Networking Platform.>")


