Download presentation
Presentation is loading. Please wait.

2
When preparing for this workshop you must either: (1) Print registered schools own data OR (2) Go to Dummy data in materials to be printed in office and print dummy data according to the level of the school AND what they do not have already (e.g. if SET done but no SSS print dummy SSS for them to use). Do not print multi-year SWIS graphs. Bring the TIPS Flip Cart. NOTE: IN OCTOBER, THE SET AND SELF- ASSESSMENT ORDER IS BACKWARDS (the SET is newer than the self-assessment)
. Do not print multi-year SWIS graphs. Bring the TIPS Flip Cart. NOTE: IN OCTOBER, THE SET AND SELF- ASSESSMENT ORDER IS BACKWARDS (the SET is newer than the self-assessment).")
3
Data-Based Decision Making for Tier 1 School-wide Positive Behavior Support Presented by Development 2

4
www.edprodevelopment.com Providing staff development and technical assistance to schools with 25 years of experience to Tennessee schools.

5
Please ensure that cell phones do not ring Create Your Name Tent! Restrooms are located…. Our Quiet Cue

6
9:30-9:45 11:30-12:30

7
TASL: 14 credit hours + 1 additional credit every 2 hours 9:30-9:45 11:30-12:30 2:15-2:30

8
Being Prompt Arrive at the designated time. Return from a break within designated time allotted. When timer goes off, finish conversation, and be ready for the quiet cue. Being Respectful Keep cell phones off or on vibrate. If you must take/receive a call or send a text message, please leave the room before answering the call or texting. Keep on your name tags. When responding to the quiet cue focus on the presenter and stay quiet. Being Involved Attend to workshop presenters quickly after quiet cue. Initiate pairs/group activities when directed. Work as a school or table team when requested and ensure all team members are engaged in the activity. Have fun!

9
Reward Ticket given by EdPro Staff Being PROMPT Being RESPECTFUL Being INVOLVED EdPro Development I caught

10
9

11
10

12
11

13
In your teams, create a poster to introduce your school to the rest of the group. You will have 2 minutes to plan, 2 minutes to create, and 2 minutes to share your teams poster with the group. On your poster please include: 1. Your school 2. Number staff and students 3. Where in the SWPBS process are you NOW?

14
Get out your Placemat Partners worksheet.

15
PLACEMAT PARTNERS _______________ My fork partner _________________ My plate partner _______________ My knife partner _______________ My spoon partner L O O K S L I K E T H I S

16
Get out your Placemat Partners sheet. Move around the room and find four different partners, one for each item in the place setting If someone signs your paper for fork, you must do the same for him/her. Once you have four different signatures on your placemat partners sheet, find your spoon partner and introduce yourselves and share your burning question about SWPBS data with each other. This is the first person with whom you will work in a little while. Keep your Placemat Partners sheet for both days of this workshop.

17
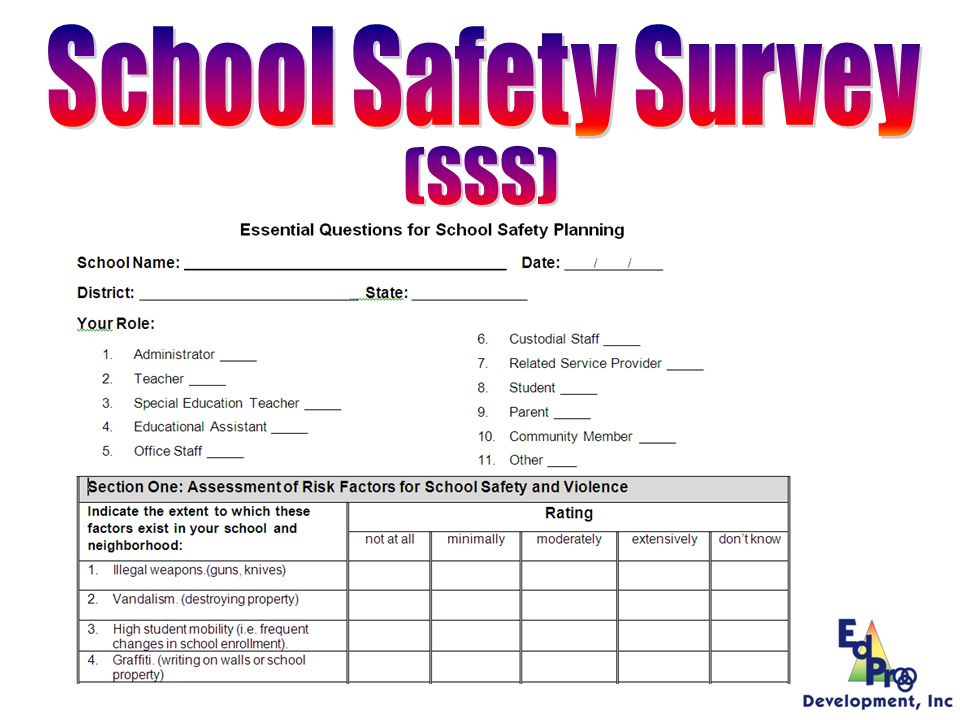
1.Become familiar with and use TIPS with SWIS data for effective decision-making. 2.Understand how precision statements, hypothesis development, and recommendations drive the development of the School-wide Evaluation Tool (SET) Report provided by your coaches. 3.Know how to collect and summarize data from the School Safety Survey. 4.Generate recommendations based on the results of the School Safety Survey and using the School Safety Survey Data Review Manual. 5.Use a process for reviewing end of year data and generating action plans.
 Report provided by your coaches. 3.Know how to collect and summarize data from the School Safety Survey. 4.Generate recommendations based on the results of the School Safety Survey and using the School Safety Survey Data Review Manual. 5.Use a process for reviewing end of year data and generating action plans..")
18
School teams are involved in regular meetings in which they are expected to identify problems and develop academic and behavioral solutions that improve the quality of the school as a learning environment. There is increasing access to data about student academic and behavior performance. There is a need to help teams identify how to use data productively… and efficiently. Workshop participants have been involved in regularly conducted Tier1/Primary Preventions team meetings and are fluent in effective and efficient meeting procedures.

19
Major Evaluation Questions Related to Desired Outcomes 1.Are our schools safe? Getting Safer? 2.Are we getting decreased problem behavior? 3.Are we implementing SWPBS with fidelity?

20
SWPBS Data Sources Office Discipline Referral Data Suspensions, Expulsions, Remands School-Wide Evaluation Tool (SET) School Safety Survey TCAP, Gateway, and benchmark tests
 School Safety Survey TCAP, Gateway, and benchmark tests")
21
For each data source, we want to know… Why do we need this data? Who collects the data? What is measured by the data? When are the data collected? How are the data summarized? Where do we go from here?

22
Efficient decisions/solutionsEfficient decisions/solutions Effective decisions/solutionsEffective decisions/solutions Informed decisions/solutionsInformed decisions/solutions Objective decisions/solutionsObjective decisions/solutions Timely decisions/solutionsTimely decisions/solutions Where Do We Go From Here?

23
Are we getting decreased problem behavior?

24
Review current status and identify problems early –Use data on a regular basis (every two weeks) to monitor key indicators, and identify problems before they become difficult Refine a problem statement to a level of precision that will allow functional solutions Use data to test possible solutions. Use data to assess if solutions are working –If many students are making the same mistake it typically is the system that needs to change not the students..

25
ODRs are recorded by ALL faculty and staff on students in the building who demonstrate behavior that violates one or more school rules. Paper form, often in triplicate, that documents important information concerning events surrounding an occurrence of problem behavior, including name of student, problem behavior, location, time, motivation, referring staff, date, and grade level. ODRs are universal across schools and, if designed effectively, will give school teams information to make informed decisions at least 80% of the time.

26
ODRs are turned in to a data recorder once the building administrator has intervened. The ODR information is entered into a discipline data management system (e.g., SWIS). Visual summaries are reviewed by the Tier 1/Primary Preventions team charged with reviewing the data AND with the full faculty and staff on a routine basis. Each time a student engages in rule violating behavior (any major OR multiple minors as per school procedures for documenting problem behavior.)
. Visual summaries are reviewed by the Tier 1/Primary Preventions team charged with reviewing the data AND with the full faculty and staff on a routine basis. Each time a student engages in rule violating behavior (any major OR multiple minors as per school procedures for documenting problem behavior.).")
27
An efficient system for gathering discipline data, web-based computer application for data entry and report generation, and practical process for using decision information for decision making. Summarizes office discipline referral information by (a) how often, (b) where, (c) when, (d) what and (e) who. Summaries provided in tables and graphs. Confidentiality protected. $250 per school per year annual fee (+$50 for CICO-SWIS). 7432 schools: 4410 Elementary, 1205 Middle, 598 High, 1219 K-8/12
 how often, (b) where, (c) when, (d) what and (e) who. Summaries provided in tables and graphs. Confidentiality protected. $250 per school per year annual fee (+$50 for CICO-SWIS) schools: 4410 Elementary, 1205 Middle, 598 High, 1219 K-8/12.")
28
SWIS TM OFFICE DISCIPLINE REFERRAL FORM Student(s) _________________ Referring Staff _____________ Grade Level ____ Date ______ Time ___ Location Classroom Playground Commons/common area Hallway/ breezeway Cafeteria Bathroom/restroom Gym Library Bus loading zone Parking lot On bus Special event/assembly/ field trip Other __________ Problem Behaviors (check the most intrusive) MINOR (Staff Managed) Inappropriate lang. Physical contact Defiance/disrespect/ non- compliance Disruption Property misuse Other _______________________ MAJOR (Office) Abusive lang./ inapprop. lang Fighting/ physical aggression Defiance/ disrespect/ insubordination Harassment/ tease/ taunt Disruption Tardy Skip class/ truancy Forgery/ theft Dress code violation Lying/cheating Tobacco Alcohol/drugs Combustibles Vandalism Property damage Bomb threat Arson Weapons Other __________
 Abusive lang./ inapprop. lang Fighting/ physical aggression Defiance/ disrespect/ insubordination Harassment/ tease/ taunt Disruption Tardy Skip class/ truancy Forgery/ theft Dress code violation Lying/cheating Tobacco Alcohol/drugs Combustibles Vandalism Property damage Bomb threat Arson Weapons Other __________.")
29
TIPS Team Initiated Problem Solving (Horner, Todd, Newton, Algozinne, and Algozinne) A five step process to define a problem and develop a workable implementation and evaluation plan
 A five step process to define a problem and develop a workable implementation and evaluation plan")
30
TIPS Four year grant 2008-2012 Goal: Develop a problem-solving model for school teams that results in active use of data to (a) define problems, (b) build solutions, and (c) transform solutions into practical action plans. Steve Newton, Anne Todd, Bob Algozzine, Kate Algozzine, Rob Horner

31
Goals Define logic for data use Define problem statements that can lead to functional solutions Define standards for using data to refine problem statements and build solutions Define core elements of behavioral solutions Assist teams with using data for problem solving

32
Main Idea The process a team uses to problem solve is important: –Roles : –Facilitator; Recorder; Data analyst; Active member –Organization –Agenda; Old business (did we do what we said we would do); New business; Action plan for decisions. –What happens BEFORE a meeting –What happens DURING a meeting –What happen AFTER a meeting

33
Main Ideas Decisions are more likely to be effective and efficient when they are based on data. The quality of decision-making depends most on the first step (defining the problem to be solved) Define problems with precision and clarity
 Define problems with precision and clarity.")
34
Improving Decision- Making Problem From: Solution

35
Common Errors in the Problem-Solution Sequence: Define solution before the problem Define broad problem that does not allow people to focus on functional solutions. Students are behaving in a disrespectful manner. Failure to use data to confirm/define problem One teacher states that cafeteria is out of control… Agree on solution without plan for implementation or evaluation Agree on solution but never to re-visit to determine if solution was implemented or if effective Serial problem solving without decisions – problem admiration Many solutions…limited implementation

36
Main Ideas Data help us ask the right questions…they do not provide the answers: Use data to –Identify problems –Refine problems –Define the questions that lead to solutions Data help place the problem in the context rather than in the students.

37
Improving Decision-Making Information for Problem Solving Problem From: To: Solution Problem Solution

38
Main Ideas Build decision systems not data systems Use data in decision layers –Is there a problem? (overall rate of ODR) –Localize the problem –(location, problem behavior, students, time of day) –Get specific Dont drown in the data Its OK to be doing well Be efficient
 –Localize the problem –(location, problem behavior, students, time of day) –Get specific Dont drown in the data Its OK to be doing well Be efficient.")
39
TIPS: Team Initiated Problem Solving 1.Determine if a problem exists. 2.Develop and refine hypothesis 3.Discuss and select solutions 4.Develop and implement an action plan/set of tasks addressing problem(s) 5.Evaluate and revise
 5.Evaluate and revise.")
40
Collect and Use and UseData Review Status and Identify Problems Develop and Refine Hypotheses Discuss and Select Solutions Develop and Implement Action Plan Evaluate and Revise Action Plan Team Initiated Problem Solving (TIPS) Model
 Model")
41
Identifying problems/issues What data to monitor –ODR per day per month –OSS, ISS, Attendance, Teacher report –Team Checklist/ SET (are we doing what we planned to do?) What question to answer –Do we have a problem? What questions to ask of Level, Trend, Peaks –How do our data compare with last year? –How do our data compare with national/regional norms? –How do our data compare with our preferred/expected status? If a problem is identified, then ask –What are the data we need to make a good decision?

42
Interpreting Office Referral Data: Is there a problem? Absolute level (depending on size of school) –High Schools (1/147) –Middle Schools (1/200) –Elementary Schools (1/454) –K-(8-12) (1/238) Trends –Peaks before breaks? –Gradual increasing trend across year? Compare levels to last year –Improvement?
 –High Schools (1/147) –Middle Schools (1/200) –Elementary Schools (1/454) –K-(8-12) (1/238) Trends –Peaks before breaks. –Gradual increasing trend across year. Compare levels to last year –Improvement .")
43
Collect and Use and UseData Review Status and Identify Problems Develop and Refine Hypotheses Discuss and Select Solutions Develop and Implement Action Plan Evaluate and Revise Action Plan Using the Team Initiated Problem Solving (TIPS) Model With SWIS Data
 Model With SWIS Data")
44
1.Determine if problem exists Using TIPS with SWIS Data (Horner, Todd, and Newton 2008)
")
45
Organizing Data for Decision-making Compare data across time Moving from counts to count/month

46
Total Office Discipline Referrals Data must be presented in a useful way for accurate decision- making.

47
Average Referrals Per Day Per Month

48
SWIS summary 2009-10 (Majors Only) 4,019 schools; 2,063,408 students; 1,622,229 ODRs Grade RangeNumber of Schools Mean Enrollment per school Median ODRs per 100 per school day K-62565452.22 6-9713648.50 9-12266897.68 K-(8-12)474423.42
 4,019 schools; 2,063,408 students; 1,622,229 ODRs Grade RangeNumber of Schools Mean Enrollment per school Median ODRs per 100 per school day K K-(8-12)")
49
Middle School of 625 students 625/200=3.23

50
Elementary School with 150 Students 150/454=.33

51
High School of 1800 students 1800/147=12.2

52
Middle School of 700 students 700/200=3.5

53
Middle School of 700 students

54
Middle School N= 495 495/200=2.5 Is There A Problem? Median Office Referrals/Day/Mo

55
Is There a Problem? N= 495 Median Office Referrals/Day/Mo

56
Middle School N= 495 Median Office Referrals/Day/Mo

57
Middle School N= 495 Median Office Referrals/Day/Mo

58
Collect and Use and UseData Review Status and Identify Problems Develop and Refine Hypotheses Discuss and Select Solutions Develop and Implement Action Plan Evaluate and Revise Action Plan Problem Solving Foundations Team Initiated Problem Solving (TIPS) Model
 Model")
59
1.Determine if problem exists 2.Develop and refine hypothesis Using TIPS with SWIS Data Define problems with precision

60
Using Data to Refine Problem Statements The statement of a problem is important for team-based problem solving. Everyone must be working on the same problem with the same assumptions. Problems often are framed in a Primary form, that creates concern, but that is not useful for problem-solving. Frame primary problems based on initial review of data Use more detailed review of data to build Solvable Problem Statements.

61
General versus Precision Statements General Statements –Too many referrals Precision Statements –There were an average of 8 ODRs/day/month for month of September –Gang behavior is increasing –September has more suspensions than last year –The cafeteria is out of control –Gang behavior has steadily increased at least 3 incidences for the last three months –There were 6 suspensions in September which was 3 more than last September –Problem behavior occurs most frequently in the cafeteria and accounts for 50 % of all office referrals

62
WHICH STATEMENT IS MORE PRECISE????

63
Precise or Primary Statement? Children are using inappropriate language with a high frequency in the presence of both adults and other children. This is creating a sense of disrespect and incivility in the school James D. is hitting others in the cafeteria during lunch, and his hitting is maintained by peer attention.

64
Precise or Primary Statement? ODRs during December are higher than in any other month. Minor disrespect and disruption are increasing over time, and are most likely during the last 15 minutes of our block periods when students are engaged in independent seat work. This pattern is most common in 7 th and 8 th grades, involves many students, and appears to be maintained by escape from work (but may also be maintained by peer attention… we are not sure).
..")
65
Precise or Primary Statement? Three 5 th grade boys are name calling and touching girls inappropriately during recess in an apparent attempt to obtain attention. Boys are engaging in sexual harassment

66
What are the data you are most likely to need to move from a Primary to a Precise statement? What problem behaviors are most common? –ODR per Problem Behavior Where are problem behaviors most likely? –ODR per Location When are problem behaviors most likely? –ODR per time of day Who is engaged in problem behavior? –ODR per student

67
Example Precision Statement There are more ODRs for aggression on the playground than last year. These are most likely to occur during first recess, with a large number of students.

68
What are the data you are most likely to need to move from a Primary to a Precise statement? What problem behaviors are most common? –ODR per Problem Behavior

69
What behaviors are problematic?

71
What are the data you are most likely to need to move from a Primary to a Precise statement? What problem behaviors are most common? –ODR per Problem Behavior Where are problem behaviors most likely? –ODR per Location

74
What are the data you are most likely to need to move from a Primary to a Precise statement? What problem behaviors are most common? –ODR per Problem Behavior Where are problem behaviors most likely? –ODR per Location When are problem behaviors most likely? –ODR per time of day

77
What are the data you are most likely to need to move from a Primary to a Precise statement? What problem behaviors are most common? –ODR per Problem Behavior Where are problem behaviors most likely? –ODR per Location When are problem behaviors most likely? –ODR per time of day Who is engaged in problem behavior? –ODR per student

78
Who is contributing to the problem? R eferrals per Student

79
Who is contributing to the problem?

80
1. Get out your Precise Statements Worksheet.

81
Precise Statements Worksheet Problem Statement General?Precise? 1. Children are using inappropriate language with a high frequency in the presence of both adults and other children. This is creating a sense of disrespect and incivility in the school. 2. James D. is hitting others in the cafeteria during lunch. 3 ODRs have leveled off; however, they remain above the national average. Girls are receiving more ODRs than boys, and these are occurring most frequently in the hallways. 4. ODRs during December are higher than in any other month. 5. Minor disrespect and disruption are increasing over time. This pattern is most common in 7th and 8th grades and involves many students. 6. Ninth graders are the worst behaved in the school. 7. Three 5th grade boys are name calling and touching girls inappropriately during recess. 8. Fighting occurred 12 times during October. These occurred around 9:30, 11:45, 12:30, and 2:15 which are our transition times.. 9. Average ODRs per month have increased to 11. They occur throughout the day in all locations. The problem behavior occurring most frequently is disrespect; however, several other problem behaviors are occurring. 10. Boys are engaging in sexual harassment.

82
1. Get out your Precise Statements Worksheet. With your spoon partner, identify each statement as a general or precise problem statement. Decide if the statement answers each of the following: Who? What? Where? and When? If it does not what information do you need and where will you get that information. 2. Next, change each general statement to a precise statement, noting what was missing.

83
Precise or General Statement? 1.Children are using inappropriate language with a high frequency in the presence of both adults and other children. This is creating a sense of disrespect and incivility in the school. 2.James D. is hitting others in the cafeteria during lunch. 3.ODRs have leveled off; however, they remain above the national average. Girls are receiving more ODRs than boys, and these are occurring most frequently in the hallways.

84
4.ODRs during December are higher than in any other month. 5.Minor disrespect and disruption are increasing over time. This pattern is most common in 7 th and 8 th grades and involves many students. 6.Ninth graders are the worst behaved in the school. 7. Three 5th grade boys are name calling and touching girls inappropriately during recess. Precise or General Statement?

85
8.Fighting occurred 12 times during October. These occurred around 9:30, 11:45, 12:30, and 2:15 which are our transition times. 9.Average ODRs per month have increased to 11. They occur throughout the day in all locations. The problem behavior occurring most frequently is disrespect; however, several other problem behaviors are occurring. 10.Boys are engaging in sexual harassment Precise or General Statement?

86
1.Determine if problem exists. 2.Develop and refine hypothesis. Using TIPS with SWIS Data Using TIPS with SWIS Data Define problems with precision Use accurate and current data to identify and refine problem statements

87
Use Accurate and Current Data The data must be believable by staff. The data should be current (no more than 48 hours old) The data should be in a format that provides information useful for decision- making
 The data should be in a format that provides information useful for decision- making.")
88
2.Develop and refine hypothesis Define problems with precision Use accurate and current data to identify and refine problem statements Develop hypothesis statements to explain the precision problem statements. Why is the problem sustaining? Why does it keep happening? Using TIPS with SWIS Data Using TIPS with SWIS Data

89
What are the data you are most likely to need to move from a Primary to a Precise statement? What problem behaviors are most common? –ODR per Problem Behavior Where are problem behaviors most likely? –ODR per Location When are problem behaviors most likely? –ODR per time of day Who is engaged in problem behavior? –ODR per student Why are problem behaviors sustaining? –Custom graph

90
Why Are Problem Behaviors sustaining?

91
Hypotheses = WHY IN WORDS SUCH AS… ~ We believe ~ We think ~ Because, etc.

92
Example Hypothesis Statement There are more ODRs for aggression on the playground than last year. These are most likely to occur during first recess, with a large number of students.and the aggression is related to getting access to the new playground equipment.

93
High school freshman have more office discipline referrals (ODRs) than sophomores, juniors, and seniors collectively. ODRs occur most frequently due to tardiness upon arrival to school and during class transitions. We believe this is because there is limited staff visible during transitions, staff that are visible are not reminding/prompting students to move on to next class, nor are they acknowledging students for getting to class on time at a rate that students need/are responding to. Example Hypothesis Statements

94
ODRs occur most frequently on the buses, both in the morning and afternoon, and are mostly for inappropriate language. ODRs are occurring in all buses. Twenty five different students have received at least one ODR while on the bus during August and September. We believe this is because there is little involvement of the bus drivers in the schools SWPBS efforts. Example Hypothesis Statements

95
For the third year in a row office referrals are highest in December and above the national average. Over 150 students (45% of the school) have at least one ODR. ODRs are occurring in both classroom and non-classroom settings and across the school day, and disruption is the most common problem behavior. We believe this is due to students AND staff becoming both anxious and excited about Christmas break. In addition, it could be that staff are less focused on implementing their primary preventions practices. Example Hypothesis Statements
 have at least one ODR. ODRs are occurring in both classroom and non-classroom settings and across the school day, and disruption is the most common problem behavior. We believe this is due to students AND staff becoming both anxious and excited about Christmas break. In addition, it could be that staff are less focused on implementing their primary preventions practices. Example Hypothesis Statements.")
96
Do you need additional information before you generate the WHY?

97
Collect and Use and UseData Review Status and Identify Problems Develop and Refine Hypotheses Discuss and Select Solutions Develop and Implement Action Plan Evaluate and Revise Action Plan Problem Solving Foundations Team Initiated Problem Solving (TIPS) Model
 Model")
98
1.Determine if a problem exists 2.Develop and refine hypothesis 3.Discuss and select solutions Brainstorm options Prioritize - Focusing Four - Delphi weighting procedure What is the most effective use of our resources to address this problem? Using TIPS with SWIS Data Using TIPS with SWIS Data

99
1.Determine if a problem exists 2.Develop and refine hypothesis 3.Discuss and select solutions Brainstorm options What is the most effective use of our resources to address this problem? Using TIPS with SWIS Data Using TIPS with SWIS Data

100
Brainstorm Record brainstormed ideas on chart paper. Elicit ideas only. No criticism or questions Push for between 8-18 ideas. Go for the Gusto!

101
Brainstorming Get in groups of four. Each take a card that describes your role (e.g., Negative Nellie, Polly Positive, Outrageous Oscar, & Level-Headed Lou). Select a facilitator for your group. Brainstorm what where you would want to vacation for two weeks in the US if you had all the money you needed to go and have fun.
. Select a facilitator for your group. Brainstorm what where you would want to vacation for two weeks in the US if you had all the money you needed to go and have fun..")
102
1.Determine if a problem exists 2.Develop and refine hypothesis 3.Discuss and select solutions Brainstorm options Prioritize - Focusing Four What is the most effective use of our resources to address this problem? Using TIPS with SWIS Data Using TIPS with SWIS Data

103
The Focusing Four Brainstorm Record brainstormed ideas on chart paper. Elicit ideas only. No criticism or questions. Push for between 8-18 ideas.Clarify Ask author for clarification if/where needed. Stop clarification when questioner indicates understanding. Condense and separate ideas per request. Team members need to defend request/need.

104
The Focusing Four (Cont) Advocate Team members may advocate for as many items and as many times as they wish. Advocacy must be brief and phrased in the positive.Canvass Ask team members to identify which 3 ideas they feel are most important. They do not need to be placed in rank order. Take a hand count to determine which items are of most importance to the group (majority vote).
..")
105
Focusing Four With your list generated during your Brainstorming Activity, use the Focusing Four to pick your top three ideas. A different group member should be identified as the facilitator for this activity.

106
1.Determine if a problem exists 2.Develop and refine hypothesis 3.Discuss and select solutions Brainstorm options Prioritize - Focusing Four - Delphi weighting procedure What is the most effective use of our resources to address this problem? Using TIPS with SWIS Data Using TIPS with SWIS Data

107
Example: Where should we go to lunch? Your group brainstorms and comes up with 4 options of where we could go to lunch. Burger KingBurger King ArbysArbys McAlistersMcAlisters Pizza HutPizza Hut Now each team member will individually assign each option a number of 1 thru 4, with 4 being his/her top option.

108
Example: Where should we go to lunch? One member of the team collects all the numbers given to each place. The option with the highest total score is the place we will all go to eat. OptionsTeam Member 1 Team Member 2 Team Member 3 Total A. Burger King34310 B. Arbys2349 C. McAlisters4127 D. Pizza Hut1214

109
First: Assign each potential solution a letter of the alphabet. For example, one team generated four solutions. They assigned each solution a letter of the alphabet as follows: A. Increase staff supervision A. Increase staff supervision B. Re-teach school rules in hallway B. Re-teach school rules in hallway C. Get students to create rules posters C. Get students to create rules posters D. Create directional signs for traffic flow D. Create directional signs for traffic flow

110
The solution believed to be MOST important to address, right now, given the considerations, is assigned the greatest number. The solution you believe is LEAST important to address right now is assigned the value of 1. Second, Each team member assigns a priority value to each solution, rank ordering the solutions from most to least important. The rank ordering, HOWEVER, occurs in a specific manner and is described as follows: 1 st 2 nd

111
The solution believed to be NEXT MOST important to address is assigned the value of the total number of identified behavior problems minus 1. The solution you believe is NEXT LEAST important to address right now is assigned the value of 2. Second, Each team member assigns a priority value to each solution, rank ordering the solutions from most to least important. The rank ordering, HOWEVER, occurs in a specific manner and is described as follows: 3 rd 4 th

112
The behavior believed to be the third most important to address (if there are five or more) is assigned the value of the total number of identified behavior problems minus 2. Continue on this pattern until all options are assigned a value. Second, Each team member assigns a priority value to each solution, rank ordering the solutions from most to least important. The rank ordering, HOWEVER, occurs in a specific manner and is described as follows: 5 th Etc.

113
Third, EACH teachers value is added to obtain a total sum value for each solution identified, thereby creating a rank order prioritization list. In the example provided: BehaviorTeacher 1 Assigned value Teacher 2 assigned value Teacher 3 assigned value Teacher 4 assigned value Total assigned value A. Increase supervision 244313 B. Re-teach 423211 C. Student Posters 332412 D. Signs 11114

114
Thus, team members rank ordered the solutions as follows: Most important: increase supervision (13) Next most important: students create rules posters (12) Next most important: re-teach (11) Least important: directional signs (4)
 Next most important: students create rules posters (12) Next most important: re-teach (11) Least important: directional signs (4)")
115
Fourth, team members are asked if there is a consensus of this weighted outcome. If not, discuss, and weight again until consensus is obtained. 5 4 3 2 1 0 I am all for this idea. I can be a leader Im for the idea. I can provide support. Im not sure but Im willing to accept the groups opinion. Im not sure. I need more discussion. I cant support it at this time. I need more information. No. I need an alternative I can support.

116
Delphi Weighting In your same groups, with your list generated during your Brainstorming Activity, use the Delphi Weighting procedure to pick your top three ideas.

117
Using Data to Build Solutions Prevention: How can we avoid the problem context? –Who, When, Where –Schedule change, curriculum change, etc Teaching: How can we define, teach, and monitor what we want? –Teach appropriate behavior –Use problem behavior as negative example Recognition: How can we build in systematic reward for desired behavior? Extinction: How can we prevent problem behavior from being rewarded? Consequences: What are efficient, consistent consequences for problem behavior? How will we collect and use data to evaluate (a) implementation fidelity, and (b) impact on student outcomes?
 implementation fidelity, and (b) impact on student outcomes .")
118
Define Problem By answering… Where When Who What Why What other info needed? Define Solution By answering Prevention Teaching Reward Extinction Corrective Consequences Monitoring

119
Precision Statement/Hypothesis What Where When Who Why What other info needed? Possible Solutions?

120
Solution Development Prevention Teaching Reward Extinction Corrective Consequence Data Collection

121
Problem Solving Action Plan Precise Problem Statement Solution Actions Who?When?Goal, Timeline, Rule & Updates

122
Examples Trevor Test Phoenix Elementary Langley Sandhill

123
Trevor Test Middle School 565 students Grades 6,7,8

124
Cafeteria Class Commons Hall 12:00 Lang. Defiance Disruption Harrass Skip

126
Precise Problem Statement & Hypothesis Development Many students from all grade levels are engaging in disruption, inappropriate language and harassment in cafeteria and hallway during lunch, and the behavior is maintained by peer attention A smaller number of students engage in skipping and noncompliance/defiance in classes, (mostly in rooms 13, 14 and 18), and these behaviors appear to be maintained by escape.
, and these behaviors appear to be maintained by escape.")
127
Solution Development: For disruption in hall and cafeteria Prevention *Teach behavioral expectations in cafeteria *Maintain current lunch schedule, but shift classes to balance numbers. Teaching Reward Establish Friday Five: Extra 5 min of lunch on Friday for five good days. Extinction Encourage all students to work for Friday Five… make reward for problem behavior less likely Corrective Consequence Active supervision, and continued early consequence (ODR) Data Collection Maintain ODR record and supervisor weekly report
 Data Collection Maintain ODR record and supervisor weekly report.")
128
Problem Solving Action Plan Precise Problem Statement Solution ActionsWho?When?Goal, Timeline, Rule & Updates Many students from all grade levels are engaging in disruption, inappropriate language and harassment in cafeteria and hallway during lunch, and the behavior is maintained by peer attention Prevention: Teach behavioral expectations in cafeteria Maintain current lunch schedule, but shift classes to balance numbers Teachers will take class to cafeteria; Cafeteria staff will teach the expectations Principal to adjust schedule and send to staff Rotating schedule on November 15 Changes begin on Monday Goal: Reduce cafeteria ODRs by 50% per month (Currently 24 per month average) Timeline: Review Data & Update Monthly A smaller number of students engage in skipping and noncompliance/defiance in classes, (mostly in rooms 13, 14 and 18), and these behaviors appear to be maintained by escape. Recognition: Establish Friday Five: Extra 5 min of lunch on Friday for five good days Extinction: Encourage all students to work for Friday Five… make reward for problem behavior less likely School Counselor and Principal will create chart & staff extra recess Principal to give announcement on intercom on Monday Corrective Consequence- Active supervision and continued early consequence (minor/major ODRs) Hall and Cafeteria SupervisorsOngoing Data Collection – Maintain ODR record & supervisor weekly report SWIS data entry person & Principal shares report with supervisors Weekly
 Hall and Cafeteria SupervisorsOngoing Data Collection – Maintain ODR record & supervisor weekly report SWIS data entry person & Principal shares report with supervisors Weekly.")
129
Phoenix Elementary Using Data For Decision-Making

130
You are the PBS team for Phoenix Elementary. 265 students k-5 Do you have a problem? Where? With Whom? What other information might you want? Given what you know, what considerations would you have for possible action?

131
Phoenix Elementary 265/100 = 2.65 2.65 x.34 =.901

132
Phoenix Elementary Problem Behaviors

133
Phoenix Elementary Locations Year One Year Two

134
Phoenix Elementary - Time

135
Phoenix Elementary Referrals Per Student (2 + Referrals)
")
136
Problem Statement Do we have a problem? Build a precise problem statement

137
Solution Development Prevention Teaching Reward Extinction Corrective Consequence Data Collection

138
Problem Solving Action Plan Precise Problem Statement Solution Actions Who?When?Goal, Timeline, Rule & Updates

139
Langley Elementary School 478 Students K-5

142
Precision Statement/Hypothesis What Where When Who Why What other info needed? Possible Solutions?

143
Solution Development Prevention Teaching Reward Extinction Corrective Consequence Data Collection

144
Problem Solving Action Plan Precise Problem Statement Solution Actions Who?When?Goal, Timeline, Rule & Updates

145
Sandhill High school 354 students

146
Sandhill High School: 354 students

147
Sandhill - Problem Behavior

148
Sandhill - Location

149
Sandhill –Referrals by Student

150
Sandhill - Time

151
Precision Statement/Hypothesis What Where When Who Why What other info needed? Possible Solutions?

152
Solution Development Prevention Teaching Reward Extinction Corrective Consequence Data Collection

153
Problem Solving Action Plan Precise Problem Statement Solution Actions Who?When?Goal, Timeline, Rule & Updates

154
Team Training & Follow Up Swift at SWIS Training Team Meetings: –First time: Simulated Data –Second time: Use First Month of Data –Third time: Problem Solving Statements

155
Trevor Test Middle School 565 students: Grades 6,7,8

156
Trevor Test Middle School

157
Cafeteria Class Commons Hall 12:00 Lang. Defiance Disrespect Harass Skip

158
Precision Statement/Hypothesis Define Problem What Where When Who Why What other info needed? Define Solution Prevention Teaching Reward Extinction Corrective Consequences Monitoring

159
Trevor Test Middle School Problem Statement WHAT: Increasing trend in frequency of problem behavior WHAT: Two problems: –disrespect, insubordination, inappropriate language, and harassment –Skipping class WHERE: Cafeteria WHEN: Most problem behaviors occur during the noon lunch time WHO: About 24 students with 2-5 ODRs

160
Problem Statement Preliminary: –There is an increase in office discipline referrals from Sept to Jan, and the increase is resulting in more referrals than we consider acceptable, and more than is typical of national norms. Precise: –Inappropriate language, harassment, disrespect and defiance toward staff is occurring in the cafeteria, before, during and after lunch. WHY: Many students and we are unclear what is maintaining these behaviors. –We believe over-crowding may be a factor, and we did not teach school-wide expectations in cafeteria.

161
Solution Development Prevention *Teach behavioral expectations in cafeteria *Maintain current lunch schedule, but shift classes to balance numbers. Teaching Reward Establish Friday Five: Extra 5 min of lunch on Friday for five good days. Extinction Unclear Corrective Consequence Active supervision, and continued early consequence Data Collection Maintain ODR record and report weekly

162
Trevor Test Middle School

166
Information needed to move from a General to a Precise statement Where are problem behaviors most likely? –ODR per Location When are problem behaviors most likely? –ODR per time of day Who is engaged in problem behavior? –ODR per student

167
If more than 35% of referrals come from non-classroom settings If there are more than 2.5 office discipline referrals per student If more than 50% of referrals come from less than 10% of the classroom If a small number of students destabilizes the overall functioning of the school If less than 10 students continue the same rate of referrals after receiving targeted group support Targeted Group Interventions Individual system with Action Team Structure Non- classroom system If less than 10 students receive more than 10 office discipline referrals If more than 40% of students received one or more office discipline referrals School- wide System If more than 60 % of office discipline referrals come from the classroom. Classroom System If there are more than 15% of students receiving referrals from non- classroom settings If more than 10- 15 students receive more than 5 office discipline referrals SWIS TM General Data Decision Rules

168
Referrals per Student Who is contributing to the problem?

169
Referrals per Student

170
Trevor Test Middle School

172
Information needed to move from a General to a Precise statement Where are problem behaviors most likely? –ODR per Location When are problem behaviors most likely? –ODR per time of day Who is engaged in problem behavior? –ODR per student What problem behaviors are most common? –ODR per Problem Behavior

176
Trevor Test Middle School

178
Combining the graphs you have just looked at, what is the problem at this school?

179
Trevor Test Middle School: Problem Statement Increasing trend in frequency of problem behavior About 24 students with 2-5 ODRs Two problems –Most problem behaviors occur during the noon lunch time and include disrespect, insubordination, inappropriate language, and harassment –Skipping class is also a problem

180
Problem Statement General: – There is an increase in office discipline referrals from Sept to Jan, and the increase is resulting in more referrals than we consider acceptable, and more than is typical of national norms.

181
Information needed to move from a General to a Precise statement What problem behaviors are most common? –ODR per Problem Behavior Where are problem behaviors most likely? –ODR per Location When are problem behaviors most likely? –ODR per time of day Who is engaged in problem behavior? –ODR per student

182
Trevor Test Middle School Using the available data, change your general statement to a precise problem statement.

183
Problem Statement General: –There is an increase in office discipline referrals from Sept to Jan, and the increase is resulting in more referrals than we consider acceptable, and more than is typical of national norms. Precise: –Inappropriate language, harassment, disrespect and defiance toward staff is occurring in the cafeteria, before, during and after lunch. Many students are engaging in behaviors and we are unclear what is maintaining these behaviors.

184
Trevor Test Middle School Generate a hypothesis based the your precision problem statement.

185
Problem Statement General: – There is an increase in office discipline referrals from Sept to Jan, and the increase is resulting in more referrals than we consider acceptable, and more than is typical of national norms. Precise: – Inappropriate language, harassment, disrespect and defiance toward staff is occurring in the cafeteria, before, during and after lunch. Many students are engaging in behaviors and we are unclear what is maintaining these behaviors. …Moving into hypothesis – We believe over-crowding may be a factor, and we did not teach school-wide expectations in cafeteria.

186
Trevor Test Middle School Complete the Solution Development Table for Trevor Test Middle School

187
Solution Development Prevention*Teach behavioral expectations in cafeteria *Maintain current lunch schedule, but shift classes to balance numbers. Teaching RewardEstablish Friday Five: Extra 5 min of lunch on Friday for five good days. ExtinctionUnclear Corrective Consequence Active supervision, and continued early consequence Data CollectionMaintain ODR record and report weekly

188
Collect and Use and UseData Review Status and Identify Problems Develop and Refine Hypotheses Discuss and Select Solutions Develop and Implement Action Plan Evaluate and Revise Action Plan Problem Solving Foundations Team Initiated Problem Solving (TIPS) Model
 Model")
189
TIPS: Team Initiated Problem Solving (Adapted from: Horner, Todd, and Newton 2008) 1.Determine if problem exists 2.Develop and refine hypothesis 3.Discuss and select solutions 4.Develop and implement an action plan/set of tasks addressing problem(s)
 1.Determine if problem exists 2.Develop and refine hypothesis 3.Discuss and select solutions 4.Develop and implement an action plan/set of tasks addressing problem(s)")
190
Be accountable. Use data to evaluate implementation and impact For every decision, define actions & timelines Record who, what, & by when for each decision Continually share information with staff The people who implement a solution should be involved in (a) defining the problem and (b) selecting the solution Conduct regular fidelity and social validity checks –intervention implemented as planned –staff and student satisfaction –update tasks/actions
 defining the problem and (b) selecting the solution Conduct regular fidelity and social validity checks –intervention implemented as planned –staff and student satisfaction –update tasks/actions.")
191
190

192
Agenda

193
Collect and Use and UseData Review Status and Identify Problems Develop and Refine Hypotheses Discuss and Select Solutions Develop and Implement Action Plan Evaluate and Revise Action Plan Problem Solving Foundations Team Initiated Problem Solving (TIPS) Model
 Model")
194
Step 5: Evaluate and Revise Action Plan Revisit Action Plan items –Review status and identify problem…. The TIPS cycle continues –Document as you go –Date everything TIPS: Team Initiated Problem Solving (Adapted from: Horner, Todd, and Newton 2008)
.")
195
Get out your Solution Development Sheet from your handouts. Using TIPS Process, with your school team colleagues, generate an action plan based on your own SWIS data. Enrollment Office discipline referrals Draw the comparator line Do we have a problem? What systems are problematic? Who is involved? Build a hypothesis Refine the hypothesis Identify possible solutions: (Prevention, Teaching, Rewarding, Extinction, Corrective Action) Test solutions against available data What additional data would you like to have?
 Test solutions against available data What additional data would you like to have .")
196
SWPBS Primary/Tier 1 Team Meeting Agenda PHASE I (ONE) _________________School _____________, 2009 Ground Rules : Need to establish some (20 minutes) ~ Review from workshop and add to….. 1. 2. 3. 1.Celebrations (3 minutes) 2.Agenda Review (2 minutes) 3.Overview of SWPBS (10 minutes) A. Task review B. Someone demonstrate how to explain SWPBS to an uninformed person OR Quiz. C. Tasks negotiated today 4.Faculty and Staff Support is 80% (10 minutes) Insert graphs from Self Assessment here 5. Team Composition (10 minutes) A. Do we have all of appropriate people at the table B. Team has established a clear mission/purpose that does not overlap with other teams mission/purpose C. Team has shared mission/purpose with all faculty and staff 6.Review of SWIS Data (30 minutes – typically) A. Task Review B. Celebrations C. Precision Problem Statements D. Hypothesis Statements E. Solutions F. Tasks Negotiated Today DATES Facilitator Creates agenda and guides meeting Scribe Takes notes and copies for all Timekeeper Monitors time on agenda items Taskmaster Writes tasks and copies for all Rudder Ensures team stays on task (agenda) Encourager Checks task status, assists if help is needed Equalizer Ensures everyone is able to participate in discussion Jargon Buster Asks for clarification on unknown/confusing terms. SWPBSer Explains SWPBS for this meeting during Overview of SWPBS
 2.Agenda Review (2 minutes) 3.Overview of SWPBS (10 minutes) A. Task review B. Someone demonstrate how to explain SWPBS to an uninformed person OR Quiz. C. Tasks negotiated today 4.Faculty and Staff Support is 80% (10 minutes) Insert graphs from Self Assessment here 5. Team Composition (10 minutes) A. Do we have all of appropriate people at the table B. Team has established a clear mission/purpose that does not overlap with other teams mission/purpose C. Team has shared mission/purpose with all faculty and staff 6.Review of SWIS Data (30 minutes – typically) A. Task Review B. Celebrations C. Precision Problem Statements D. Hypothesis Statements E. Solutions F. Tasks Negotiated Today DATES Facilitator Creates agenda and guides meeting Scribe Takes notes and copies for all Timekeeper Monitors time on agenda items Taskmaster Writes tasks and copies for all Rudder Ensures team stays on task (agenda) Encourager Checks task status, assists if help is needed Equalizer Ensures everyone is able to participate in discussion Jargon Buster Asks for clarification on unknown/confusing terms. SWPBSer Explains SWPBS for this meeting during Overview of SWPBS.")
197
WH O? Qwertyuiop[]\;lkjhgfdsazxcvbnm,./ Qweiojhgfdsazxcvbn Qwerty[]\;lkjhgfdsazxcvbnm,./ Qweiojhgfdsazxcvbn

199
?? ?

200
3Data source for evaluating Are discipline problems decreasing? 3Reflect fidelity of implementing SWPBS practices 3Should be reviewed at least quarterly

202
To be completed throughout the year and reviewed at the last team meeting of the year Reviews SET, Self-Assessment, SSS, and SWIS data Highlights celebrations and labels SWPBS features for improvement for the next year End of the Year Data Review and Planning Organizer

203
End of year SWIS data includes: –Major problem behaviors –Location of problem behaviors –When problem behaviors are occurring –Suspensions/expulsions –SWIS triangle data End of the Year Data Review and Planning Organizer

204
SWIS End of Year Triangle Data –Green = Percent of students with 0-1 ODR –Yellow = Percent of students with 2-5 ODRs –Red = Percent of students with 6 or more ODRs

205
Directions for completing at the end of the year: Have team members pair up or get into groups of 3-4 Each pair/group: – reviews a different tool/piece of data (e.g. SET, SSS, Self- assessment, End of Year SWIS data), –identifies status of specific systems/features, and –records that information either on this page or the attached page. Record celebrations and systems/features which are in place on the first page; Record systems/features and things that are partially in place/not in place on the second page. End of the Year Data Review and Planning Organizer
, –identifies status of specific systems/features, and –records that information either on this page or the attached page. Record celebrations and systems/features which are in place on the first page; Record systems/features and things that are partially in place/not in place on the second page. End of the Year Data Review and Planning Organizer.")
208
Complete the End of Year Planning Organizer with your schools SWIS data. The remaining portions of the Planning Organizer will be completed during the remainder of this workshop.

211
The SET is conducted by an outside coach or consultant. The head administrator, at least 15 staff members and 15 students are randomly chosen to be interviewed. The SET assesses how well SWPBS Tier 1/primary preventions are being implemented in a building and allows teams to measure progress from year to year. Teams use SET results to revise annual action plans.

212
Schools must continually assess how effective Tier 1/primary preventions are being implemented. Tier 1/Primary preventions are considered in place when schools achieve an 80/80 criteria on the SET. Attaining 80/80 criteria is also associated with a decrease in problem behavior. At the beginning of implementation for baseline data, and thereafter on an annual basis in October.

213
The SET is a combination of direct observations and interviews conducted by the district coach or outside consultant. As a result, a school receives a score, chart, and SET report containing the outcomes of the SET with subsequent recommendations. Commendations, hypotheses, and recommendations should be shared with all faculty and staff. Recommendations are addressed throughout the year.

214
Example Elementary School SET Results 2 Year Comparison 80/80 Criteria

215
Example High School SET Results 2 Year Comparison

216
Locate your SET Features Chart.

218
Locate your SET Features Chart and features thumbnails. When we tell you to move, please take this and a writing utensil with you. PLATE Find your PLATE partner. Mark the statements on each feature slide in your thumbnails with + if you think it is present and measureable in your school and - if it is not present or measureable. On the SET Features Chart write down what you need to do in your school to score well on the SET. Be prepared to share.

219
Return to your school team and discuss what evidence you need and compare what each of you generated.

220
Expectations Defined All faculty and staff have had input and agreed upon 3-5 school-wide rules All faculty and staff have had input and agreed upon the behavioral expectations that define those rules The rules AND expectations are posted all over the school The rules AND expectations are posted in formats that ALL students can read e.g., pictures, symbols, words, etc.

221
All students can recite the rules and expectations. All adults can recite the rules and expectations. There is a SYSTEM/plan for teaching ALL students the behavioral expectations. The system/plan is codified in teacher handbooks or other source. All faculty and staff are involved in some way in teaching the behavioral expectations. The primary team reviews pertinent information with the full faculty and staff at the beginning of the year. All new faculty and staff are taught the discipline system. Behavioral Expectations Taught

222
System for Rewarding/Acknowledging Behavioral Expectations There is a SYSTEM/plan for rewarding student BEHAVIOR. The system/plan is codified in teacher and student handbooks or other source. Students receive rewards. ADULTS in the building give out rewards.

223
System for Responding to Behavioral Violations There is a SYSTEM/plan for responding to rule violations. The system/plan is codified in teacher and student handbooks or other source. Adults agree with administration on what is office managed and what is staff managed. There is a documented crisis plan. Adults agree with administration on how to respond to extreme emergencies.

224
Monitoring and Decision Making School uses a discipline referral form that includes: student, grade, date, time, referring staff, problem behavior, location, persons involved, probable motivation, &administrative decision School uses a clearly defined system for collecting and summarizing discipline referrals. Administration explains how that system works. Team shares data from discipline system (above) with all faculty and staff at least 3 times per year. Team uses discipline data to make decisions about school-wide issues.
 with all faculty and staff at least 3 times per year. Team uses discipline data to make decisions about school-wide issues..")
225
Management School improvement plan includes school-wide discipline as one of top three goals. All adults are aware of the primary preventions team and its functions. The primary preventions team includes representation of the entire school. The primary preventions team has at least one team leader that is accepted by all team members. The administrator is an ACTIVE member of the primary preventions team. The team meets at least monthly. The team reports progress of primary system to entire staff at least three times per year. The primary team has an action plan that guides their work that is less than one year old.

226
District Level Support School budget contains allocation to support and sustain SWPBS, at all three tiers. The administration identifies an out of school liaison who supports the team and school in implementing SWPBS.

227
Making Effective, Data-Based Decisions from SET Results 1. Coach reviews status and defines problems with precision 2. Coach uses accurate and current data to identify and refine problem statements 3. The team should understand how scores and recommendations were determined and have choices of recommendations. 4. Use annual SET data as a source of accountability for evaluating the implementation and impact of the SET recommendations selected.

228
Precision Problem Statements (What data do we need to make effective decisions based on SET results?) – What feature(s) is/are less than 80% in place? – What practice(s) was/were least evident within each feature? – Who is responsible for putting the practice(s) into place? For ensuring the practice(s) are accurately implemented? – Where were the practices most likely and least likely to be evident. – When were the practices most likely and least likely to occur.
 was/were least evident within each feature. – Who is responsible for putting the practice(s) into place. For ensuring the practice(s) are accurately implemented. – Where were the practices most likely and least likely to be evident. – When were the practices most likely and least likely to occur..")
229
Example Recommendations: Although 100% of staff stated that they had given Hawk Wings" to students for following the school-wide rules this year, only 33% (5/15) of students reported they had actually received one. Consider one or more of the following actions: 1. All faculty and staff increase the rates and frequencies with which Hawk wings are given out to students. 2. Ensure that students who routinely follow rules receive Hawk wings", not just students who frequently break the rules. 3. Codify your incentive system 4. Ensure all faculty and staff have access to Hawk Wings and know how to secure more when needed.

230
1. Get out your SET report. 2. Review your recommendations. 3. Prioritize recommendations using Delphi Weighting, checkmark method or Focusing Four. 4. Generate Tasks. Include (a) WHO will complete, (b) WHEN action/task will be completed, and (c) DATA documenting evidence of task completion. 5. Record these on your team task list. 6. Complete the SET portion of the Planning Organizer Share
 WHO will complete, (b) WHEN action/task will be completed, and (c) DATA documenting evidence of task completion. 5. Record these on your team task list. 6. Complete the SET portion of the Planning Organizer Share.")
232
Data Analyst Function/Role 1.Understand how the report was scored. Ask questions for the team in preparation for team member questions. 2.Understand the origins and content of the recommendations. Ask the coach for clarification in preparation for team member questions. 3.Facilitate prioritizing recommendations for the year.

233
???
235
The SSS is completed by ALL faculty and staff and 4 students from each homeroom/class in grades 4 and above. The School Safety Survey is a web-based instrument developed to obtain an efficient index of perceived school safety and to generate actions creating safe/safer schools.

236
The SSS is a web-based survey completed by individuals. Students in upper grades can complete the survey by filling in responses like the adults. Students in lower grades will take a different version of the survey that provides more extensive explanation of questions. Annually in March/April

237
This survey provides a summary of "risk factors" and response plans" that can be useful in determining training and support needs related to school safety and violence prevention. The primary preventions team should review the risk factors and corresponding responses and generate tasks accordingly.

238
Get out your School Safety Survey From Survey Monkey.Com Spend three minutes reviewing the survey and generating questions/potential questions from your faculty, staff, or students. ???????

239
School Safety Data Participants

240
School Safety Results Risk Factors by Adult and Student Participants Response Plans by Adult and Student Participants

241
School Safety Results

245
SSS Data Review Manual A step-by-step guide for making sense of the survey results Uses graphs from the School Safety Excel document, sent to your coaches, to identify strengths and weakness in school safety and violence prevention Bridges team thinking from recognizing weaknesses to developing an action plan to address the weakness

246
1.With the Sample School Safety Survey Data Review Manual find your Knife partner. 2.With your Knife partner, complete the Sample SSS Data Interpretation Manual as directed by the presenter. For this activity, please stay with the group as best you can.

247
School Safety Survey Interpretation: Respondents Role Table: 1. What percentage of the adults completed the safety survey? The goal is for all adults in the school to complete and return the survey. ______% 89 In this example, there are 55 adults working in the school. The first thing to look at when reviewing the safety survey results is the number of adults and students who gave feedback.

248
School Safety Survey Interpretation: Respondents Role Table: 2. How many students per certified teacher/homeroom teacher completed the survey? The goal is that 4 students per homeroom teacher will complete and return the survey. ________ students and ________% of students suggested (# of students/ (# of homeroom teachers x 4)) 103 86 In this example, there are 30 homeroom teachers. The first thing to look at when reviewing the safety survey results is the number of adults and students who gave feedback.
) In this example, there are 30 homeroom teachers. The first thing to look at when reviewing the safety survey results is the number of adults and students who gave feedback..")
249
School Safety Survey Interpretation: Risk Factors 1.Summarize Combined Data and Look for Differences between Adults & Students What percent of adults and students thought risk factors were moderately to extensively present? ______% of adults and ______% of students What percent of adults and students thought risk factors were not at all to minimally present? ______% of adults and ______% of students What percent of adults and students did not know if risk factors were prevalent in their school? ______% of adults and ______% of students 35.6 20.1 58.059.9 8.7 20.0

250
School Safety Survey Interpretation: Risk Factors 2.Determine the General Trend For risk factors, recognize that you are looking for both adult and student bars to be higher on the not at all and minimally end and lower on the moderately and extensively end. Ignore the dont know responses for this trend. What is the general trend for your schools responses? The general trend is in the correct direction, with there being fewest extensively responses. However, our goal should be to increase not at all responses.

251
School Safety Survey Interpretation: Review of Individual Risk Factors 1. Always start by looking at the positives (what is going well) If the green lines or not at all to minimally data are above the 80% goal line, indicated in blue, the risk factor appears to be under control to the adults or students. Which risk factors are not prevalent? According to whom? (1) Illegal Weapons – both students and adults (2) Child Abuse – adults only (3) Gang Activity – adults (student response at 73%)
 If the green lines or not at all to minimally data are above the 80% goal line, indicated in blue, the risk factor appears to be under control to the adults or students. Which risk factors are not prevalent. According to whom. (1) Illegal Weapons – both students and adults (2) Child Abuse – adults only (3) Gang Activity – adults (student response at 73%).")
252
School Safety Survey Interpretation: Review of Individual Risk Factors 2. Next, pay close attention to the red lines or extensively data. These are the areas that need to be addressed by the primary team making recommendations for action school-wide. Pay particular attention to item #16 Bullying Which risk factors were prevalent? According to whom? (1) Poor School Condition – adults (2) Truancy – adults (3) Bullying – both
 Poor School Condition – adults (2) Truancy – adults (3) Bullying – both.")
253
School Safety Survey Interpretation: Review of Individual Risk Factors 2. (continued) What are some possible actions? (1)Poor School Condition – repaint, use detentions for clean up (2) Truancy – increase incentives for being on time, involve parents (3) Bullying – inservice on responding to bullying, incorporate anti-bullying into expectations matrix
 What are some possible actions. (1)Poor School Condition – repaint, use detentions for clean up (2) Truancy – increase incentives for being on time, involve parents (3) Bullying – inservice on responding to bullying, incorporate anti-bullying into expectations matrix.")
254
School Safety Survey Interpretation: Review of Individual Risk Factors 3. Are differences seen between adult and student perceptions? This may be a sign that adults in the school are not present in situations where the risk factor is seen the most. Which risk factors are perceived by students to be more prevalent than by adults? Fights, conflicts, and assaults – small difference, is this difference significant to my school?

255
1. 89% of the adults and 86% of the students responded to the SSS. 2. 35.6% of the adults and 20.1% of students thought the risk factors were moderately to extensively present. 58% of the adults and 59.9% of the students thought the risk factors were not at all to minimally present. 8.7% of the adults and 20% of the students did not know if risk factors were prevalent in their schools. 3. In general the trend for risk factors is going in the expected direction, however, there is a need for an increased percentage of students and adults reporting that risk factors are not at all or minimally present. 4. Risk factors least prevalent reported by both students and adults were illegal weapons. Gang activity was next least prevent reported by the adults and students. Adults reported child abuse to be least prevalent. 5. Risk factors most prevalent were poor school conditions and truancy reported by adults and bullying reported by both adults and students; however, fights and assaults were reported slightly more prevalent by the students than by the adults. Potential solutions: SSS Precision Statements – Risk Factors

256
School Responses to SSS Positive Behavior Support Student Feedback Survey Answer each question honestly and in detailed responses. Please write in print. 1. Define gang. 2. Are there gangs at S.C.H.S.? 3. What gang activities are present? Explain. 4. Have you been personally affected by gang activity? Explain.

257
School Safety Survey Interpretation: Response Plans 1.Summarize Combined Data and Look for Differences between Adults & Students What percent of adults and students thought response plans were moderately to extensively present? ______% of adults and ______% of students What percent of adults and students thought response plans were not at all to minimally present? ______% of adults and ______% of students What percent of adults and students did not know if response plans were prevalent in their school? ______% of adults and ______% of students 71.2 54.9 25.827.5 3.0 17.7

258
School Safety Survey Interpretation: Response Plans 2.Determine the General Trend For response plans, recognize that you are looking for both adult and student bars to be higher on the moderately and extensively end and lower on the not at all and minimally end. Ignore the dont know responses for this trend. What is the general trend for your schools responses? The general trend is in the correct direction, with there being fewest not at all responses. However, our goal should be to increase extensively responses.

259
School Safety Survey Interpretation: Review of Individual Response Plans 1. Always start by looking at the positives (what is going well) If the green lines or moderately to extensively data are above the 80% goal line, indicated in blue, the response plans appears to be well recognized by the adults or students. Which response plans are prevalent? According to whom? (1)Extracurricular Activities – both students and adults (2)Effective student-teacher relationships – adults (3) Positive School Climate – adults
 If the green lines or moderately to extensively data are above the 80% goal line, indicated in blue, the response plans appears to be well recognized by the adults or students. Which response plans are prevalent. According to whom. (1)Extracurricular Activities – both students and adults (2)Effective student-teacher relationships – adults (3) Positive School Climate – adults.")
260
School Safety Survey Interpretation: Review of Individual Response Plans 2. Next, pay close attention to the red lines or not at all data. These are the areas that need to be addressed by the primary team making recommendations for action school-wide. Which response plans were not recognized? According to whom? (1)Suicide Prevention – students(2) Involved Parents – students (3) Effective Student-Teacher Relationships – students
Suicide Prevention – students(2) Involved Parents – students (3) Effective Student-Teacher Relationships – students.")
261
School Safety Survey Interpretation: Review of Individual Response Plans 2. (continued) What are some possible actions? (1)Suicide Prevention – post crisis hotline phone numbers in student areas (2) Involved Parents – create role of parent liaison to consult on ways to get parents involved, host an event involving food and child care to get parents input or advice (3) Effective Student-Teacher Relationships – increase positive to negative ratio, implement 2x10 for teachers and students without a good relationship
 What are some possible actions. (1)Suicide Prevention – post crisis hotline phone numbers in student areas (2) Involved Parents – create role of parent liaison to consult on ways to get parents involved, host an event involving food and child care to get parents input or advice (3) Effective Student-Teacher Relationships – increase positive to negative ratio, implement 2x10 for teachers and students without a good relationship.")
262
School Safety Survey Interpretation: Review of Individual Response Plans 3. Are differences seen between adult and student perceptions? This may be a sign that adults in the school are not aware of student perceptions. Which response plans are less recognized by students than by adults? Effective Student-Teacher Relationships – why does that faculty think they have good relationships but the students think the relationships are not as effective?

263
School Responses to SSS Crisis Numbers Adolescent Crisis Intervention & Counseling Nineline 1-800-999-9999 Domestic Violence Hotline/Child Abuse 1-800-4-A-CHILD (1 800 422 4453) National Adolescent Suicide Hotline 1-800-621-4000 National Suicide Hotline 1-800-SUICIDE (1 800 784 2433) National Child Abuse Hotline 1-800-422-4453 National Drug Abuse Hotline 1-800-662-HELP (1 800 662 4357) Pregnancy Hotline 1-800-4-OPTIONS (1 800 467 8466) Rape, Abuse, Incest, National Network (RAINN) 1-800-656-HOPE (1 800 656 4673) Self-Injury Hotline SAFE (Self Abuse Finally Ends) Alternatives Program www.selfinjury.com 1-800-DONT CUT (1 800 366 8288) Youth Crisis Hotline 1-800-448-4663 1-800-422-0009
 National Adolescent Suicide Hotline National Suicide Hotline SUICIDE ( ) National Child Abuse Hotline National Drug Abuse Hotline HELP ( ) Pregnancy Hotline OPTIONS ( ) Rape, Abuse, Incest, National Network (RAINN) HOPE ( ) Self-Injury Hotline SAFE (Self Abuse Finally Ends) Alternatives Program DONT CUT ( ) Youth Crisis Hotline")
265
1. Which risk factors or response plans are not recognized by the adults or students? The dont know responses have been ignored up to this point. Which items? According to whom? School Safety Survey Interpretation: Dont Know Responses (1)Child Abuse in the Home – both(2) Truancy – students (3) Collaboration with Community – students(4) Suicide Prevention - both
Child Abuse in the Home – both(2) Truancy – students (3) Collaboration with Community – students(4) Suicide Prevention - both.")
266
Complete the School Safety Data Review Manual 1.Get with your school team colleagues. 2.Get out blank SSS Data Interpretation Manual from your notebook and SSS data from your school packet. 3.Using the SSS data interpretation manual with SSS charts, generate actions for your school. 4.Complete the SSS portion of the Planning Organizer.

267
Share What information did you get from the data? Does the adult and student information match? Which risk factors and response plans should be the highest priority for this school? What are some possible actions to address the needs of this school? Do the dont know responses show an area that would benefit from a marketing plan?

268
Completing the Web-Based School Safety Survey Link to survey will be emailed to coaches in late March. Coaches will send link to team members as soon as it is received. Survey will need to be completed within 2 weeks – ALL adults and a representative sample of 4 students per homeroom teacher/home-base teacher. Excel with collected information from your school will be emailed to coach by the end of April.

269
School Safety Survey Online Excludes child abuse and suicide items

270
School Safety Survey Online: Adult & Students in 6 th Grade and Above

271
School Safety Survey Online: 4 th – 5 th Grade Students

272
School Safety Survey Online: Open Response Questions

274
Data Analyst Function/Role 1.Be intimately familiar with the content of the SSS. 2.Review the comments, looking for striking comments to share with team. 3.Generate precision statements based on the SSS data using the SSS Data Review Manual as a guide. 4.Facilitate brainstorming to generate possible solutions. 5.Facilitate team prioritizing actions for EOY action plan.

275
???
277
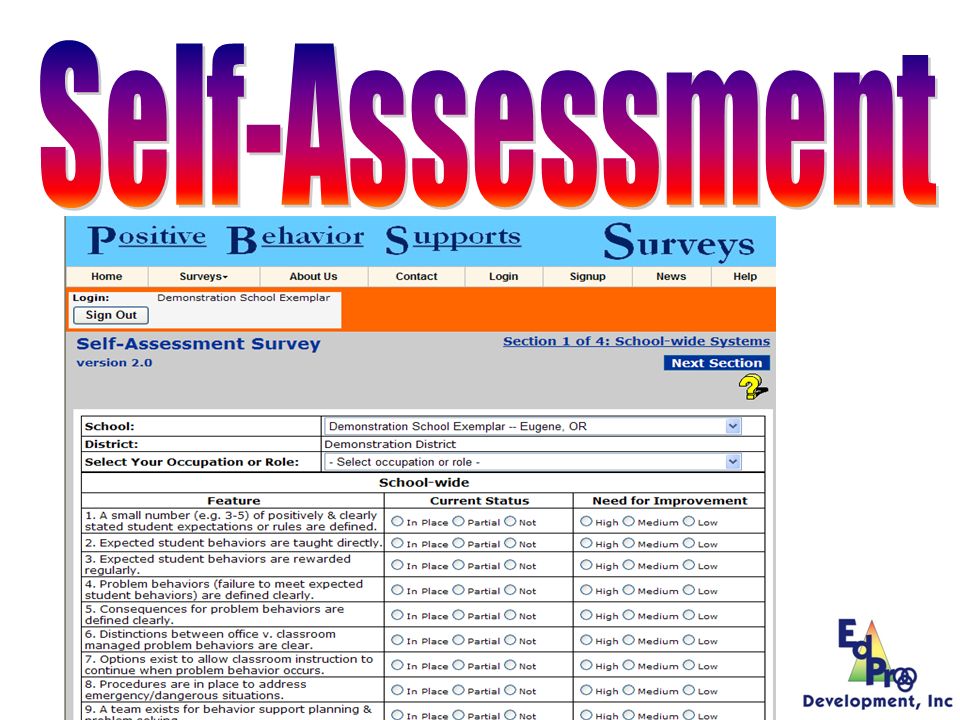
The Self-Assessment is completed by ALL faculty and staff with in your building. The Self-Assessment survey will help determine what the staff perceive to be already in place and what the staff believe to be a priority. At the beginning of implementation for baseline data, and thereafter on an annual basis in April.

278
Use the Self-Assessment as one tool for evidence of buy-in by faculty and staff. Eighty percent of faculty and staff must see the goals as measured by the Self Assessment as a high or medium priority to pursue SWPBS efforts, efficiently. If staff buy in is NOT 80%, then pursue the buy in activities listed on the Getting Started Flow Chart. (Available at edprodevelopment.com)
.")
279
Self-Assessment: When starting the SWPBS journey... Do we have buy-in?? School-wideNon-classroomClassroom Individual With the combined percentages of high and medium improvement priority near or above 80% for all 4 systems, this school does have staff buy-in. 82% 79% 86%

280
In year 2 of implementation and beyond, the Self-Assessment helps to prioritize goals in the 7 features across the 4 systems: School-wideSchool-wide ClassroomClassroom Non-classroomNon-classroom IndividualIndividual Both staff perception & attainability are factored into prioritization. factored into prioritization.

281
The Self-Assessment is an online survey. Staff members enter their answers into a school account on PBSsurveys.org, and the data is summarized for you! The data are used to create the teams action plan for the school year. The priorities found in your Self- Assessment drive tasks to help teams reach the goals deemed high priority by the entire faculty and staff.

282
School-wide Nonclassroom Example School

283
Classroom Individual Example School

284
Example

285
Red indicates 49% complete. Yellow indicates 50- 79% complete. whiteyellow red for in place percentages Items are categorized by white, yellow, and red for in place percentages. White indicates80% complete. Self-Assessment Individual Item Scores

286
Self-Assessment:

287
Self-Assessment:

288
Self-Assessment : Individual Item Scores

289
Self-Assessment Data Review Manual A step-by-step guide for making sense of the survey results for schools who have been addressing the implementation of SWPBS for at least 1 year Uses graphs from the Self-Assessment on PBSsurveys.org to identify strengths and areas for improvement in Tier 1: Primary Preventions implementation Bridges team thinking from recognizing weaknesses to developing an action plan to address the weakness

290
1.Get out your Sample Self Assessment Data Review Manual from your packet. 2.Find your Fork partner and sit together for this activity. 3.With your fork partner, complete the Sample Self Assessment Data Review Manual as directed by the presenter. You will have approximately 5 minutes for this.

291
School-wide Self-Assessment Data Review Manual: Comparative Summaries First, data are compared from different survey dates to look for improvement. (1) What systems are showing improvement in the implementation of SWPBS? (In place and partially in place combined) Fall: 96% Spring: 84% 12% Decrease No improvement
 What systems are showing improvement in the implementation of SWPBS. (In place and partially in place combined) Fall: 96% Spring: 84% 12% Decrease No improvement.")
292
Non-Classroom Self-Assessment Data Review Manual: Comparative Summaries First, data are compared from different survey dates to look for improvement. (1) What systems are showing improvement in the implementation of SWPBS? (In place and partially in place combined) Fall: 99% Spring: 91% 8% Decrease No improvement
 What systems are showing improvement in the implementation of SWPBS. (In place and partially in place combined) Fall: 99% Spring: 91% 8% Decrease No improvement.")
293
Classroom Self-Assessment Data Review Manual: Comparative Summaries First, data are compared from different survey dates to look for improvement. (1) What systems are showing improvement in the implementation of SWPBS? (In place and partially in place combined) Fall: 99% Spring: 87% 12% Decrease No improvement
 What systems are showing improvement in the implementation of SWPBS. (In place and partially in place combined) Fall: 99% Spring: 87% 12% Decrease No improvement.")
294
Individual Self-Assessment Data Review Manual: Comparative Summaries First, data are compared from different survey dates to look for improvement. (1) What systems are showing improvement in the implementation of SWPBS? (In place and partially in place combined) Fall: 92% Spring: 69% 23% Decrease No improvement
 What systems are showing improvement in the implementation of SWPBS. (In place and partially in place combined) Fall: 92% Spring: 69% 23% Decrease No improvement.")
295
Self-Assessment Data Review Manual: Comparative Summaries (2) If your school has more than 2 years of Self- Assessment data, is there a trend in the change in Current Status graphs for each system? A trend could not be identified in the Current Status graphs. First, data are compared from different survey dates to look for improvement.

296
Self-Assessment Data Review Manual: Comparative Summaries (3) In which systems is SWPBS Tier 1: Primary Preventions in place? (i.e. combined percentage of in place and partially 80%) Celebrate these successes!! 83%!!! School-wide First, data are compared from different survey dates to look for improvement.
 Celebrate these successes!. 83%!!. School-wide First, data are compared from different survey dates to look for improvement..")
297
Self-Assessment Data Review Manual: Comparative Summaries (3) In which systems is SWPBS Tier 1: Primary Preventions in place? (i.e. combined percentage of in place and partially 80%) Celebrate these successes!! 91% in place!! Non-Classroom First, data are compared from different survey dates to look for improvement.
 Celebrate these successes!. 91% in place!. Non-Classroom First, data are compared from different survey dates to look for improvement..")
298
Self-Assessment Data Review Manual: Comparative Summaries First, data are compared from different survey dates to look for improvement. (3) In which systems is SWPBS Tier 1: Primary Preventions in place? (i.e. combined percentage of in place and partially 80%) Celebrate these successes!! 87% !!! Classroom
 In which systems is SWPBS Tier 1: Primary Preventions in place. (i.e. combined percentage of in place and partially 80%) Celebrate these successes!. 87% !!. Classroom.")
299
Self-Assessment Data Review Manual: Comparative Summaries (3) In which systems is SWPBS Tier 1: Primary Preventions in place? (i.e. combined percentage of in place and partially 80%) Celebrate these successes!! 69% Individual First, data are compared from different survey dates to look for improvement.
 Celebrate these successes!. 69% Individual First, data are compared from different survey dates to look for improvement..")
300
Self-Assessment Data Review Manual: Comparative Summaries (4) For those systems in which SWPBS Tier 1: Primary Preventions is not in place, which have been labeled as a high priority for improvement by the faculty and staff? Not identified as high priority School-wide First, data are compared from different survey dates to look for improvement.

301
Self-Assessment Interpretation Guide: Comparative Summaries First, data are compared from different survey dates to look for improvement. (4) For those systems in which SWPBS Tier 1: Primary Preventions is not in place, which have been labeled as a high priority for improvement by the faculty and staff? Non-Classroom Not identified as high priority
 For those systems in which SWPBS Tier 1: Primary Preventions is not in place, which have been labeled as a high priority for improvement by the faculty and staff. Non-Classroom Not identified as high priority.")
302
Self-Assessment Interpretation Guide: Comparative Summaries (4) For those systems in which SWPBS Tier 1: Primary Preventions is not in place, which have been labeled as a high priority for improvement by the faculty and staff? Not identified as high priority Classroom First, data are compared from different survey dates to look for improvement.

303
Self-Assessment Interpretation Guide: Comparative Summaries First, data are compared from different survey dates to look for improvement. (4) For those systems in which SWPBS Tier 1: Primary Preventions is not in place, which have been labeled as a high priority for improvement by the faculty and staff? Not identified as high priority Individual
 For those systems in which SWPBS Tier 1: Primary Preventions is not in place, which have been labeled as a high priority for improvement by the faculty and staff. Not identified as high priority Individual.")
304
Self-Assessment Data Review Manual: SET vs. Self-Assessment (1) Celebrations: What features have shown improvement since the SET was conducted in the fall? (1)Management, (2) District Support, & (3) Monitoring/Decision Making
 Celebrations: What features have shown improvement since the SET was conducted in the fall. (1)Management, (2) District Support, & (3) Monitoring/Decision Making.")
305
Self-Assessment Data Review Manual: Self-Assessment vs. SET (1) Improvement Needs: Which features still need to be focused on for improvement? Expectations Taught, Reward System, & Violations System
 Improvement Needs: Which features still need to be focused on for improvement. Expectations Taught, Reward System, & Violations System.")
306
Self-Assessment Interpretation Guide: Features (1) Features to Celebrate: Of the 7 features from the Self- Assessment, which features are over 80% in place? (1) Expectations Defined & (2) District Support
 Expectations Defined & (2) District Support.")
307
Self-Assessment Interpretation Guide: Features (2) Features for Improvement: Label which features your team needs to focus on improving. (1)Reward System, (2) Violation System, & (3) Management
Reward System, (2) Violation System, & (3) Management.")
308
Self-Assessment Interpretation Guide: Item Statements (1) Identify the item statements associated with the features labeled for improvement. The item statements below are associated with the feature Reward System. Item #4 in Non-classroom and Classroom will be our focus.

309
Self-Assessment Data Review Manual: Item Statements (2) Brainstorm actions/tasks to improve upon the items identified. (3) Complete the table by entering item statements and actions/tasks
 Complete the table by entering item statements and actions/tasks.")
310
First, Assign each topic a letter of the alphabet. Second, EACH team member assigns a priority value to each item, rank ordering the items from most to least important. The rank ordering, HOWEVER, occurs in a specific manner. Third, EACH team members value is added to obtain a total sum value for each behavior identified, thereby creating a rank order prioritization list. Fourth, team members are asked if there is a consensus of this weighted outcome. If not, discuss, and weight again until consensus is obtained.

311
Is there measurable improvement in implementation? How did the feature graph from the Self-Assessment compare to that of the SET? On which features and items should this team focus their efforts? What are some possible actions the team could take to better their implementation of SWPBS? Complete the Self-Assessment Interpretation Guide and Planning Organizer with your team using the data and graphs from your notebook

312
Making your life easier, one survey at a time! Select Your Occupation or Role:Select Your Occupation or Role: Demonstration DistrictDemonstration District District: District: School:School: Read over the directions for using PBSsurveys.org…. Any Questions??

313
???
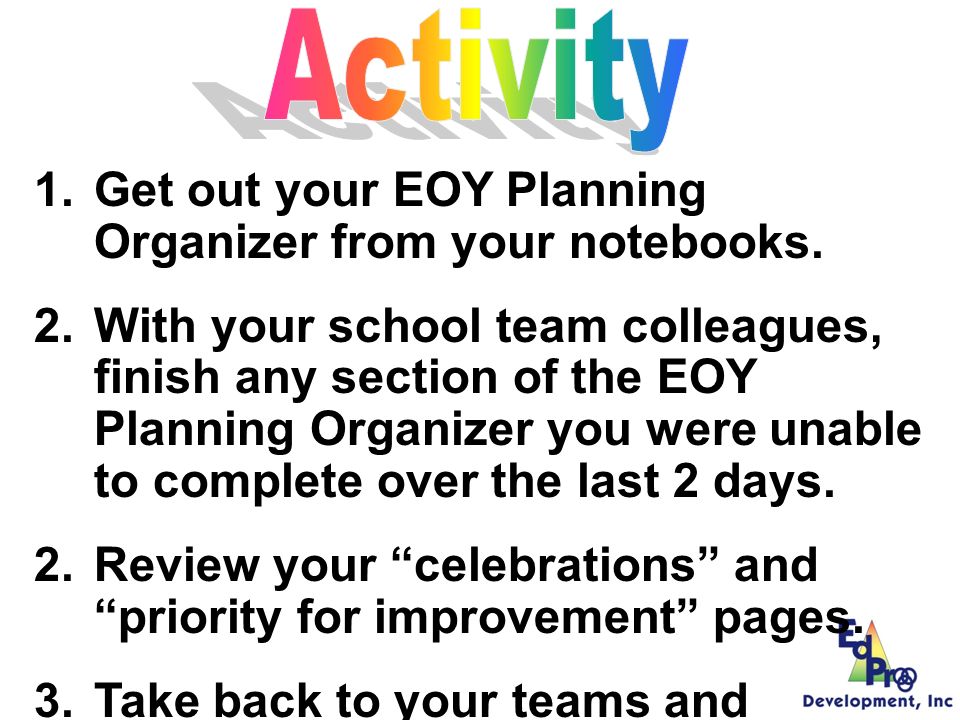
314
1.Get out your EOY Planning Organizer from your notebooks. 2.With your school team colleagues, finish any section of the EOY Planning Organizer you were unable to complete over the last 2 days. 2.Review your celebrations and priority for improvement pages. 3.Take back to your teams and SHARE!

316
1. Post test 2. EdPro Development Evaluation 3. TASL Evaluation, TASL Cards, … (TASL seekers) 4. Certificate of attendance

Similar presentations


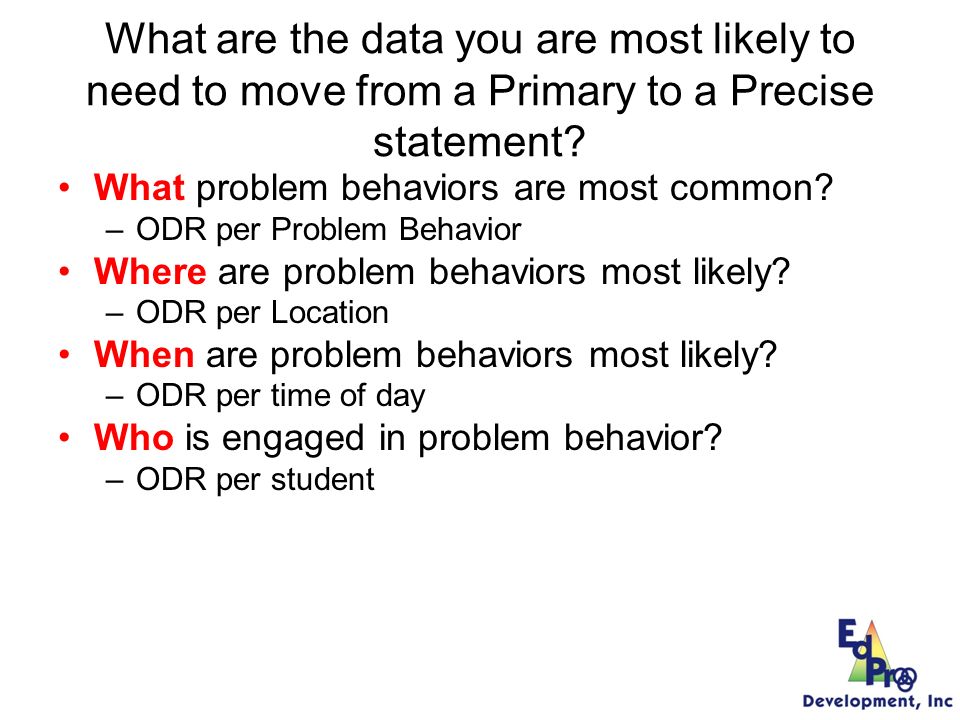
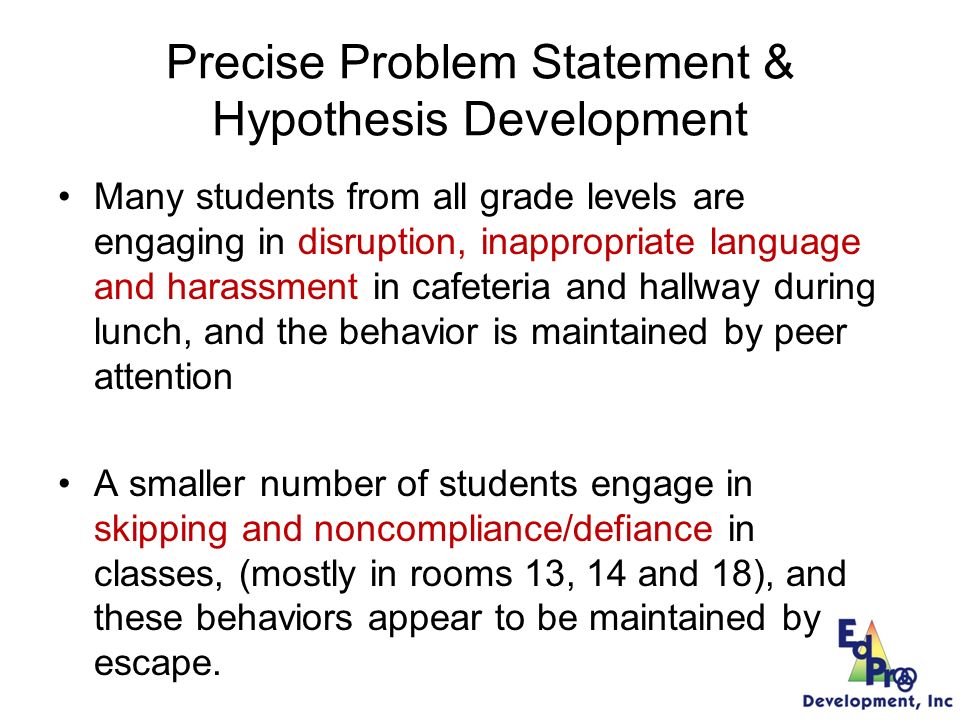
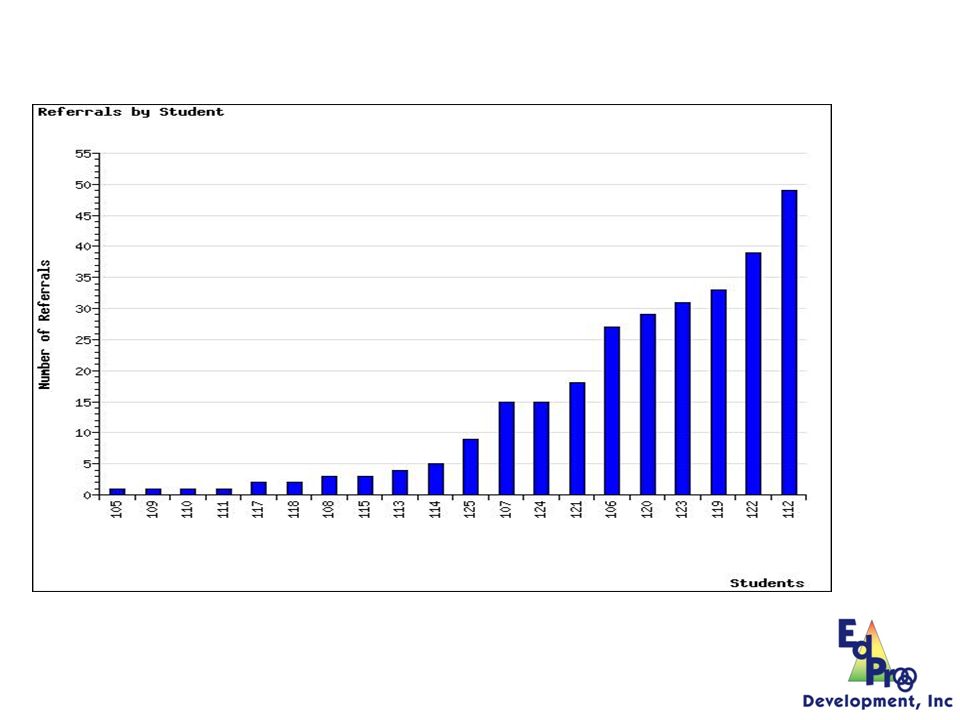


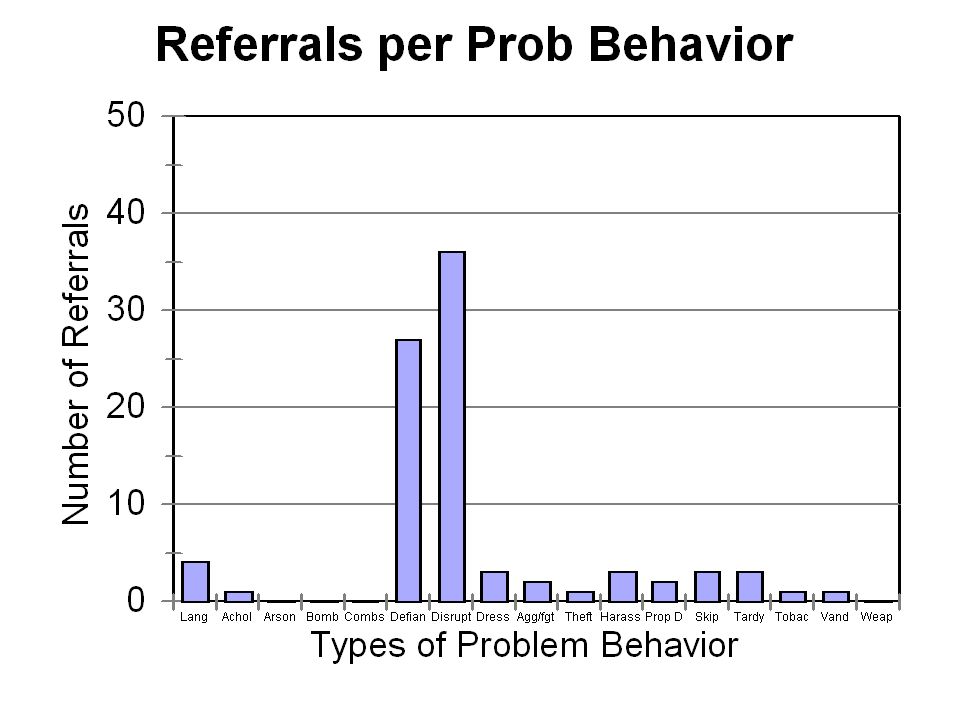


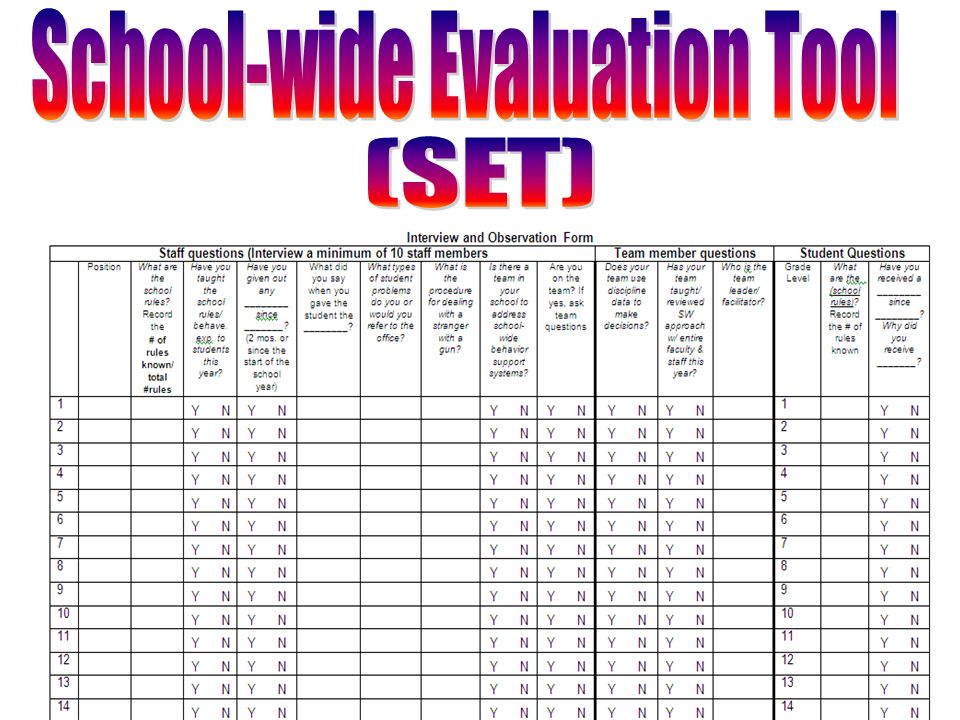
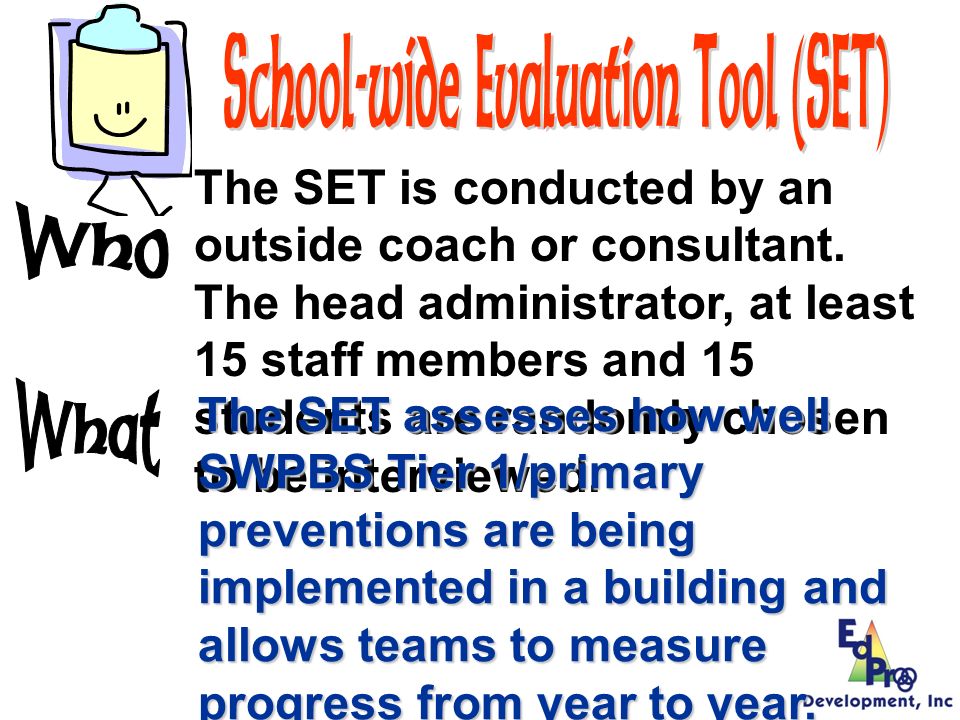


 Adapted from Rob Horner, et al.>")


>")


