Download presentation
Presentation is loading. Please wait.

1
Calidad de los sistemas universitarios: una visión comparada basada en el ranking ARWU Domingo Docampo Universidad de Vigo ESTRATEGIAS DE FORMACIÓN PARA LA INVESTIGACIÓN Y LA INNOVACIÓN Proyecto Innova CESAL Lisboa, 25 de marzo de 2010 Calidad de los sistemas universitarios: una visión comparada basada en el ranking ARWU Domingo Docampo Universidad de Vigo ESTRATEGIAS DE FORMACIÓN PARA LA INVESTIGACIÓN Y LA INNOVACIÓN Proyecto Innova CESAL Lisboa, 25 de marzo de 2010

2
Outline of the Talk Motivation of the study Motivation of the study Selection of Data Selection of Data Decision on the set of Indicators Decision on the set of Indicators Statistical Analysis: principal components. Statistical Analysis: principal components. Global Quality assessment. Global Quality assessment. Clustering of countries. Clustering of countries. Influence of Expenditures (R&D. HE Funding) on Global Quality. Influence of Expenditures (R&D. HE Funding) on Global Quality. Conclusions Conclusions
 on Global Quality. Influence of Expenditures (R&D. HE Funding) on Global Quality. Conclusions Conclusions.")
3
Quality Assessment Shanghai Jiao Tong University’s Academic Ranking of World Universities Shanghai Jiao Tong University’s Academic Ranking of World Universities Based on collective scientific production and individual achievement Based on collective scientific production and individual achievement Sound Indicators and Reliable Data Sound Indicators and Reliable Data Data from countries can be aggregated Data from countries can be aggregated International comparisons can be made International comparisons can be made It is not the whole story but… It is not the whole story but…

4
ARWU RankInstitution*CountryALUAWDHiCiNASPUBSIZETOTAL 1 Harvard Univ USA100 74.1100 2 Stanford Univ USA4078.786.668.971.666.973.7 3 Univ California - Berkeley USA6977.168.870.6705371.4 4 Univ Cambridge UK90.391.553.65664.16570.4 5 Massachusetts Inst Tech (MIT) USA7180.665.668.761.653.969.6 6 California Inst Tech USA52.869.157.466.149.710065.4 7 Columbia Univ USA72.465.756.552.370.546.662.5 8 Princeton Univ USA59.380.461.940.544.859.358.9 9 Univ Chicago USA67.481.950.539.551.941.357.1 10 Univ Oxford UK5957.948.4526645.756.8 11 Yale Univ USA48.543.65755.762.448.754.9 12 Cornell Univ USA41.551.354.152.364.740.454.1 13 Univ California - Los Angeles USA24.442.857.448.975.73652.4 14 Univ California - San Diego USA15.83459.75366.747.450.3 15 Univ Pennsylvania USA31.734.458.341.36939.249.0 16 Univ Washington - Seattle USA25.731.853.149.574.12848.3 17 Univ Wisconsin - Madison USA38.435.552.641.268.128.847.4 18 Univ California - San Francisco USA036.854.151.560.847.546.6 19 Tokyo Univ JAP32.214.143.151.983.33546.4 20 Johns Hopkins Univ USA45.827.843.148.768.524.845.5 21 Univ Michigan - Ann Arbor USA38.4060.641.778.131.444.2 22 Univ Coll London UK31.232.238.644.365.835.444.0 23 Kyoto Univ JAP35.433.438.635.870.631.543.5 24 Swiss Fed Inst Tech - Zurich CHE35.936.336.138.153.65643.1 24 Univ Toronto CAN2519.338.63779.845.843.1
 USA California Inst Tech USA Columbia Univ USA Princeton Univ USA Univ Chicago USA Univ Oxford UK Yale Univ USA Cornell Univ USA Univ California - Los Angeles USA Univ California - San Diego USA Univ Pennsylvania USA Univ Washington - Seattle USA Univ Wisconsin - Madison USA Univ California - San Francisco USA Tokyo Univ JAP Johns Hopkins Univ USA Univ Michigan - Ann Arbor USA Univ Coll London UK Kyoto Univ JAP Swiss Fed Inst Tech - Zurich CHE Univ Toronto CAN")
5
Aggregating the data To make appropriate comparisons either population or wealth have to enter the picture. I chose countries share of the world’s GDP (PPP). To make appropriate comparisons either population or wealth have to enter the picture. I chose countries share of the world’s GDP (PPP). Number of universities and averages of scores will be used as indicators. Number of universities and averages of scores will be used as indicators.
. To make appropriate comparisons either population or wealth have to enter the picture. I chose countries share of the world’s GDP (PPP). Number of universities and averages of scores will be used as indicators. Number of universities and averages of scores will be used as indicators..")
6
Universities in ARWU NUMBER OF UNIVERSITIES ALONG ARWU ACTUAL (EXPECTED) Country 2550100250ARWU USA18 (5)36 (11)54 (21)104 (55)159 (107) GBR3 (1)5 (2)11 (3)27 (8)42 (17) JPN2 (2)2 (3)4 (7)9 (17)31 (33) ARG0(0-1)0 (1) 1 (2)1 (4) BRA0 (0-1)0 (1)0 (3)2 (7)6 (14) PRT0 (0) 0 (1)2 (2) DEU0 (1)0 (2)6 (4)18 (11)40 (22) MEX0 (0-1)0 (1)0 (2)1 (5)1 (11) ESP0 (0-1)0 (1)0 (2)2 (5)11 (10) CHL0 (0) 0(1)2 (2)
 Country ARWU USA18 (5)36 (11)54 (21)104 (55)159 (107) GBR3 (1)5 (2)11 (3)27 (8)42 (17) JPN2 (2)2 (3)4 (7)9 (17)31 (33) ARG0(0-1)0 (1) 1 (2)1 (4) BRA0 (0-1)0 (1)0 (3)2 (7)6 (14) PRT0 (0) 0 (1)2 (2) DEU0 (1)0 (2)6 (4)18 (11)40 (22) MEX0 (0-1)0 (1)0 (2)1 (5)1 (11) ESP0 (0-1)0 (1)0 (2)2 (5)11 (10) CHL0 (0) 0(1)2 (2)")
7
PCA Indicators AlU (average 2.5 GDP share) AlU (average 2.5 GDP share) AwD (average 2.5 GDP share) AwD (average 2.5 GDP share) HiCi (average 2.5 GDP share) HiCi (average 2.5 GDP share) NaS (average 2.5 GDP share) NaS (average 2.5 GDP share) PuB (average 2.5 GDP share) PuB (average 2.5 GDP share) QwU (Presence in ARWU vs GDP share) QwU (Presence in ARWU vs GDP share)
 AlU (average 2.5 GDP share) AwD (average 2.5 GDP share) AwD (average 2.5 GDP share) HiCi (average 2.5 GDP share) HiCi (average 2.5 GDP share) NaS (average 2.5 GDP share) NaS (average 2.5 GDP share) PuB (average 2.5 GDP share) PuB (average 2.5 GDP share) QwU (Presence in ARWU vs GDP share) QwU (Presence in ARWU vs GDP share)")
8
COHERENCE OF THE INDICATORS Correlation Matrix AlUAwDHiCiNaSPuBQwU AlU 1.811**.703**.799**.437**.654** AwD 1.785**.795**.546**.624** HiCi 1.906**.716**.780** NaS 1.749**.805** PuB 1.716** QwU 1

9
Scale Properties Exploratory Factor Analysis Variance Explained ComponentEigenvalue% varianceaccumulated 14.6377.2 20.6611.2588.45 KMO0.839 Bartlett's Proof Sig.5.0312E-56 ReliabilityCronbach'salpha0.94

10
Principal Components Extraction of Communalities IndicatorsOne ComponentTwo Components AlU0.800.92 AwD0.830.90 HiCi0.860.91 NaS0.900.93 PuB0.520.81 QwU0.710.85

11
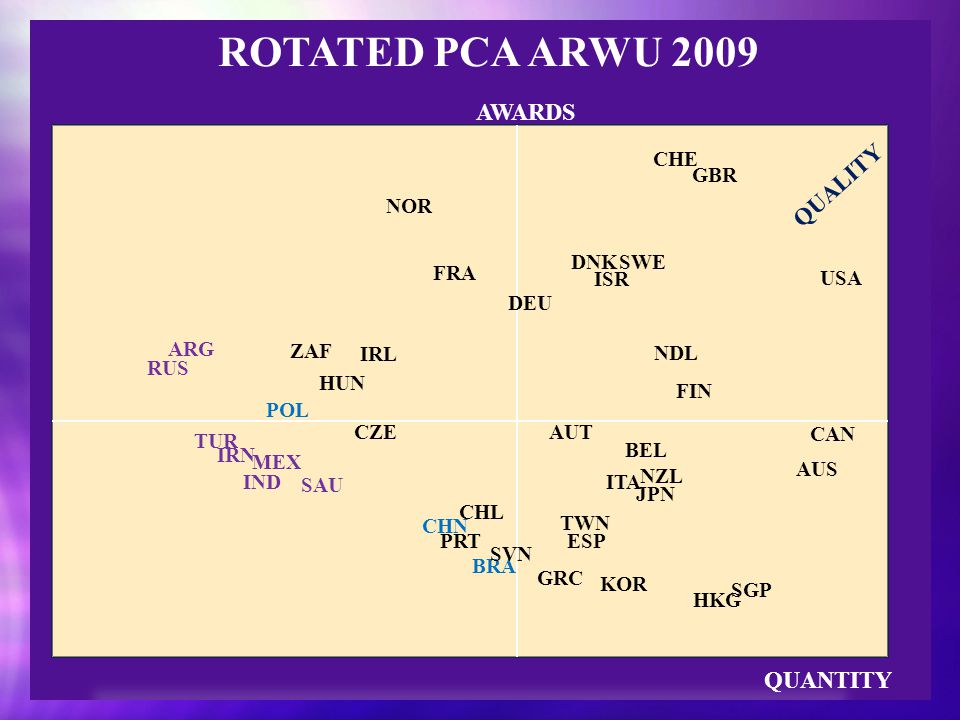
Indicators

12
Principal Components

16
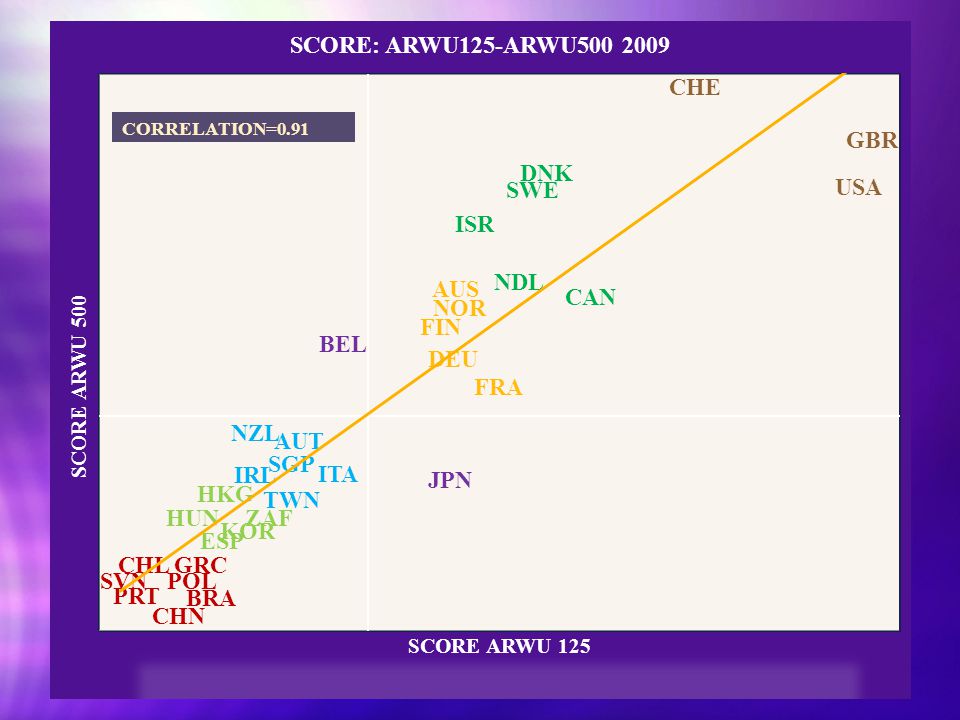
Predicting Scores ARWU 500 Hierarchical Regression Analysis Model Summary ModelCorr.R2R2 SIGR 2 changeReg. Coef. GDPH.634.40.000.40.49 (+) R&D.756.57.000.17.44 Excluded Variables Partial Correlation HE Funding.46.14 GDP SHARE.85.04
 R&D Excluded Variables Partial Correlation HE Funding GDP SHARE")
17
Predicting Global Quality

18
Conclusions International benchmarking is a good basis for improvement. Do it honestly. International benchmarking is a good basis for improvement. Do it honestly. Identifying appropriate incentives to encourage and reward excellence is paramount to improve quality. Identifying appropriate incentives to encourage and reward excellence is paramount to improve quality.

19
Coda Galbraith once said that given the choice of proving that changes are unnecessary. most people…¿? Galbraith once said that given the choice of proving that changes are unnecessary. most people…¿? Start working on the proof! Please. do not.

Similar presentations