Download presentation
Presentation is loading. Please wait.

2
Trends in Hypertension Hypertensive Emergency Case Decision and Classification Therapy and Cardiovascular Complications Primary Events Secondary Events Comparison of Primary and Secondary Events in this Study Conclusions

3
Time period 80 – 09 Values from WHO Systolic blood pressure in mmHg (not age-standardized) In 180 countries
 In 180 countries")
4
coefficient of regression ( Average systolic values from 1980 to 2009 from WHO Average systolic in mmHg (not age-standardized) p<0.05
 p<0.05")
5
1980 – 2009Systolic in mmHg

6
coefficient of regression ( Average systolic values from 1980 to 2009 from WHO Average systolic in mmHg (not age-standardized) p<0.05
 p<0.05")
7
1980 – 2009Systolic in mmHg

8
betas of linear predictions (male and female) based on raw values from WHO (1980 – 2009) Male Female Blood Pressure coefficient of regression female against male 1.43 (CI 1.36-1.52); p=0.001
 based on raw values from WHO (1980 – 2009) Male Female Blood Pressure coefficient of regression female against male 1.43 (CI ); p=0.001")
9
if the development is towards higher values of blood pressure (or negligible in male), female trends are ever so often more rapid if the development is towards lower values of blood pressure, it is usually more rapid in the female sex female trends are highly significant countries with largest gender gaps are… Top 2%Burkina Fasotowards higher values Mali Niger Nigeria Top 2% Czech Republictowards lower values Spain Estonia Malta
, female trends are ever so often more rapid if the development is towards lower values of blood pressure, it is usually more rapid in the female sex female trends are highly significant countries with largest gender gaps are… Top 2%Burkina Fasotowards higher values Mali Niger Nigeria Top 2% Czech Republictowards lower values Spain Estonia Malta")
10
Coefficient Male Coefficient Female Countries CI 0.85 (CI 0.78-0.92) PCA Blood Glucose Blood Pressure BMI women’s values are non-uniformely distributed amongst different countries men’s values are uniformely distributed amongst different countries
 PCA Blood Glucose Blood Pressure BMI women’s values are non-uniformely distributed amongst different countries men’s values are uniformely distributed amongst different countries")
11
Predictions based on 1980 – 2009 Raw Values from WHO Non-linear predictions; Average systolic blood pressure Add to baseline of 2009 (in mmHg)
")
12
Trends in Hypertension Hypertensive Emergency Case Decision and Classification Therapy and Cardiovascular Complications Primary Events Secondary Events Comparison of Primary and Secondary Events in this Study Conclusions

13
available patient cohort study from May 2008 in Kanton Basel (BS, BL) and Luzern inclusion criteria: blood pressure >180 mmHg/>110 mmHg, age > 20 y discriminant analysis, logistic regression, categorical regression, multi layer perceptrons primary care questionnaire … in addition to Age and Gender, data on Blood pressure, Drugs, Emergency therapy, Follow-up therapy, Cardiovascular risk factors were requested to be answered. Further questions referred to Accompanying conditions and the History of cardiovascular complications, Cardiovascular complications within 3 months 1 year follow-up … Cardiovascular events, Follow-up therapy changes and data on newly described Cardiovascular risk factors were requested to be answered

14
Prevalence Age group (approx.) 65-74 Wolf-Maier et al. (2003); Kearney et al. (2005); Pitsavos et al. (2006) ; eurostat.ec.europa.eu (2008); National Health and Nutrition Survey of Japan (2006) and WHO
; Kearney et al. (2005); Pitsavos et al. (2006) ; eurostat.ec.europa.eu (2008); National Health and Nutrition Survey of Japan (2006) and WHO.")
15
Modelling of the „clinical decision“ path E E + H H - H - E -H E: Emergency Therapy H: Hospitalization

16
Classification EmergencyUrgencyAsymptomatic* abdominal pain ataxiaaltered mental status chest painAngst confusionatactic gait dizziness/vertigocold intolerance dropsdizziness/vertigo dyspnoea headacheepiphora incontinenceepistaxis limb weaknessflush nauseagait disturbances pallorheadache palpitationslimb pain pruritusnausea speech disturbancesneck pain sweatingpalpitations visual disturbancespruritus vomitusrestlessness shoulder pain sweating tinnitus tremor tympanic pressure visual disturbances * Does not lead to Emergency or Urgency classification back pain dizziness epistaxis flush heartburn nausea slightly altered mental status included in the statistics, yet, do not count as overt symptoms

17
Brennan et al. 2010, Critical Care Study Guide

18
164 patients included blood pressure determination 14 months n= 137 time course 18.4 months 8 patients died lost to follow-up n=26

19
NoYes Hypertension 8 Cases were selected 6: Other 5: Congestive Heart Failure 4: TIA 3: Cerebrovascular Insult 2: Occlusive PAD 1: Coronary Artery Disease 0: None

20
Emergency hospitalization patientclassdiagnosis 1Emergencyacute myocardial infarction 2Emergencyacute coronary syndrome 3Emergencysuspected cerebrovascular insult 4Emergencysuspected cerebrovascular insult 5Emergencysuspected cerebrovascular insult 6Emergencyhypertensive encephalopathy 7Emergencyhypertensive encephalopathy 8Emergencyhyponatremia, hypertensive encephalopathy 9Urgencymesenteric ischemia, bowel obstruction, hyperthyroidism 10Urgencysuspected cerebrovascular insult

21
Anzahl Emergency Urgency Asymptomatic Classification number sex mfmf

22
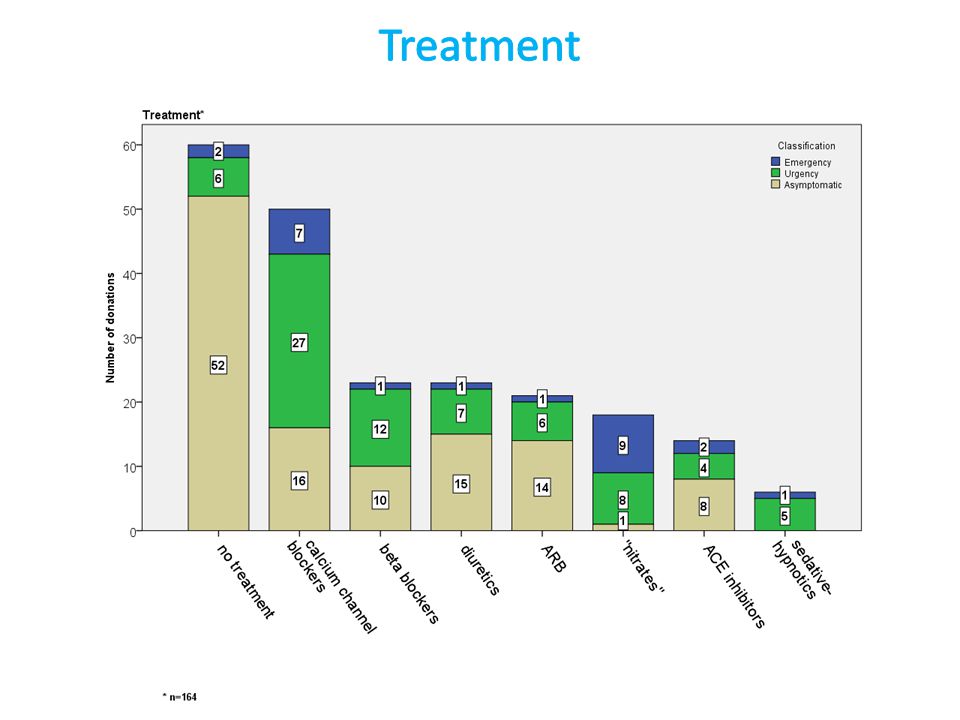
number Emergency UrgencyAsymptomatic Class no therapy monotherapy combination therapy

23
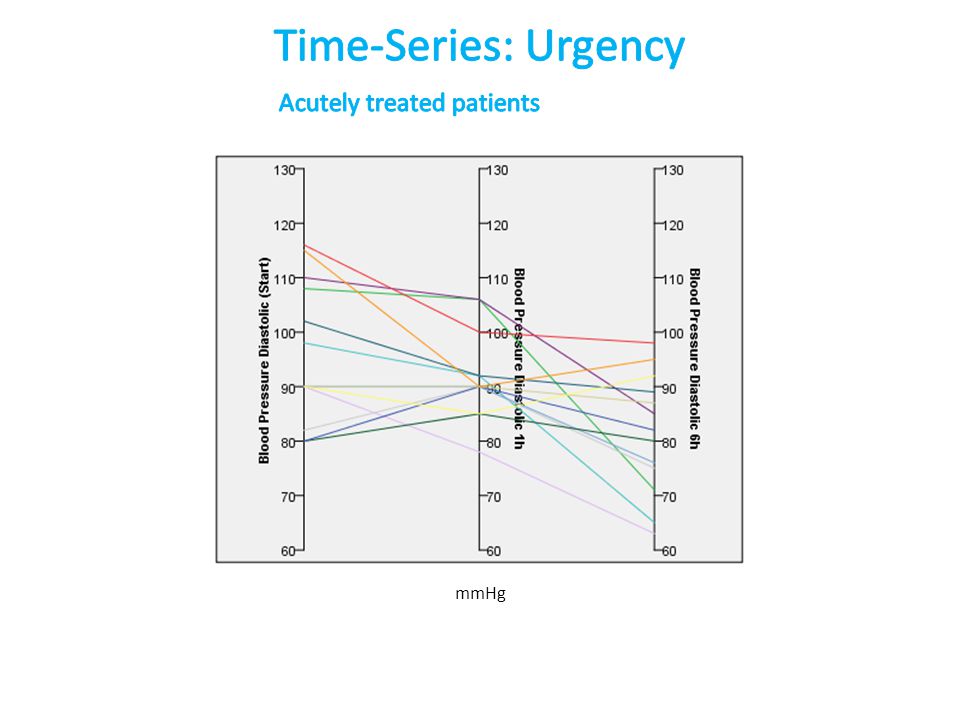
systolic diastolic hypertensive emergency 1 h 6 h 12 h 6 days 15 days 3.5 months 14 months

24
percentage of patients none hyperlipidemia lack of exercise obesity smoking Diabetes mellitus family history renal insufficiency

25
Factors Diabetes mellitus renal dysfunction physical inactivity hyperlipidemia obesity smoking cumulative risk factors m f Sex

27
OSAS percentage of patients Increase in body weightInfectionAlcoholismAsthmaNSAR Pain Non-complianceStressWhite Coat hypertensionNone

28
first hypertensive emergencies occur often with new patients White Coat hypertensive patients show fewer symptoms upon examination symptoms correlate with stress, NSAR medication and infects correlative evidence shows…

29
The network identified 92% of the patients with acute myocardial infarction, 96% of the patients without infarction. When all patients with the ECG evidence of infarction were removed from the cohort, the network correctly identified 80% (modified from Baxt 1990)
.")
30
Key Question “Does the evaluation contain previously inapparent information that can be used to improve on the diagnostic accuracy of predicting…” Baxt, 1990 hypertension gender lack of exercise / obesity

31
n=164 0.020 0.035 0.042 0.017 0.000 0.021 0.004 0.046 p= Asymptomatic E E E E E U E U Class Infection New patient Stress White Coat hypertension History of cardiovascular events NSAR White Coat hypertension History of cardiovascular events

32
Separation of U and A requires use of Symptom variable? Goodness of Classification 30 % 80 %

33
„Structural Equation“ model without parameters „The Diagnostic Gap“ Goodness of Classification 30 % 80 % 44 %

34
Importance Model unifying 7 different „output functions“ counting 2400 E 79.8% +/-15.8% U 96.9% +/-2.5% A 96.3% +/-2.4% Total 95.0% +/-2.4% (+/- SD) proposed cut-off Top 10% max. epochs 500

35
Hidden Layer AF Hyperbolic tangent321 Sigmoid182 Ouput Layer AF Hyperbolic tangent 83 Identity 93 Sigmoid 37 Softmax290 AUCs ≥ 0.986

36
Importance Model unifying 7 different „output functions“ - Top 500 E 100.0% +/-0.0% U 97.7% +/-1.1% A 99.6% +/-0.7% Total 99.0% +/-0.6% (+/- SD)
")
37
Function 1 Function 2 Emergency Urgency Asymptomatic

38
symptoms history of cardiovascular events age White Coat hypertension new patient hypertension first hypertensive emergency sex explained variance of 200 NSAR infection pain stress proposed cut-off variance model 1 model 2 model 3

39
New data on hypertension Method% Classification Overall Error 1 Neuronal network1,0 (+/- 0,6%) - 5,0 (+/- 2,4%) 2 Discriminant analysis10,0 3 CatReg16,0 4 Logistic regression 29,9 Symptoms were not introduced in logistic regression
 - 5,0 (+/- 2,4%) 2 Discriminant analysis10,0 3 CatReg16,0 4 Logistic regression 29,9 Symptoms were not introduced in logistic regression")
41
Seemed not absolutely necessary…

42
p <0.05 Cardiovascular treatment track ACE inhibitors in drug history lead to a significantly higher prescription rate of sedatives previous treatment with ARB results in frequent emergency treatment with ARB ARBs in drug history lead to infrequent therapy with ACE inhibitors in hypertensive emergencies patients receiving ARB in emergency treatment regularly receive ARB in follow-up treatment

43
Drugs causing drug-induced hypertension and hypertension treatment

44
Blood pressure reduction Sub-groupSignificance p<0.05 6 h systolicalltogetheryes 1 h systolicEyes Combination Therapy Blood pressure reduction Sub-groupSignificance p<0.05 all systolicalltogether or E, U, Anone all diastolicalltogether or E, U, Anone Mono-Therapy Mann-Whitney U Test

45
blood pressure recommendation 1 to 2 h and 2 to 6 h systolic diastolic hypertensive emergency 1 h 6 h 12 h 6 days 15 days 3.5 months 14 months

46
mmHg

52
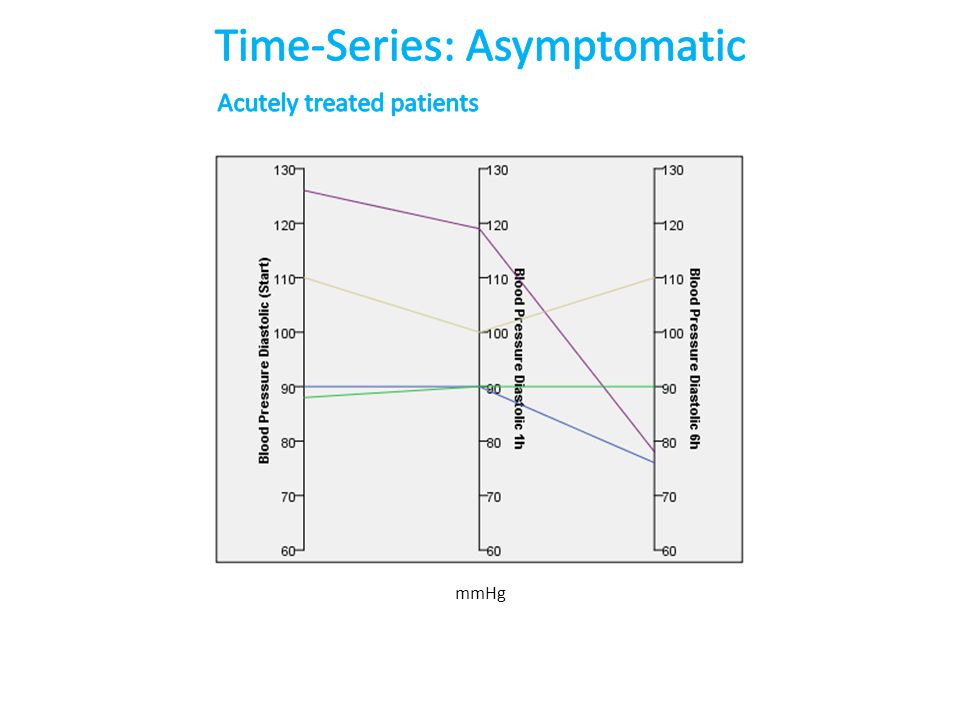
TimeTreatmentNone Initial200 / 102194 / 98 1 h186 / 97186 / 92 6 h160 / 87163 / 80 in mmHg

53
blood pressure* reduction achieved by 20-30% in 1-2 hours the acutely treated study population was not over-treated, one emergency and three urgency, and no other cases were likely loosing systolic blood pressure too fast (not all 6 hour blood pressure values were obtained) at least 16 cases showed systolic blood pressure values of more than 160 mmHg at 6 hours * Dieterle T, Zeller A, Martina B, Battegay E. Der hypertensive Notfall. Praxis. 2001

54
Initial 0 h1 h6 h % above 16099,095,255,2 % below 10040,455,475,9 Systolic Diastolic Initial 0 h1 h6 h % above 16096,792,744,4 % below 10043,363,488,9 Systolic Diastolic in mmHg

55
Arrhythmias were not considered as primary events in the following canonical correlation. They were only included with secondary events if they led to or were followed by death.

56
Trends in Hypertension Hypertensive Emergency Case Decision and Classification Therapy and Cardiovascular Complications Primary Events Secondary Events Comparison of Primary and Secondary Events in this Study Conclusions

57
Canonical correlation modelled initial (day 6) blood pressure and risk factors Recurrent Hypertensive Crises
 blood pressure and risk factors Recurrent Hypertensive Crises")
58
Importance Model unifying 6 different „output functions“ – 2400 Top 1%

59
1° Event100.0% +/-0.0% Total 98.4% +/-0.8% (+/- SD) 1° Event40.4% +/-26.7% Total 91.2% +/-2.7% Classification Top 1%2400 models Other 2 selected models 1° Event 94.9% +/-2.5% Total 98.6% +/-2.5% (+/- SD)
 1° Event40.4% +/-26.7% Total 91.2% +/-2.7% Classification Top 1%2400 models Other 2 selected models 1° Event 94.9% +/-2.5% Total 98.6% +/-2.5% (+/- SD)")
60
Flegal, K. M., Kit, B. K., Orpana, H., & Graubard, B. I. (2013). Association of all- cause mortality with overweight and obesity using standard body mass index categories: a systematic review and meta-analysis. JAMA, 309(1), 71–82.
. Association of all- cause mortality with overweight and obesity using standard body mass index categories: a systematic review and meta-analysis. JAMA, 309(1), 71–82..")
61
Importance Model unifying 6 different „output functions“ – 2400 2 100% Predictions

62
Agep=0.011 Multiple (recurrent) hypertensive crisesp=0.004 in stepwise algorithm (no prior probabilty) set classified 78.2%
 hypertensive crisesp=0.004 in stepwise algorithm (no prior probabilty) set classified 78.2%")
64
Classification Method Average Overall % Primary Events % 1 neuronal network91,2 - 98,440,4 - 100,0 2 discriminant analysis64,1 - 84,89,1 - 63,3 3 logistic regression88,0 - 89,19,1 - 27,3 n=92

65
Trends in Hypertension Hypertensive Emergency Case Decision and Classification Therapy and Cardiovascular Complications Primary Events Secondary Events Comparison of Primary and Secondary Events in this Study Conclusions

66
Canonical correlation Chillon and Baumbach (1997) modelled initial (day 6) blood pressure and risk factors
 modelled initial (day 6) blood pressure and risk factors")
67
Non-Linear Blood Pressure Model with CatReg ParameterImportance P of (regression) Age0.1220.254 Sex0.2370.148 Systolic0.2910.034 Diastolic0.3490.005 R 2 = 0.51 Day 6
 Age Sex Systolic Diastolic R 2 = 0.51 Day 6")
68
Blood Pressure of day 6 Quantification Residuals Quantification Residuals Quantification Residuals Age Systolic Blood Pressure Diastolic Blood Pressure Secondary Event Categories

69
Trends in Hypertension Hypertensive Emergency Case Decision and Classification Therapy and Cardiovascular Complications Primary Events Secondary Events Comparison of Primary and Secondary Events in this Study Conclusions

70
Importance < 90%

71
Age Alcoholism Asthma Diabetes mellitus Family History of Cardiovascular Disease Hyperlipidemia Hypertension Lack of Exercise Non-Compliance Obesity OSAS Renal Insufficiency Second Hypertensive Emergency Sex Smoking White Coat Hypertension TendencyPrimaryEventSecondary Modalized Family History of Cardiovascular Disease

72
Second Hypertensive Emergency Family History of Cardiovascular Disease Diabetes mellitus Lack of Exercise OSAS Obesity Alcoholism Asthma Renal Insufficiency Hyperlipidemia White Coat Hypertension Non-Compliance Hypertension Sex Smoking Age From primary versus secondary event with perceptron and CatReg data

73
1 2 3 4 5 6 Kardiovask. Komplikationen 1 2 3 4 5 6 1 2 3 4 6 emergency scores lowest 5 1 2 3 4 5 6 Diabetes mellitus renal dysfunction physical inactivity hyperlipidemia obesity smoking Age Group cumulative risk years

74
in patients with hypertensive emergencies history of cardiovascular events is associated with hyperlipidemia with a RR 3.3 (CI 1.2-8.9); p=0.017 (Fisher Exact) a history of cardiovascular events is associated with antihypertensive pretreatment with a RR 4.4 (CI 1.2-15.8); p=0.024 (Fisher Exact) secondary cardiovascular events are associated with smoking with a RR 3.2 (CI 0.8-12.6); p=0.1 (Fisher Exact) this is relative to healthy cohort patients
; p=0.017 (Fisher Exact) a history of cardiovascular events is associated with antihypertensive pretreatment with a RR 4.4 (CI ); p=0.024 (Fisher Exact) secondary cardiovascular events are associated with smoking with a RR 3.2 (CI ); p=0.1 (Fisher Exact) this is relative to healthy cohort patients")
75
regression coefficient 0.0160.0290.0060.049 p Model prob. p = 0.005; df 21 GLM

76
Grassi (2009) Assessment of sympathetic cardiovascular drive in human hypertension. Hypertension Llewellyn et al. (2011) MnPO and SFO drive renal sympathetic nerve activity via a glutamatergic mechanism within the paraventricular nucleus.* Am J Physiol Regul Integr Comp Physiol
 MnPO and SFO drive renal sympathetic nerve activity via a glutamatergic mechanism within the paraventricular nucleus.* Am J Physiol Regul Integr Comp Physiol.")
77
Koeppen & Stanton: Berne & Levy Physiology 2: Increased secretion of renin, which results in higher angiotensin II levels * * Neuronal on renal signalling

78
3200 models Importance / selection of 1 best predictor 1 95.8% +/- 4.2% 2 81.2% +/-16.4% 3 26.0% +/-24.2% 4 31.8% +/-31.6% 5 17.5% +/-30.0% 6 8.1% +/-23.8% Total 78.4% +/-6.8% Top 1 Total 94.9%

79
Trends in Hypertension Hypertensive Emergency Case Decision and Classification Therapy and Cardiovascular Complications Primary Events Secondary Events Comparison of Primary and Secondary Events in this Study Conclusions

80
Canonical correlation modelled initial (day 6) blood pressure and risk factors White Coat Hypertension
 blood pressure and risk factors White Coat Hypertension")
81
From WHO Data higher physiological values lower physiological values lower values malelower values female Blood Glucose Blood Pressure BMI Cholesterol Rank 133 Switzerland Rank 121 Female Risk Ratio for White Coat Hypertension 2.3

82
2.36 4.62 2.08 2.38 4.62 2.36 2.01 2.03 3.82 Model: Green leads to higher and Red to lower ranking

83
primary cardiovascular outcome (primary event) in this study cohort does not positively correlate with the number of risk factors secondary cardiovascular outcome and risk factor association is shown for renal insufficiency and smoking neural networks can produce predictions for primary events based on known cardiovascular risk factors causal relationships in these neural networks may end upside down - reasons are discovered in the obesity and low alcohol consumption (Hyperplane Extraction Procedures may be found in e.g. Saad and Wunsch II, Neural Networks 20 (2007), 78)
, 78).")
84
primary cardiovascular events after multiple hypertensive emergencies are 56% elevated to a rate (per year) of 56% multiple hypertensive crises are overwhelmingly important in the neuronal network prediction in models with stratification, white coat hypertension has protective influence relative to hypertension in non-linear models, secondary or higher ranked events might be prevented by slightly elevated diastolic blood pressure of 90 mmHg and higher after hypertensive emergencies during 6 days, and systolic values from 130 – 165 mmHg
 of 56% multiple hypertensive crises are overwhelmingly important in the neuronal network prediction in models with stratification, white coat hypertension has protective influence relative to hypertension in non-linear models, secondary or higher ranked events might be prevented by slightly elevated diastolic blood pressure of 90 mmHg and higher after hypertensive emergencies during 6 days, and systolic values from 130 – 165 mmHg")
85
Prof. Dr. Benedikt Martina, IHAM Basel Dr. Christoph Merlo, Luzern and especially the primary care doctors Members of my laboratory in Basel and in particular Elena Kouzmenko and Christian Chatenay-Rivauday

Similar presentations


 H3 Consulting, Guelph www.hthree.ca Managing Chronic Disease Can it work at work?>")


