Download presentation
Presentation is loading. Please wait.

1
Mass Attitudes to Democracy: Approaches and Assumptions Vanessa Liston Dept. of Political Science Trinity College Dublin Ireland vliston@tcd.ievliston@tcd.ie18th June 2010

2
Political Culture Attitudes (Almond and Verba, Inglehart & Welzel, Putnam) Behaviours/Ways of relating (Chilton, 1988)Culture is what is publicly expected and subscribed to, not what is individually preferred. Practical Norms (Olivier de Sardan, 2008) Wilson (2000) The many voices of political culture World Politics 52
 Wilson (2000) The many voices of political culture World Politics 52.")
3
Bratton, M. and Mattes, R (2007) Learning about democracy in Africa: Awareness, Performance, and Experience American Journal of Political Science 51:1
 Learning about democracy in Africa: Awareness, Performance, and Experience American Journal of Political Science 51:1.")
4
Demand for Democracy Support for principle: Democracy is preferable to any other form of government In certain situations another form of government can be preferable To people like me it doesnt matter. Rejection of alternatives: Strong leader Military rule One political party

5
Supply of Democracy In your opinion how much of a democracy is (your country) today? Generally, how satisfied are you with the way democracy works in (your country)?
 .")
7
Political Learning Theory Attitudes to democracy (supply and demand) -> individual and national differences in what citizens learn from short/medium and long term experience about what it does. cognitive factors national legacies performance

8
Cultural School Communal. 1. sense of individual responsibility 2. sense of risk tolerance. Poltical community. National Identity Group identity: Traditional /Modern identity Civic Attitudes: Interpersonal trust

9
Social Structure Class position Lived poverty Age Rural/urban status Gender Belong to numerically dominant ethnic group

10
Institutional Influence Members of organisations Partisan id Identify with winning party They test participation voted in most recent election participated politically between elections (working for candidate, party, contacting leaders, formal or informal etc.) took part in a demonstration.
 took part in a demonstration.")
11
Performance theory micro-macro economic evaluations government policy performance and structural adjustment creates inequality.

12
Bratton and Mattes claim People consider delivery of political goods as well as economic ones. They compare with previous regimes (long and medium term) Cognitive awareness of politics and procedural aspects of democracy they may develop intrinsic attachments to it
 Cognitive awareness of politics and procedural aspects of democracy they may develop intrinsic attachments to it.")
13
Their political learning theory Differences in demand and perceived supply of democracy should be predicted by individual learning experiences, nationally shaped. political learning -> basis of attitudes -> democratic consolidation

14
Three dimensions Political Goods Regime Comparison Previous regime Long term regime experience (Life-time, generational and collective learning models) Cognitive Awareness Formal education Use of news media
 Cognitive Awareness Formal education Use of news media")
15
Political Goods freeness and fairness of last election ability to speak their mind whether they and their group receive fair treatment government corruption government responsiveness performance of elected representatives performance of the president trustworthiness of state institutions

16
Regime Comparison Medium Term Improved quality of life Increased political rights Feel safer Less government corruption Long Term generational learning model (regime 18yrs) Life-time learning model (years under regimes) Collective learning (dominant post-colonial regime)
 Life-time learning model (years under regimes) Collective learning (dominant post-colonial regime)")
17
Cognitive Awareness Measures Formal education Cognitive engagement with politics News media use Political efficacy Political information Understanding of term democracy Substantive v Procedural understandings

18
METHODS Factor analysis Hierarchical Linear Modelling

19
RESULTS

20
Explaining DEMAND Demand is based on principle Cognitive Awareness Culture: Risk Tolerance Regime Comparison +Political Rights Political Goods + Gov. Responsiveness Economy Democracy Collective Learning + Legacy of competition

21
Explaining Perceived SUPPLY Political Goods + Performance of President + Freeness & Fairness of last election Economy + Economic Evaluations + Government Policy Regime legacy + multiparty legacy + one-party w competition - Settler rule No cognitive factors Institutional + Identifies with winning party

22
Conclusions By developing greater cognitive awareness of its processes, through direct experience with the fruits of political performance and through national experiences with political competition, people learn both about the content of democracy as well as its consequences.

23
Africans positions in the social structure, their cultural values, and their institutional affiliations have little to offer in directly explaining how they think about democracy.

24
Issue 1. Perception v Reality of SUPPLY Democracy has a low probability of breakdown where two conditions Citizens demand democracy Judge that they are being supplied with it (leaders have internalized and follow democrays institutional rules) Perceptions of the supply of democracy will be more salient to democracys actual prospects than any objective scores ratings compiled by experts. This form of regime will only consolidate if ordinary people judge that democracy is being supplied.
 Perceptions of the supply of democracy will be more salient to democracys actual prospects than any objective scores ratings compiled by experts. This form of regime will only consolidate if ordinary people judge that democracy is being supplied..")
25
Rhetorical or Logical Argument?

26
Kaufmann and Kraay (2008) Governance Indicators: Where are we Where should we be going?, The World Bank Research Observer
 Governance Indicators: Where are we Where should we be going , The World Bank Research Observer")
27
Objective indicators are not used Has to be supplied for people to believe it is supplied. Is it being supplied? There are two main points to consider : Judgement implies decision based on Fact or Observation. Beliefs do not have to be true. Gettier Is Justified True Belief Knowledge? http://philosophy.ucsd.edu/faculty/rarneson/Courses/g ettierphilreading.pdf http://philosophy.ucsd.edu/faculty/rarneson/Courses/g ettierphilreading.pdf

28
Issue 2. Survey Data on DEMAND A sustainable democracy requires citizens who demand democracy. Why do Africans demand democracy? normative measures only used basis of legitimacy assumes none other are also legitimate Instrumental possibility not considered among others Angelina Haugaerd states that demand for democracy in the early 1990s was not necessarily more than a convenient cover term or legitimizing symbol for widely varying local political struggles (Kenya).
..")
29
Survey data They state they can use survey data to estimate: Legitimacy: Citizens demand democracy Institutionalisation: Citizens believe their political institutions produce an acceptable degree of democracy

30
Demand: Intrinsic AND Instrumental possible? (Not within frame of inquiry. See inner/loser gaps later) DEMOCRACY Access to state resources Issue of resource scarity Patronage Group inequalities Citizens Elections stakes raised
 DEMOCRACY Access to state resources Issue of resource scarity Patronage Group inequalities Citizens Elections stakes raised.")
31
Cross-sectional data

32
Source: Afrobarometer (2009) Popular Attitudes toward Democracy in Kenya: A Summary of Afrobarometer Indicators, 2003-2008
 Popular Attitudes toward Democracy in Kenya: A Summary of Afrobarometer Indicators,")
33
Are you happy with the way democracy works? Low probability of breakdown where there is demand and perceived supply. What about control over violence no other legitimate systems false beliefs belief reality gaps End of history

34
Democrats with Adjectives Andreas Schedler & Rodolfo Sarsfield (2007) European Journal of Political Research 46: 637-659
 European Journal of Political Research 46:")
35
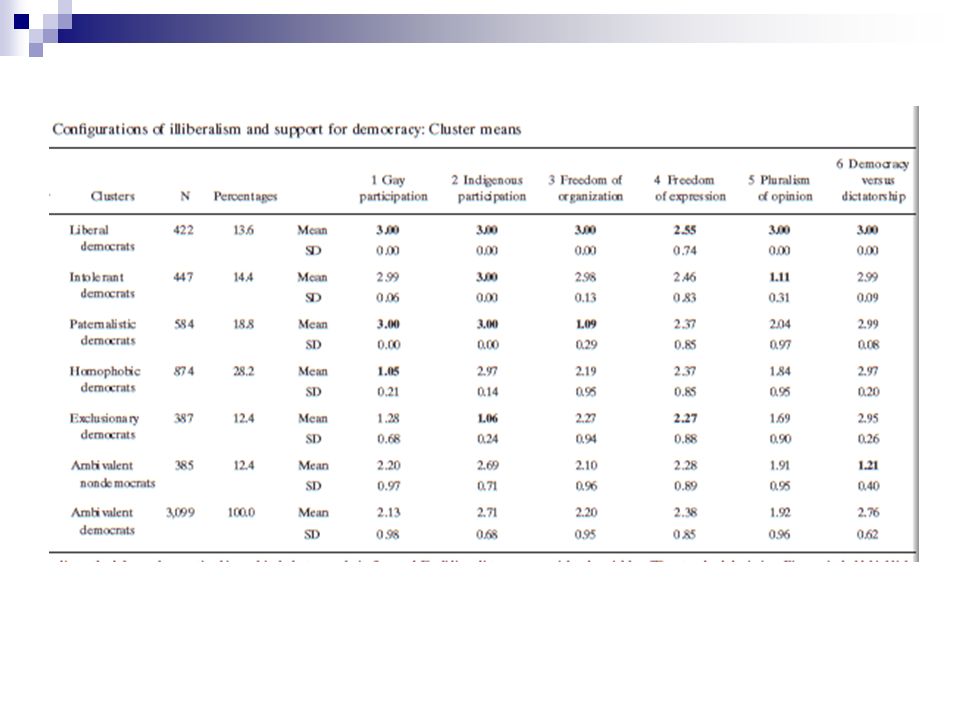
Measures Anchor Variable: What do you think is better for the country: Democracy that respects the rights of all persons or dictatorship that guarantees economic progress even without respecting the rights of all persons

36
5 indicators of liberal democracy Freedom of organisation Freedom of expression Freedom of expression (Pluralism of opinion on TV) Political equality (Indigenous participation) Political equality (Gay participation)
 Political equality (Indigenous participation) Political equality (Gay participation)")
38
Hierarchical Cluster Analysis Maximise in-group similarity, between group dis-similarity 3,099 (67.6% of cases) 6 clusters Table : 1 = authoritarian 2 = ambiguous 3 = democratic/liberal
 6 clusters Table : 1 = authoritarian 2 = ambiguous 3 = democratic/liberal")
41
Enhancing the validity & Cross- Cultural Comparability of Measurement in Survey Research Gary King, Christopher J.L. Murray, Joshua A. Salomon, Ajay Tandon (2004) American Political Science Review Feb: 2004; 98, 1
 American Political Science Review Feb: 2004; 98, 1.")
42
Follow up papers: 2010 Improving Anchoring Vignettes: Designing Surveys to Correct Interpersonal Incomparability http://people.iq.harvard.edu/~dhopkins/implement.pdf Manuscript, Harvard University, 2008 http://people.iq.harvard.edu/~dhopkins/implement.pdf Comparing Incomparable Survey Responses: Evaluating and Selecting Anchoring Vignettes, Political Analysis (2006) http://pan.oxfordjournals.org/cgi/content/abstract/mpl011 v1 http://pan.oxfordjournals.org/cgi/content/abstract/mpl011 v1 Anchors: Software for Anchoring Vignette Data Journal of Statistical Software, 2007
 v1 v1 Anchors: Software for Anchoring Vignette Data Journal of Statistical Software, 2007")
43
Example: Reported Morbidity KeralaBihar ++ literacy-- literacy ++ longevity-- longevity ++ Reported morbidity (disease) -- Reported morbidity US ++++ Morbidity (higher than Kerala)
 -- Reported morbidity US ++++ Morbidity (higher than Kerala)")
45
How to correct Adjust using Vingettes that represent increasing levels of political efficacy of hypothetical individuals. Example Alison (score 5 – highest efficacy) Moses (score 1 – lowest efficacy)
 Moses (score 1 – lowest efficacy).")
47
Critical Citizens and Submissive Subjects Devra C. Moehler (2009) British Journal of Political Science, 39: 345 - 366
 British Journal of Political Science, 39:")
48
Premise Elections are supposed to bolster legitimacy, engender compliance, moderate dissent and heighten citizen efficacy Do elections fulfil these functions in Africa? Or is there a difference between winners and losers? If yes, is that because of perceptions of electoral integrity?

49
Hypothesized effect of winner status with evaluation of electoral integrity (med)
")
50
In other words….. Winners believe their government institutions are more legitimate than losers (or independents) Where there is a gap in legitimacy this can be explained by evaluations of election fairness.
 Where there is a gap in legitimacy this can be explained by evaluations of election fairness..")
51
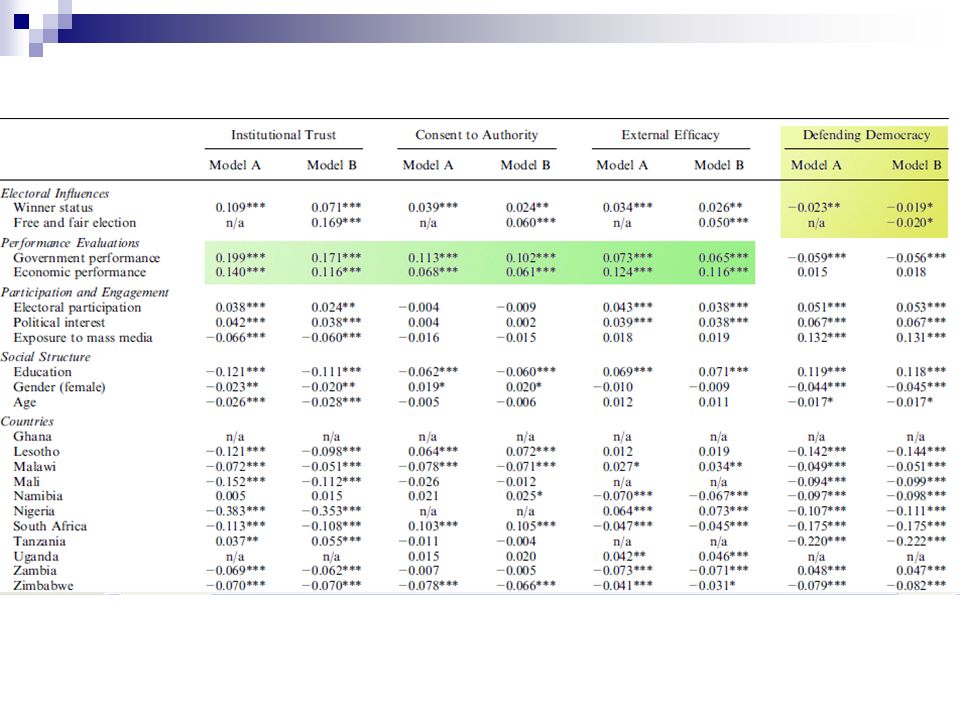
Legitimacy Measures (dependent) Institutional Trust: How much do you trust the following institutions (army, police, courts, electoral commission) Consent to Authority: Our government has the right to make decisions that all people have to abide by whether agreeing with them or not External Efficacy: No matter who we vote for, things will not get any better in the future Defending democracy: What would you do if the government took any of the following actions (Shut newspapers, dismissed judges, suspended parliament and cancelled next elections R: Support the government, Do nothing, Contact elected rep, Support opposition party, join a protest or boycott, other
 Institutional Trust: How much do you trust the following institutions (army, police, courts, electoral commission) Consent to Authority: Our government has the right to make decisions that all people have to abide by whether agreeing with them or not External Efficacy: No matter who we vote for, things will not get any better in the future Defending democracy: What would you do if the government took any of the following actions (Shut newspapers, dismissed judges, suspended parliament and cancelled next elections R: Support the government, Do nothing, Contact elected rep, Support opposition party, join a protest or boycott, other")
52
Explanatory Vars Free and Fair Elections Winner Status Do you feel close to any political party (0 - 2) Government performance: Education, health, creating jobs, stable prices (0-16) Economic performance: How satisfied with economy today, one year ago, + 1 year (0-16) Electoral participation: Did you vote most recent election, attended election rally, work for party/candidate (scale 0-3) Political interest (0-3) Exposure to mass media (0-15) Education (0-3), Gender and Age (15-100)
 Government performance: Education, health, creating jobs, stable prices (0-16) Economic performance: How satisfied with economy today, one year ago, + 1 year (0-16) Electoral participation: Did you vote most recent election, attended election rally, work for party/candidate (scale 0-3) Political interest (0-3) Exposure to mass media (0-15) Education (0-3), Gender and Age (15-100)")
53
Institutional trust among losers, non-partisans and winners Note: Sign indicates winner–loser gap at 0.05 level of significance.

54
Consent to authority among losers, non-partisans, and winners Note: Sign indicates winner–loser gap at 0.05 level of significance.

55
External efficacy among losers, non-partisans and winners Note: Sign indicates winner–loser gap at 0.05 level of significance.

56
W illingness to defend democracy among losers, non-partisans & winners Note: Sign indicates winner–loser gap at 0.05 level of significance.

57
Why? If the government took an action against current democratic institutions, what would you do? Forced to choose

59
Testing the gap: mediating variable

60
Do winners think elections are fairer than losers (b)? Effects significant at p<.001
 Effects significant at p<.001")
62
Evaluations of elections related to perceived legitimacy of institutions (c)? Model B, variable significant p<0.001 across three measures Mediation effect (a) of elections on perceived legitimacy -> Yes but partial (difference between A and B Models)
 of elections on perceived legitimacy -> Yes but partial (difference between A and B Models).")
63
Conclusions Electoral integrity matter is only part of the answer in explaining gaps Government performance and economic conditions matter more for institutional legitimacy. Institutional legitimacy is based more on rational calculations than partisan affiliation.

64
Alternatives for research Level of democracy, rule of law, type of political system, opposition party behaviour, and institutional performance (Liberal-democratic framework). Cleaning up elections not enough to win support of losers.

65
Group Discussion Bratton & Mattes paper: is the proposition of the first paper valid – that perception of supply and demand can be regarded as predictors of democratic consolidation? What do the findings of Gary King et al. and Schedler & Sarsfield imply for knowledge derived from Afrobarometer studies (and other large-n survey studies)?
 .")
66
Positivism King, Keohane and Verba (1994) Theories must be empirically verified Directly observable implications Falsifiable Replicable Verifiable Generalizability
 Theories must be empirically verified Directly observable implications Falsifiable Replicable Verifiable Generalizability")
67
Critique James Johnson (2006) Consequences of Positivm: A Pragmatic Assessment, Comparative Political Studies Critiques the New Orthodoxy Concerned with causal effects Causal explanation Henry Brady states: not exactly clear how explanation fits into KKVs categories of descriptive and causal inference Example: Link between democracy and prosperity Lack adequate theoretical account off the mechanisms that sustain the observed regularity
 Consequences of Positivm: A Pragmatic Assessment, Comparative Political Studies Critiques the New Orthodoxy Concerned with causal effects Causal explanation Henry Brady states: not exactly clear how explanation fits into KKVs categories of descriptive and causal inference Example: Link between democracy and prosperity Lack adequate theoretical account off the mechanisms that sustain the observed regularity")
68
Complexity Theory Shift our analysis from individual parts of a political system to the system as a whole Complex adaptive systems Non-linear Shift, adapt and learn (evolution) Emergence: complexity and patterns arise out of a multiplicity of relatively simple interactions. Rejection of reductionism

69
Sylvia Walby (2007) Complexity Theory, Systems Theory, and Multiple Intersecting Social Inequalities, Philosophy of the Social Sciences
 Complexity Theory, Systems Theory, and Multiple Intersecting Social Inequalities, Philosophy of the Social Sciences")
70
Cultural Transmission Between and Within Generations Alberto Acerbi and Domenico Parisi (2006) Journal of Artificial Societies and Social Simulation 9(1)
 Journal of Artificial Societies and Social Simulation 9(1)")
71
Cultural Transmission Horizontal Oblique Vertical Parents Unrelated individual Peer Child

72
Mushroom experiment Random assignment of connection weights Agents that perform better are selected as teachers Learned behaviour not the same – random changes introduced Rare cases behaviour is better Reproduction of best individuals + and constant addition of new variability =>acquisition across generations of more effective and better adapted behaviours

73
Hypotheses Horizontal transmission way of introducing random noise in the cultural transmission process Tradition environment: - Changing environment: + (eliminate + create new behaviours)
")
74
Agent's visual field & the input encoding the content of the visual field

75
Generations 100 agents per generation (500 cycles) 500 generations No genetic inheritance Learning by cultural transmission and evolution
 500 generations No genetic inheritance Learning by cultural transmission and evolution")
76
How does cultural learning happen? Learning in first 6 (out of10) epochs Each time teacher randomly chosen from 5 best of previous generation/own generation 200 input patterns Output =? Same as teaching input? Use error to modify behaviour (learning through repetition) Aim towards 0 error Learning through imitation
 epochs Each time teacher randomly chosen from 5 best of previous generation/own generation 200 input patterns Output =. Same as teaching input. Use error to modify behaviour (learning through repetition) Aim towards 0 error Learning through imitation.")
78
Inter-generational

79
Intra-generational

80
? So what if any is the value of intra generational learning if agents cant learn adaptive behaviours?

81
Noise is important for evolution Certain quantity of statistical noise is necessary for the emergence of adaptive behaviors via either genetic or cultural transmission.

82
Removing Noise from Inter-generational teachers With noise (grey line) & Without noise (black line)
 & Without noise (black line)")
83
Change simulation There is noise in cultural transmission (inter-generational transmission enough intra-generational not necessary) Environment changes abruptly after the population has had time to adapt to the preceding environment.
 Environment changes abruptly after the population has had time to adapt to the preceding environment.")
84
The variable α specifies the probability that an individual will choose as its teachers the best individuals among its own peers, instead of choosing them among the best individuals of the preceding generation.

85
RESULTS The results show that pure inter- generational transmission (α = 0) only very slowly makes it possible to adapt to such a rapid change in the environment.
 only very slowly makes it possible to adapt to such a rapid change in the environment.")
86
Cultural transmission α = 0.3 (grey line) and α = 0, pure intergenerational transmission (black line)
 and α = 0, pure intergenerational transmission (black line)")
87
Modelling Epstein (2008) Explain (very distinct from predict) Challenge the robustness of prevailing theory through perturbations Expose prevailing wisdom as incompatible with available data Other Inter-disciplinary Addresses causal explanation critique Bridges qualitative/quantitative divide
 Explain (very distinct from predict) Challenge the robustness of prevailing theory through perturbations Expose prevailing wisdom as incompatible with available data Other Inter-disciplinary Addresses causal explanation critique Bridges qualitative/quantitative divide")
88
Other papers of interest… Alam, Meyer, Ziervoegel and Moss (2007) The impact of HIV/AIDS in the Context of Socioeconomic Stressors: an Evidence-Driven Approach, Journal of Artificial Societies and Social Simulation Timmerman & de Haan (2008) (Rotterdam Uni) Computational and mathematical approaches to societal transitions Computational Mathematical Organization Theory
 The impact of HIV/AIDS in the Context of Socioeconomic Stressors: an Evidence-Driven Approach, Journal of Artificial Societies and Social Simulation Timmerman & de Haan (2008) (Rotterdam Uni) Computational and mathematical approaches to societal transitions Computational Mathematical Organization Theory")
Similar presentations


>")


, Brighton Organisation: Institute of Development Studies,>")


