Download presentation
Presentation is loading. Please wait.

1
Net Zero Energy Housing Workshop April 5, 2012
Carter Scott, President Transformations, Inc. Townsend, MA (978)
")
2
Copyright Materials This presentation is protected by US and International Copyright laws. Reproduction, distribution, display and use of the presentation without written permission of the speaker is prohibited. © 2012 Transformations, Inc.

4
HERS Index Results… HERS Index of -4

5
The Farmhouse (Built in Townsend, MA in 2008)
Applying what we learned in the “Zero Energy Challenge” to production home building.

7
Cost Effective Insulation
Cellulose in the attic floor, R 3.5 per inch (18” for an R-63) Low Density Foam in the walls, R 3.9 per inch (12” for a cavity insulation of R-46.8). Note, We now mainly use ThermoSeal 500, R 3.8 per inch. It is a water based foam, reducing blowing agent off-gassing concerns.
 Low Density Foam in the walls, R 3.9 per inch (12 for a cavity insulation of R-46.8). Note, We now mainly use ThermoSeal 500, R 3.8 per inch. It is a water based foam, reducing blowing agent off-gassing concerns.")
8
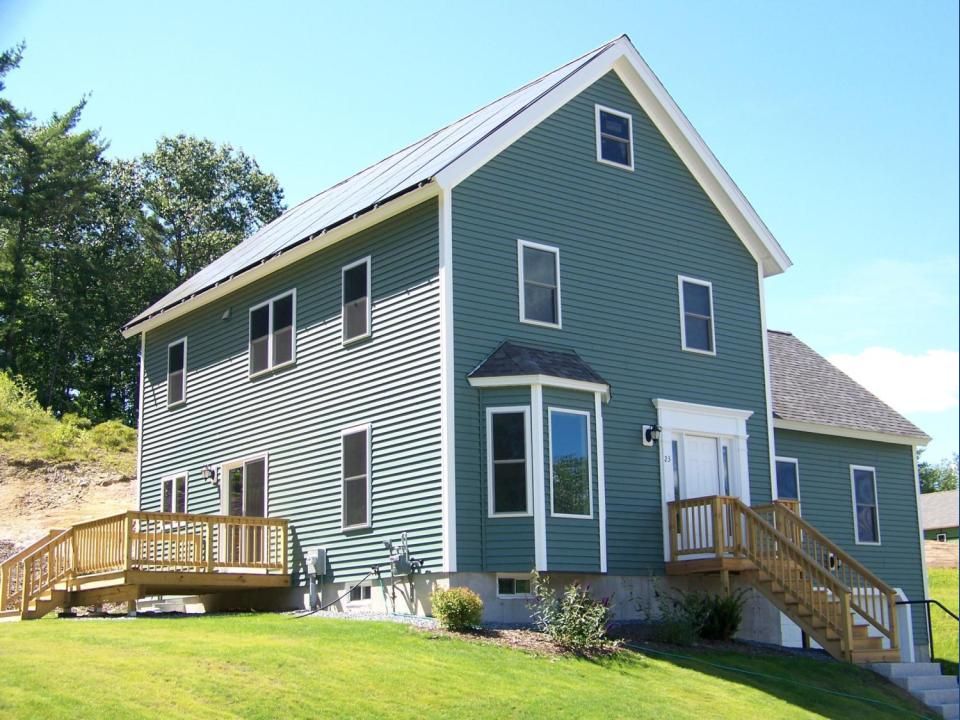
The Groton Built in Townsend, MA in (a home with 12 months of utility statements showing positive energy)
")
13
HERS Index and Energy Usage
The Groton HERS Index came in at a 2 The actual energy usage came in at kWh per year. cents per kWh, the yearly credit built up was $315 or about $26 per month

14
$ Credit Balance! Only three months with net electric energy usage -1,574 net electric energy usage for the year Enough electric energy to run a plug in Prius or Nissan Leaf a majority of the year!

15
Zero Energy Attainable Development Easthampton, MA Production building for a Developer
33 units total Savings of about 60% in the base houses Optional PV as a lease, a purchase or a hybrid purchase.

16
“The Farmhouse II” Model Home Easthampton, MA
1818 square feet of living space 3 Bedrooms $ psf including overhead and margin ($ psf hard costs to build) HERS Index of 2
 HERS Index of 2.")
17
Farmhouse Parametric Modeling

22
Mitsubishi inside unit
Model #MSZ-FE12NA (One 12,000 BTU head downstairs and one 12,000 BTU head upstairs)
")
23
Mitsubishi Outside Units
Two Model #MUZ-FE12NA condensers Set up off the ground

24
Master Bathroom

25
Price Point Innovations in bringing Zero Energy Homes to the marketplace contribute to this price point: Utilizing the Federal PV cash incentives and the new S-RECS Lease PV systems Cost effective HVAC systems

26
Solar Electric Installations
R. Carter Scott Transformations, Inc.

29
Solar Electric System Farmhouse II Model
36 panels 210 watts per panel 3 strings of panels Racking Inverter

30
Solar Electric Installation Options
Short on capital? Lease with no money down Receive a 10% discount on the power produced. Have the capital? Buy the system Enjoy the incentives Become cash flow positive in about 6-7 years

31
Solar Electric Installations 7.56 kW Case Study---Costs
The typical cost per watt is $5.50 For the 7.56 kW system, the cost is $41,580 Micro-inverters add about 50 cents per watt. High efficiency panels (SunPower ~18% efficiency) add about $1 per watt.
 add about $1 per watt.")
32
Solar Electric Installations 7.56 kW Case Study---Incentives
The Federal tax credit is 30%: $12,474 for a $41,580 system. Massachusetts has a $1,000 tax credit per system The Massachusetts Clean Energy Center (CEC) has a $2,000 incentive (with MA component adder). Plus S-RECS (see next slides)
 has a $2,000 incentive (with MA component adder). Plus S-RECS (see next slides)")
33
Renewable Portfolio Standards
Massachusetts has a Renewable Portfolio Standard (RPS). It requires a growing percentage of the electricity to be renewable (RPS Class 1). For 2011, the RPS is 6% of the electricity sold. The RPS is expected to go up 1% per year for several years.
. It requires a growing percentage of the electricity to be renewable (RPS Class 1). For 2011, the RPS is 6% of the electricity sold. The RPS is expected to go up 1% per year for several years.")
34
Solar Carve Out There is a carve out for solar electricity (RPS Class 1 Solar Carve Out). The solar carve out percentage of 5% of the Renewable Energy Portfolio (RPS) standard. For 2011, the solar carve out is 5% of the 6% Renewable Portfolio Standard requirement (.05 times .06 or .003).
 standard. For 2011, the solar carve out is 5% of the 6% Renewable Portfolio Standard requirement (.05 times .06 or .003).")
35
Alternative Compliance Payment Rates
If the utility does not have the solar carve out percentage it either needs to pay the ACP rate for 2012 of $550 or… Purchase Solar Renewable Energy Credits.

36
S-RECs Cash Flow YR 1 An S-REC is 1,000 kilowatt hours or a megawatt
This 7.56 kW system will generate about 9,072 kilowatt hours in the first year (9 SRECs). The utilities are currently paying about $20 less than the penalty for the S-RECS and there is an aggregator fee of about 7% ($530 *.93 = $493) 9 S-RECs times $493 = $4,437 in year 1.
. The utilities are currently paying about $20 less than the penalty for the S-RECS and there is an aggregator fee of about 7% ($530 *.93 = $493) 9 S-RECs times $493 = $4,437 in year 1.")
37
Solar Electric Installations S-REC Cash Flow YR 2-10
The system will likely lose about 1% efficiency per year in overall production. The ACP rate will decrease in value over the course of the rest of the S-REC life (years 2-10). With a averaged efficiency loss of about 5% and an averaged S-REC value reduction of about 20% (the chart DOER chart has an average reduction of 16%) year 2-10 should average about $3,328 per year or $29,952 in years 2-10. Total S-REC income of about $34,389 over 10 years!!!
. With a averaged efficiency loss of about 5% and an averaged S-REC value reduction of about 20% (the chart DOER chart has an average reduction of 16%) year 2-10 should average about $3,328 per year or $29,952 in years Total S-REC income of about $34,389 over 10 years!!!")
38
Year ACP Rate per MWh 2012 $550 2013 2014 $523 2015 $496 2016 $472
Year ACP Rate per MWh 2012 $550 2013 2014 $523 2015 $496 2016 $472 2017 $448 2018 $426 2019 $404 2020 $384 2021 $365 2022 $347

39
Solar Electric Installations Electrical output of the system
The 7.56 kW system will generate about 9,072 kilowatt hours in the first year, and average about 8,618 per year for the first 10 years At $.17 per kilowatt hour, that is $1465 per year or 14,650 over a ten year period.

40
Solar Electric Installations Total Revenue over 10 years
The Federal tax credit: $12,474 Massachusetts tax credit: $1,000 The Massachusetts CEC: $2,000 S-RECs: $34,389 Electricity: $14,650 Total Revenue: $64,513

41
Solar Electric Installations Total Revenue over 10 years
Total Cost: $41,580 ($5.50 per watt) 10 year return: $22,933 20 more years of electricity and regular RECs free and clear!
 10 year return: $22, more years of electricity and regular RECs free and clear!")
42
Beyond Zero Energy Homes… Net Positive Homes

43
Carbon Reduction Transportation Sector
With a Positive Energy Home, we can reduce our share of the 40% of the carbon that is associated in the United States with the transportation sector.

44
Option 1: Produce more renewable energy
With higher efficiency panels (18% instead of 14%), more power can be generated on the roof. Our 7.56 kW example can yield kW with SunPower panels. This is 33% additional power 2.52 kW for our home
, more power can be generated on the roof. Our 7.56 kW example can yield kW with SunPower panels. This is 33% additional power kW for our home.")
45
A Custom Home in Princeton, MA with a 14.4 kW PV system
HERS Index of -9

47
Princeton home Energy Positive performance… 26 - 51 panels online

48
Option 2: Conserve more energy
Higher efficiency windows Thicker walls Passive House techniques

49
15 ½ thick walls, Air infiltration of.50 ACH @50 pascals
A Custom Home is Stow MA 15 ½ thick walls, Air infiltration of.50 pascals

50
A Custom Home is Maynard, MA
Large overhangs protect the home from summer solar heat gain.

51
The colored Insulated slab is protected during construction.
Framing The colored Insulated slab is protected during construction.

52
HERS Index of -8

53
Charging stations on the Street
PV Powered Automobile Charging stations on the Street

54
Some of the vehicles in the pipeline for 2010-12
Nissan Chevrolet Mitsubishi Ford Tesla Smart

55
Plug-In Vehicles Enter Markets in Late 2010 - What is the Near-Term Achievable Market Penetration?
Market penetration grows as vehicle production numbers increase, new models are introduced, and economies of scale drive down prices. (source: Southern California Edison) & Obama goal of 1 million Ev’s by 2020
 & Obama goal of 1 million Ev’s by")
56
Electric vehicles and the environment

57
Resources… The Massachusetts Clean Energy Center (CEC) website: The Massachusetts Department of Energy Resources website: The DSIRE website has lists of utility sponsored financial incentive programs, Mass CEC rebates, and all state and federal energy efficiency tax credits: The Transformations, Inc. website:

58
Net Zero Energy Housing Workshop
Questions? Carter Scott, President, Transformations, Inc. Zero Energy Homes Solar Electric Installations

Similar presentations


 February 3, 2009 Gainesville Regional Utilities.>")


