Download presentation
Presentation is loading. Please wait.

1
EBM Journal Club Sarah Jean Strube, D. O. Resident Physician St
EBM Journal Club Sarah Jean Strube, D.O. Resident Physician St. Mary Medical Center October 17, 2008

2
Overview Topic Background Defining the patient Article
Methods Results Statistics Author’s conclusion Statistics discussion

3
Topic Reperfusion injury status post PCI in acute myocardial infarction with and without cyclosporine injection on area of infarction.

4
Background Myocardial infarction is a disabling disease and infarct size is considered a major determining factor for mortality. Limiting the size of an infarct through reperfusion therapy is an important strategy in decreasing morbidity whether through thrombolysis or PCI. However, reperfusion has its own detrimental effects through several mechanisms. One of which is via mitochondrial dysfunction.

5
Background Mitochondrial dysfunction has been termed “permeability transition.” It is the opening of a nonspecific channel in the inner membrane of the mitochondria. This transition results in uncoupling of the respiratory chain and collapse of the inner mitochondrial membrane potential with subsequent efflux of proapoptotic factors causing myocardiocyte death.

6
BACKGROUND Cyclosporine is mostly known for its immunosuppressive effects. However, it has been found by several researchers in experimental models to have potent inhibiting effects on mitochondrial permeability transition and may prevent ischemia/reperfusion injury.

7
PICO Question Patient Intervention Control Outcome

8
PICO question Patient: A 65 YO male with a Hx of HTN, dyslipidemia and prior tobacco use presented to the Emergency Department with prolonged angina pectoris. Onset of his CP was six hours prior to admission and he was found to have an acute ST-segment elevation in two contiguous precordial leads along with elevation of CK and troponin I. An acute myocardial infarction was Dx and he was considered a candidate for urgent PCI.

9
PICO QUESTION Intervention: Administration of cyclosporine via IV bolus at time of urgent PCI but prior to stenting of an occluded artery (TIMI flow 0) in an acute ongoing myocardial infarction
 in an acute ongoing myocardial infarction.")
10
PICO Question Control: NS bolus during PCI with stenting alone prior to the procedure in an occluded artery (TIMI flow 0).
.")
11
PICO question Outcome: did the intervention with pretreatment with cyclosporine vs normal saline decrease the area of myocardial infarction SP PCI?

12
To evaluate the efficacy of a therapy
Article selected Effect of cyclosporine on reperfusion injury in acute myocardial infarction. New England Journal of Medicine 2008; 359: Research objective: To evaluate the efficacy of a therapy

13
The article Original research, pilot study
Prospective, multicenter, randomized, single blind, controlled trial Journal - peer reviewed, general Internal Medicine, highly respected Sites – multicenter Patients – 58 randomly assigned, 30 CS 28 control

14
Patient Criteria EXCLUSION INCLUSION Cardiac arrest Cardiogenic shock
Vent fibrillation Stent thrombosis Previous MI Angina wi 48h Occl LM/Circ or collaterals Hypersensitivity to cyclosporine INCLUSION Male/female 18y or older present wi 12h of CP STEMI 0.1 mV 2 cont leads PCI eligible TIMI flow grade 0 at time of admission

15
Other exclusions: Renal or liver failure Uncontrolled hypertension
Pregnancy Women of childbearing age not on contraception Any Ds of immunologic dysfunction; CA, HIV, hepatitis

17
Study Population July 2005 to October patients at three centers were hospitalized for management of acute MI Approximately 80% men, mean age 58y 230 underwent PCI, 24 not enrolled - inadequate manpower; 148 excluded, see below Baseline characteristics of subjects were similar

18
Study Population Similar in ischemia time, myocardium at risk and EF prior to PCI - MRI Thombolytic therapy failed in 13 patients prior to PCI, 8 in control, 5 in CS Culprit lesion stented in all patients and only infarct related lesions treated Four patients, TIMI 2 flow was not achieved SP PCI

19
Study Population Baseline Characteristics
Men/women - 25/5 mean age 58 +/- 2y BMI mean 26 +/- 1, dyslipidemia 14, HTN 15, DM 4 HX CAD 4 Tobacco 17 Control Men/women – 21/7 mean age 57 +/- 2y BMI mean 27 +/- 1, dyslipidemia 12, HTN 13 , DM 4 HX CAD 4 Tobacco 16

21
Methods Randomization: after coronary angio, before stent, a computer generated sequence assigned patients to receive placebo vs cyclosporine Intervention: IV bolus of cyclosporine 2.5mg/kg of BW, control given equivalent volume in NS

22
Blood Concentration of Cyclosporine during Reperfusion
Figure 4. Blood Concentration of Cyclosporine during Reperfusion. The whole-blood concentration of cyclosporine is shown at various times during early reperfusion. T bars denote standard errors. Piot C et al. N Engl J Med 2008;359:

23
Statistical Analysis Calculated target sample size of 62 pts based on prior trial, 31 per group Hypothesized that CS would reduce the AUC for CK release by 30% for a power of 80% Probability of a type I error of 0.05 using a two sided test Between group comparisons for AUC for trop, CK, area at risk, and infarct size by MRI evaluated with Wilcoxon rank-sum

24
Statistical Analysis Analysis of covariance performed on the equality of slopes on the regression of infarct size on the area at risk in CS and control Comparison of incidence of cumulative adverse events between groups using Fisher exact test

25
END POINTS Primary : size of the infarct assessed by measurements of cardiac biomarkers Secondary : size of infarct measured by area of hyper-enhancement seen on cardiac MRI, assessed day 5

26
END POINTS Other: major adverse events first 48h including death, MI, heart failure, stroke, recurrent ischemia, renal/liver insufficiency, vascular complications, and bleeding

27
RESULTS The cyclosporine and the control group were similar in ischemia time, area of myocardium at risk and EF prior to PCI

28
RESULTS Assessment of infarct size by biomarkers:
CK release sig decreased in CS group vs control group over time (P=0.04) Trop I not sig decreased in CS group vs control group over time (P=0.15)
 Trop I not sig decreased in CS group vs control group over time (P=0.15)")
29
RESULTS Infarct size as a function of area at risk
For any given area at risk CS administration was associated with a reduction infarct size as measured by CK/trop I release (P=0.006) / (P=0.002)
 / (P=0.002)")
30
Assessment of Infarct Size by Biomarker Measurement
Figure 1. Assessment of Infarct Size by Biomarker Measurement. Serum creatine kinase was measured every 4 hours on day 1 and every 6 hours on days 2 and 3 after coronary reperfusion. Curves for the control and cyclosporine groups are shown in Panel A. Cyclosporine administration (Adm.) resulted in a significant reduction in infarct size of approximately 40% as measured by creatine kinase release. Serum troponin I was measured every 4 hours on day 1 and every 6 hours on days 2 and 3 after coronary reperfusion. Curves for the control and cyclosporine groups are shown in Panel B. Cyclosporine administration did not result in a significant reduction in infarct size as measured by troponin I release. T bars denote standard errors. Piot C et al. N Engl J Med 2008;359:
 resulted in a significant reduction in infarct size of approximately 40% as measured by creatine kinase release. Serum troponin I was measured every 4 hours on day 1 and every 6 hours on days 2 and 3 after coronary reperfusion. Curves for the control and cyclosporine groups are shown in Panel B. Cyclosporine administration did not result in a significant reduction in infarct size as measured by troponin I release. T bars denote standard errors. Piot C et al. N Engl J Med 2008;359:")
31
Infarct Size as a Function of the Area at Risk
Figure 2. Infarct Size as a Function of the Area at Risk. The area under the curve (AUC) for serum creatine kinase release was expressed as a function of the circumferential extent of abnormally contracting segments (ACS), an estimate of the area at risk, as shown in Panel A. There was a significant correlation between the two variables in the control group (r2=0.60). Data points for the cyclosporine group (r2=0.34) lie below the regression line for the control group. These data indicate that, for any given area at risk, cyclosporine administration was associated with a reduction in the resulting infarct size as measured by creatine kinase release. This difference was significant by analysis of covariance (P=0.006). There was also a significant correlation between the AUC for troponin I release and the area at risk in the control group (r2=0.54), as shown in Panel B. Data points for the cyclosporine group (r2=0.26) lie below the regression line for the control group. These data indicate that, for any given area at risk, cyclosporine administration was associated with a reduction in the resulting infarct size as measured by troponin I release. This difference was confirmed to be significant by analysis of covariance (P=0.002). Piot C et al. N Engl J Med 2008;359:
 for serum creatine kinase release was expressed as a function of the circumferential extent of abnormally contracting segments (ACS), an estimate of the area at risk, as shown in Panel A. There was a significant correlation between the two variables in the control group (r2=0.60). Data points for the cyclosporine group (r2=0.34) lie below the regression line for the control group. These data indicate that, for any given area at risk, cyclosporine administration was associated with a reduction in the resulting infarct size as measured by creatine kinase release. This difference was significant by analysis of covariance (P=0.006). There was also a significant correlation between the AUC for troponin I release and the area at risk in the control group (r2=0.54), as shown in Panel B. Data points for the cyclosporine group (r2=0.26) lie below the regression line for the control group. These data indicate that, for any given area at risk, cyclosporine administration was associated with a reduction in the resulting infarct size as measured by troponin I release. This difference was confirmed to be significant by analysis of covariance (P=0.002). Piot C et al. N Engl J Med 2008;359:")
32
MRI or CMR MRI has been used since 1984 on imaging of the heart and recently improved technology with contrast enhancement improves delineation of hyper-enhanced regions (acute MI)
")
33
MRI Bright is dead

34
RESULTS Subgroup analysis 27 patients:
Infarct size (absolute mass) decreased on MRI day 5 in CS group 37 g vs 46 g control group (P=0.04) Area of infarction: E A X slice thick X M sd
 decreased on MRI day 5 in CS group 37 g vs 46 g control group (P=0.04) Area of infarction: E A X slice thick X M sd.")
35
Typical Cine Image and Contrast-Enhanced Image Obtained by MRI before Revascularization
Figure 1. Typical Cine Image and Contrast-Enhanced Image Obtained by MRI before Revascularization. Registration of the images was not required, because both types were acquired during the same MRI session. Twelve equal circumferential segments were analyzed in each short-axis view. For contrast-enhanced images, the transmural extent of hyperenhancement was determined for each segment with use of the following equation: percentage of area that was hyperenhanced = 100 x area A / (area A + area B). Kim R et al. N Engl J Med 2000;343:
. Kim R et al. N Engl J Med 2000;343:")
36
Typical Contrast-Enhanced Images Obtained by MRI in a Short-Axis View (Upper Panels) and a Long-Axis View (Lower Panels) in Three Patients Figure 2. Typical Contrast-Enhanced Images Obtained by MRI in a Short-Axis View (Upper Panels) and a Long-Axis View (Lower Panels) in Three Patients. Hyperenhancement is present (arrows) in various coronary-perfusion territories -- the left anterior descending coronary artery, the left circumflex artery, and the right coronary artery -- with a range of transmural involvement. Kim R et al. N Engl J Med 2000;343:
 and a Long-Axis View (Lower Panels) in Three Patients. Hyperenhancement is present (arrows) in various coronary-perfusion territories -- the left anterior descending coronary artery, the left circumflex artery, and the right coronary artery -- with a range of transmural involvement. Kim R et al. N Engl J Med 2000;343:")
37
Assessment of Infarct Size by Magnetic Resonance Imaging (MRI)
Figure 3. Assessment of Infarct Size by Magnetic Resonance Imaging (MRI). The size of the area of late hyperenhancement on MRI is presented for 11 patients in the control group (black circles) and 16 patients in the cyclosporine group (white circles). The mean infarct size as assessed by MRI was significantly greater in the control group (black square) than in the cyclosporine group (white square). The size of the area of late hyperenhancement was calculated with the use of the following formula: infarct mass (in grams of tissue)=S (hyperenhanced area [in square centimeters])×slice thickness (in centimeters)×myocardial specific density (1.05 g per cubic centimeter). P=0.04 for the comparison with the control group. Piot C et al. N Engl J Med 2008;359:
. The size of the area of late hyperenhancement on MRI is presented for 11 patients in the control group (black circles) and 16 patients in the cyclosporine group (white circles). The mean infarct size as assessed by MRI was significantly greater in the control group (black square) than in the cyclosporine group (white square). The size of the area of late hyperenhancement was calculated with the use of the following formula: infarct mass (in grams of tissue)=S (hyperenhanced area [in square centimeters])×slice thickness (in centimeters)×myocardial specific density (1.05 g per cubic centimeter). P=0.04 for the comparison with the control group. Piot C et al. N Engl J Med 2008;359:")
38
Author’s Conclusion The effect of CS in this small pilot study of patients having an acute myocardial infarction undergoing PCI, showed a decrease in infarct size as measured by release of CK and delayed hyper-enhancement on MRI. Trop I was not significantly reduced by CS

39
Evaluation Methods: randomized, but unclear if truly similar in ischemia time Blinded to full extent allowable All patients accounted for Subgroup was noted beforehand (MRI) and not added later because of Tx effects Small population but was a pilot study
 and not added later because of Tx effects. Small population but was a pilot study.")
40
Evaluation Outcomes Results definitely applied to my patient
Results are meaningful, however difficult to know if truly affected mortality CS did show Tx effect especially in MRI group with proven validity of acute MI hyper-enhancement

41
Statistics Discussion
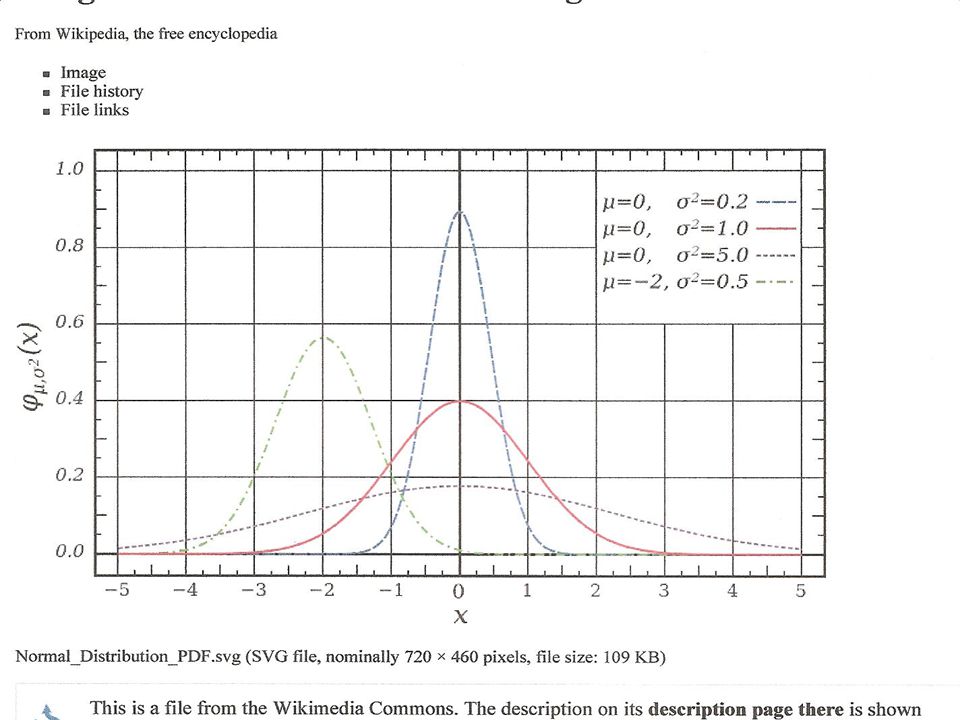
To review Between group comparisons for AUC for trop, CK, area at risk, and infarct size by MRI evaluated with Wilcoxon rank-sum AUC for normal data is a Gaussian distribution and the usual parametric stats can be used With non normal data (continuous or ordinal data) nonparametric stats like Wilcoxin rank sum can be used
 nonparametric stats like Wilcoxin rank sum can be used.")
44
Wilcoxin Rank Sum A descriptive nonparametric statistic using non normal data. Similar to performing a two sample t test Why use Wilcoxin? Appropriate for small population Easier to interpret ordinal or continuous data No assumption of population distribution More robust

45
Wilcoxin Rank Sum Disadvantages Less sensitive Less power
Not appropriate for large N

46
Wicoxin Rank Sum The procedure:
Arrange observations for both groups into a single rank series Add up the ranks for both series The rank sum is then divided by the number of observations Observe the rank sum difference, as the magnitude tells you how close the groups are

47
Wicoxin Rank Sum Example CA NV 4 2 5 3 6 7 8 9 10 11
Imagine choosing an Olympic Team of Karate experts from two states, CA and NV. Your decision is based on how many boards each athlete can break in 5 minutes Statistics in a Nutshell CA NV 4 2 5 3 6 7 8 9 10 11

48
CA NV Rank 2 1 3 4 5 6 7 8 9

49
CA NV Rank 6 2 10 7 11 8 3 12 9 13 4 14 15 5 16 17 18

50
CA NV Rank 2 1 3 2.5 4 5 7.5 6 9.5

51
CA NV Rank 7 11 8 12 9 14 10 16.5 16-5 18

52
Wilcoxin Rank Sum Sum the ranks
E (CA) = = 96.5 E (NV) = = 74.5 So I choose the California team to go to the Olympics Statistics in a Nutshell
 = = E (NV) = = So I choose the California team to go to the Olympics. Statistics in a Nutshell.")
53
Questions?

Similar presentations


 patients Policy.>")


 Trial Presented at The American College of.>")


