Download presentation
Presentation is loading. Please wait.

2
Global outlook: Two-speed recovery in motion Real GDP Growth (percent change from a year earlier) 20000204 World Emerging economies Advanced economies 100608 Temporary slow-down 2010:H2 2011:H1
 World Emerging economies Advanced economies Temporary slow-down 2010:H2 2011:H1")
3
3 A closer look at the two-speed recovery Real GDP Growth (percent change from a year earlier)
")
4
4 Prospects for World GDP Growth (percent change) Downside risks remain, but global double-dip unlikely
 Downside risks remain, but global double-dip unlikely")
5
Rebalancing is needed along two dimensions Demand from external surplus economies 5 Demand from external deficit economies Private demand Public demand

6
6 Inflationary pressures are forecast to remain subdued Core Inflation (Twelve-month change in the core CPI) 06200204 Jul. 10 08 For countries with a peg to the USD or euro, this means that higher inflation rates may lead to real appreciation.

7
7 Oil Demand Growth (contributions to y-o-y growth in percent) Total demand
 Total demand")
8
8 Major Food Crops, Nearest Futures Prices (index, Jul. 1, 2010 = 100) Wheat Corn Temporary Wheat Supply Shock, Limited Spillovers
 Wheat Corn Temporary Wheat Supply Shock, Limited Spillovers.")
9
Net Monthly Flows to Emerging Market Equity Funds (billions of U.S. dollars) Sep. 10 Net Monthly Flows to Emerging Market Bond Funds (billions of U.S. dollars) 9 Capital flows to emerging markets pick up Sep. 10
 Sep. 10 Net Monthly Flows to Emerging Market Bond Funds (billions of U.S. dollars) 9 Capital flows to emerging markets pick up Sep. 10.")
11
Recovery continues Oil production picks up, fiscal/external balances improve But private sector is lagging Fiscal space allowing continued stimulus in some countries Risks/medium term challenges Keep eye on inflation Financial sector development and stability Reorienting spending, reducing reliance on oil revenues

12
Global demand recovers, boosts activity Sources: National authorities; and IMF staff estimates. MENAP Oil Exporters

13
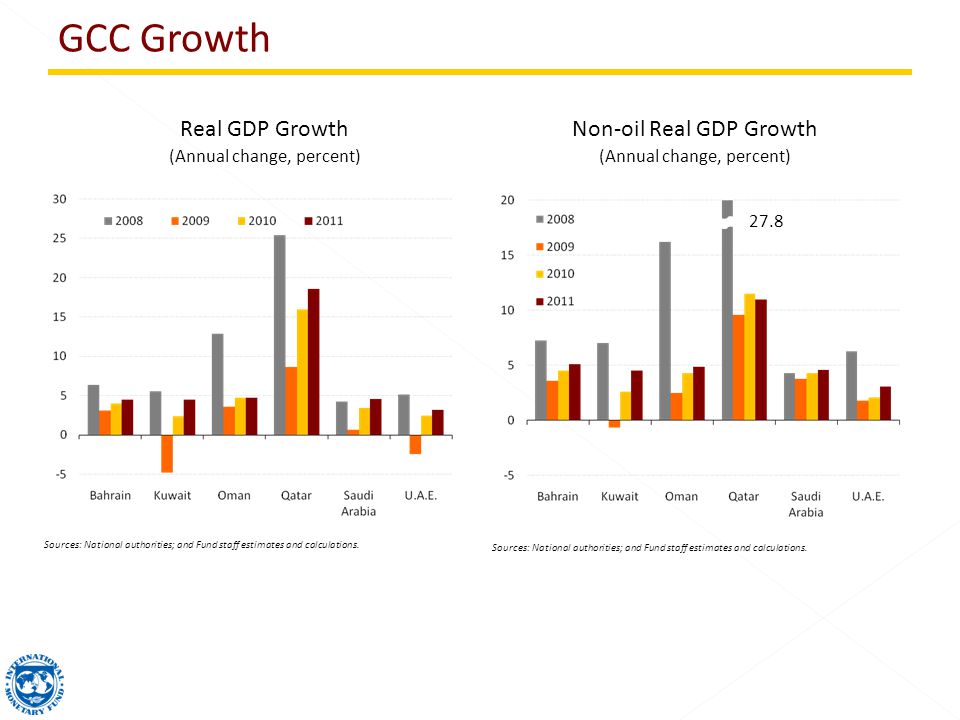
Non-oil Real GDP Growth (Annual change, percent) Real GDP Growth (Annual change, percent) Sources: National authorities; and Fund staff estimates and calculations. 27.8
14
…and external balances rebound Sources: National authorities; and IMF staff estimates. MENAP Oil Exporters $257 $75 $101 $124 $107 $5 $23 $31 -$6 -$10 -$7

15
Sources: National authorities; and Fund staff estimates and calculations. Gross International Reserves (Billions of U.S. Dollars) Current Account Balance (Percent of GDP) Sources: National authorities; and Fund staff estimates and calculations. 442 409 433 456
 Current Account Balance (Percent of GDP) Sources: National authorities; and Fund staff estimates and calculations")
16
…as do fiscal balances Sources: National authorities; and IMF staff estimates. MENAP Oil Exporters

17
Sources: National authorities; and Fund staff estimates and calculations. Government Fiscal Balance (Percent of GDP) Sources: National authorities; and Fund staff estimates and calculations. Government Non-oil Fiscal Balance (Percent of non-oil GDP)
 Sources: National authorities; and Fund staff estimates and calculations. Government Non-oil Fiscal Balance (Percent of non-oil GDP).")
18
Some countries continue to provide stimulus Sources: National authorities; and IMF staff estimates. MENAP Oil Exporters Percent change in total government expenditures in U.S. dollars (From 2008 to 2011)
.")
19
Many countries approaching break-even prices Sources: National authorities; and IMF staff estimates. Average oil price in 2010 MENAP Oil Exporters

20
Keep an eye on inflation Source: National authorities. 1 Algeria, Bahrain, Iraq, Kuwait, Libya, and Oman MENAP Oil Exporters

21
Financial sectors after the crisis (December 2009) Source: National authorities. 1 December 2008 MENAP Oil Exporters

22
Financial market development Managing international financial linkages Diversification

24
Recovery Growth picking up Policy adjustment Can start consolidating fiscal positions In most cases, inflation not an immediate concern Medium term challenges More than 18 million new jobs required by 2020 Need to improve competitiveness and reorient trade

25
Annual percent change of U.S. dollar value, 3-month moving average Sources: National authorities; IMF Direction of Trade Statistics; and Haver Analytics. ¹ Egypt, Jordan, Lebanon, Morocco, Pakistan, and Tunisia. Regions exports are again growing steadily MENAP Oil Importers

26
Source: National Authorities; and IMF staff estimates. Annual percentage change MENAP Oil Importers 2011

27
Source: National Authorities; and IMF staff estimates and projections. MENAP Oil Importers

28
Sources: Haver Analytics; and national authorities. Consumer Prices; annual percentage change MENAP Oil Importers Aug-10

29
Dominique Strauss- Kahn: We must not underestimate the daunting prospects we face: a lost generation, disconnected from the labor market, with a progressive loss of skills and motivation. More than 18 million jobs needed MENAP Oil Importers AFP/ABDELHAK SENNA/Getty Images. Reprinted with permission. (Unemployed workers wait for a job in the Bani Makada quarter of Tangiers, Morocco on March 20, 2004.)
.")
30
High unemployment a long-standing issue Sources: National authorities; IMF, World Economic Outlook; staff estimates; and International Labor Organization. Note: MENA6 refers to Egypt, Jordan, Lebanon, Morocco, Syria, and Tunisia. Youth unemployment estimate for MENA6 excludes Jordan. Data refers to 2008 or latest available year. MENAP Oil Importers

31
Source: IMF, World Economic Outlook. Goods exports (in percent of GDP) MENAP Oil Importers
 MENAP Oil Importers")
32
Source: World Economic Forum, Global Competitiveness Report, 2010–11. MENAP Oil Importers Competitiveness Rankings, 2010–11¹ ¹Economies are ranked from 1 to 139, with first place being the best. MENAP oil importers is a simple average of Egypt, Jordan, Lebanon, Mauritania, Morocco, Pakistan, Syria, and Tunisia. Emerging Asia is simple average of China, Hong Kong SAR, India, Indonesia, Korea, Malaysia, the Philippines, Singapore, Taiwan Province of China, Thailand, and Vietnam.

33
Real GDP trends, annual percent change 90 1980 85 2000 10 Advanced economies 15 95 05 Source: IMF, World Economic Outlook database. Note: 1980-2015 real GDP growth data are de-trended as 10-year backward rolling averages. Asia Latin America Broader Partnerships MENAP Oil Importers

34
Education Labor market flexibility Competitiveness Reorient exports toward new growth engines Jobs and Growth MENAP Oil Importers

36
Credit growth is stagnant Sources: National authorities; and IMF staff estimates. MENAP Oil Exporters

Similar presentations


