Download presentation
Presentation is loading. Please wait.

2
Amendment to the Transportation Equity Act for the 21 st Century (TEA-21) in 1998 led to this project Cost of Corrosion - Acknowledgement
 in 1998 led to this project Cost of Corrosion - Acknowledgement")
3
Project Funded By: Federal Highway Administration (DOT) Office of Infrastructure Research and Development Project Manager: Y. Paul Virmani, Ph.D. In Cooperation With: NACE International – The Corrosion Society Disseminating study finding – raise awareness Cost of Corrosion - Acknowledgement

4
CC Technologies Gerhardus H. Koch, Ph.D. Neil G. Thompson, Ph.D. Michael P.H. Brongers Joe H. Payer, Ph.D., Case Western – Reserve University Cost of Corrosion – Study Contractor

5
Study Goals Previous Studies Current Study Method 1 – Corrosion Control Methods & Services Method 2 – Industry Sector Analysis Highlights of Selected Sectors Extrapolation to Total Corrosion Cost Preventative Strategies Cost of Corrosion – Presentation Outline

6
Determines the cost of corrosion control methods and services Determines the cost of corrosion for specific industry sectors Extrapolate individual sector costs to a national total corrosion cost Assess barriers to progress and effective implementation Develop strategies for realizing cost savings Cost of Corrosion – Study Goals

7
1950 H.H. Uhlig – US Study: 2.1% of GNP 1970 T.P. Hoar – UK Study: 3.5% of GNP 1974 Japan Study: 1.2% of GNP 1975 Battelle/NBS – U.S. Study: 4.5% of GNP Cost of Corrosion – Previous Studies

8
All costs are direct corrosion costs Disadvantage: many costs are missed Costs of labor attributed to corrosion management activities Cost of the equipment required because of corrosion-related activities Loss of revenue due to disruption in supply of product Cost of loss of reliability Cost of Corrosion – Method 1 – Methods & Services

9
Protective CoatingsB$108.6 Corrosion Resistant AlloysB$7.7 Corrosion InhibitorsB$1.1 Engineering Plastics/PolymersB$1.8 Cathodic & Anodic ProtectionB$1.0 Corrosion Control ServicesB$1.2 Research & DevelopmentB$- Education & TrainingB$- TOTAL:B$121.41 Cost of Corrosion – Method 1 – Methods & Services

10
For each sector, details of analysis are different Government Reports Publicly Available Documents Industry Experts U.S. Department of Commerce Bureau Census Existing Industrial Surveys Trade Organizations Industry Groups Individual Companies Cost of Corrosion – Method 2 – Industry Sector Analysis

11
26 Sectors in 5 Categories Infrastructure Utilities Transportation Production & Manufacturing Government Cost of Corrosion – Method 2 – Industry Sector Analysis

13
Highway BridgesB$8.3 Gas & Liquid Transmission PipelinesB$7.0 Waterways & PortsB$0.3 Hazardous Materials StorageB$7.0 AirportsB$- RailroadsB$- TOTAL:B$22.6 Cost of Corrosion – Category: Infrastructure

14
Gas DistributionB$5.0 Drinking Water and Sewer SystemsB$36.0 Electrical UtilitiesB$6.9 TelecommunicationsB$- TOTAL:B$47.9 Cost of Corrosion – Category: Utilities

15
Motor VehiclesB$23.4 ShipsB$2.7 AircraftB$2.2 Railroad CarsB$0.5 Hazardous Materials TransportB$0.9 TOTAL:B$29.7 Cost of Corrosion – Category: Transportation

16
Oil & Gas Exploration & ProductionB$1.4 MiningB$0.1 Petroleum RefiningB$3.7 Chemical, Petrochemical, & PharmaceuticalB$1.7 Pulp & PaperB$6.0 Agricultural ProductionB$1.1 Food ProcessingB$1.1 ElectronicsB$- Home AppliancesB$1.5 TOTALB$17.6 Cost of Corrosion – Category: Production & Manufacturing

17
DefenseB$20.0 Nuclear Waste StorageB$0.1 TOTALB$20.1 Government

18
InfrastructureB$22.6 UtilitiesB$47.9 TransportationB$29.7 Production & ManufacturingB$17.6 GovernmentB$20.1 TOTALB$137.9 Cost of Corrosion – Summary of Sector Analyses

20
Highlights of Selected Sectors Highways & Bridges Transmission Pipelines Drinking Water & Sewer Systems Oil & Gas Exploration & Production

21
Highways & Bridges $8.3 Billion Per Year

22
National Bridge Inventory Database Approximately 600,000 bridges in the U.S Half were built between 1950 and 1994 The materials of constructionThe materials of construction Concrete, steel, timber, masonry, timber/steel/concrete combinations, & aluminum This sector focused on reinforced concrete and steel bridges; they make up the vast majority of highway bridgesThis sector focused on reinforced concrete and steel bridges; they make up the vast majority of highway bridges

23
Highway Bridges – Trends Reported downward trend in the % structurally deficient bridges - decrease from 18 % to 15 % between 1995 to 1999 However, costs to replace aging bridges increased by 12 % during the same period. In addition, there has been a significant increase in the required maintenance of the aging bridges

24
B$ 3.79 Replace structurally deficient bridges B$ 3.79 Maintenance and capital cost 2.00 For concrete bridge decks 2.00 2.00 For concrete sub- and superstructures 2.00.5 Maintenance painting cost for steel bridges.5 Total : B$ 8.29 Total : B$ 8.29 Sector Summary: Highway Bridges

25
Indirect corrosion costs: Estimated from life-cycle analysis Costs to user due to traffic delays & lost productivity More than ten times the direct cost of corrosion Highway Bridges - Findings

26
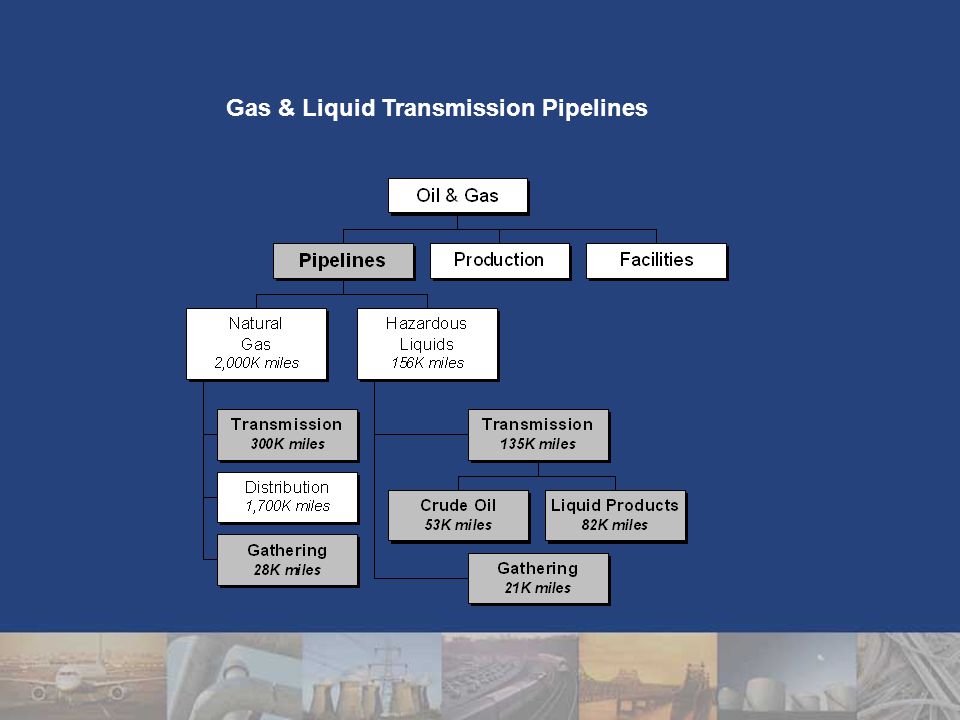
Gas & Liquid Transmission Pipelines $7 Billion Per Year

27
Over 480,000 Miles of Gas and Liquid Transmission Pipelines Gas Transmission Natural Gas Lines – 328,000 Miles Liquid Transmission Lines Crude Oil Lines – 74,000 Miles Liquid Product Lines – 82,000 Miles 60% of These Lines Are Over 40 Years Gas & Liquid Transmission Pipelines

29
Typical Corrosion Related Costs Annual ICCP System Investment - $40 Million Annual Sacrificial CP Investment - $9 Million Annual O&M Costs - $2.4 Billion - $4.8 Billion Certification 30% of Companies has personnel dedicated to Corrosion Control Regulations require Certification of Corrosion Control Staff Annual Cost $32.4 Million Gas & Liquid Transmission Pipelines

30
Low Estimate High Estimate Average ($ x M) % Cost of Capital2,5002.8402,67038 Operations & Maintenance (O&M)2,4204,8403,63052 Cost of Failures (Non-Related O&M)47187567310 TOTAL COST DUE TO CORROSION5,3918,5556,973100 Sector Summary: Transmission Pipelines
 % Cost of Capital2, ,67038 Operations & Maintenance (O&M)2,4204,8403,63052 Cost of Failures (Non-Related O&M) TOTAL COST DUE TO CORROSION5,3918,5556, Sector Summary: Transmission Pipelines")
31
Drinking Water & Sewer Systems $36 Billion Per Year

32
Two Separate Systems Drinking Water Sewage Water Costs in Operation, Maintenance, Finance, Capital Investments Maintenance crews find and repair leaks, but the number of leaks increases with system age. Drinking Water & Sewer Systems

33
System Size 550 liters of water consumption per person per day 56.7 Billion m 3 / year in the U.S. 1.4 Million km of municipal water pumping A major barrier to progress in corrosion management is the absence of complete and up-to-date information on all water systems. Drinking Water & Sewer Systems

34
There are only 2 reasons why utilities replace or change water systems: Pipes are considered broken, Leaking water Corrosion products in the water Capacity too small for the area Assume 50% of all operation and maintenance costs are corrosion-related Operation & Management Costs

36
1997 EPA: B$6.9 per year Drinking water system maintenance only 1998 AWWA: B$16.3 per year Drinking water transmission – maintenance only 2000 WIN: B$51 per year for Drinking Water B$45 per year for Sewer Systems Includes Operation, Maintenance, Finance, Capital Three Reports on Water System Costs

37
Nationwide, 15% of treated water is lost Loss of revenue: B$3.0 per year More than 90% of lost-water cost is corrosion-related, because of leaking systems Underground leaks go unnoticed: Therefore low cost awareness Cost of Lost Water

38
Operation, Maintenance, Finance, Capital Drinking water systemsB$19.25 Sewer systemsB$13.75 Cost of Lost waterB$3.0 TOTALB$36.0 Sector Summary: Drinking Water & Sewer Systems

39
Oil & Gas Exploration Production $1.4 Billion Per Year

40
Significant available onshore oil & gas reserved have been explored U.S. 1998 Oil Production – 3.04 Billion Barrels Recoverable Reserves Deep Waters Offshore Remote Arctic Locations Reservoirs with Unconsolidated Sands Background

41
Relative High Costs of Oil & Gas Production in the U.S. Maintenance Costs Must be Kept to a Minimum Emphasis on Controlling Internal Corrosion with Corrosion Inhibitors Background

42
Operation, Maintenance, Finance, Capital Surface Piping & Facility CostsM$589 Downhole Tubing ExpensesM$463 Capital ExpensesM$320 TOTALB$1.36 Sector Summary: Oil & Gas

43
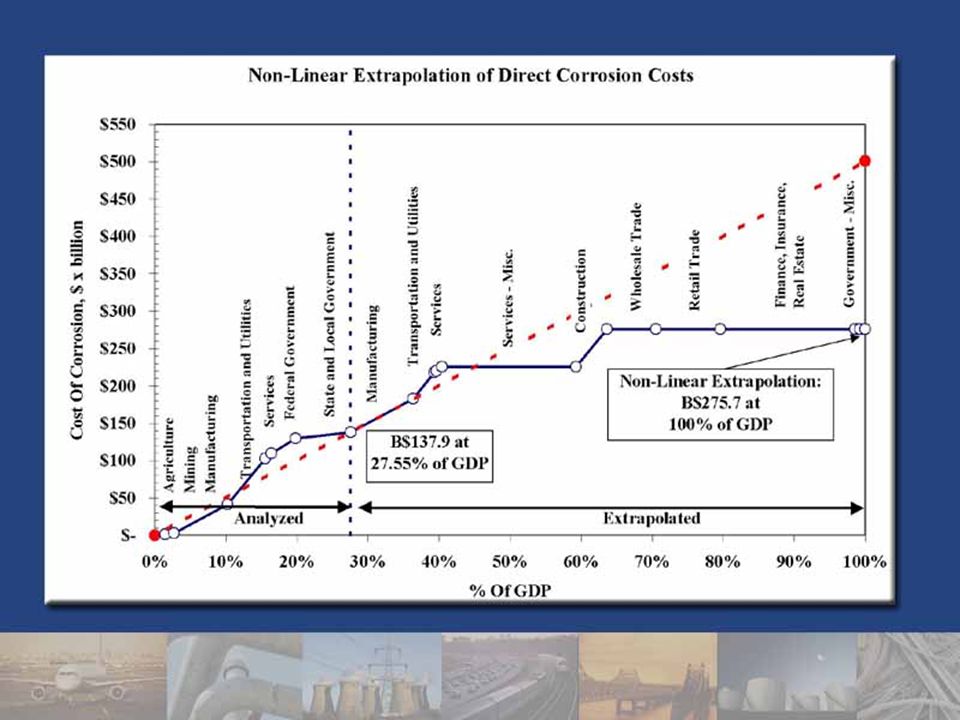
How to Extrapolate the Total Cost of Corrosion

46
Estimated CostB$138 Extrapolated CostB$276 Actual Cost>B$550 Bridges>5 times Electric Utilities>3 times Total Cost of Corrosion

47
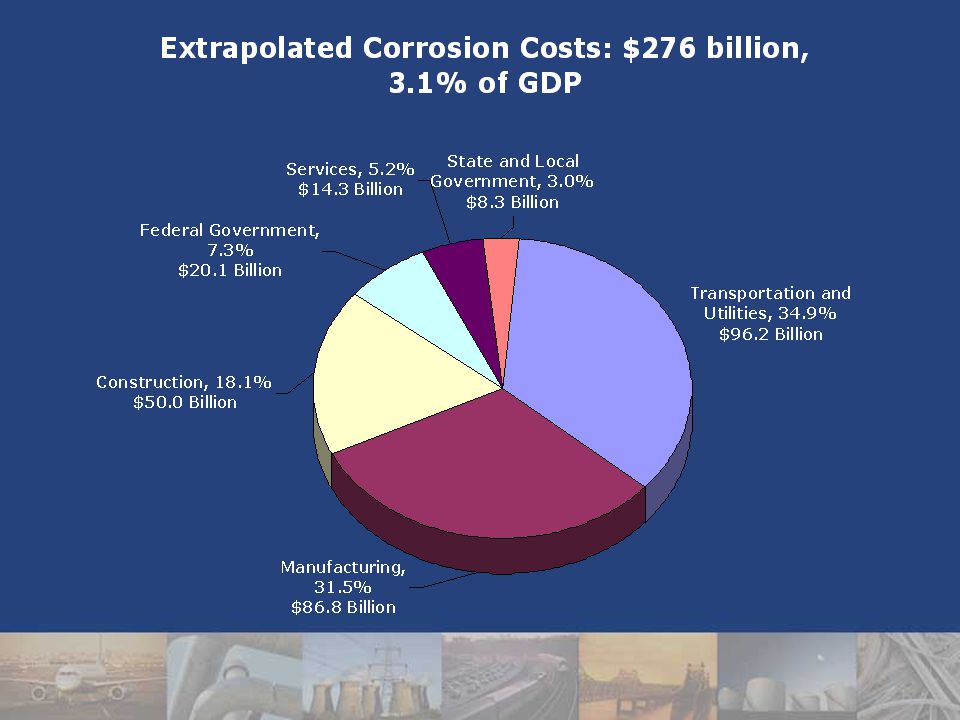
Total Direct Cost of Corrosion in the U.S. B$276 / year = 3.1% of GDP 1998 U.S. GDP B$8,790

50
Increase awareness of the large corrosion costs and potential savings Change the misconception that nothing can be done about corrosion Change policies, regulations, standards, and management practices to increase corrosion savings Improve education and training of staff Non-Technical Preventive Strategies (4)
")
51
Advance design practices for better corrosion management Advance life prediction and performance assessment methods Advance corrosion technology through research, development, and implementation Technical Preventive Strategies (3)
")
52
FHWA – RD-01-156 – Full Report FHWA – RD-01-157 – Tech Brief Contact: Federal Highway Administration Y. Paul Virmani (202) 493-3052 Web Site: http://www.corrosioncost.com Further Information
 Web Site: Further Information.")
Similar presentations


 Modeling Sub-group An introduction to ENERGY 2020 April 26, 2007.>")


