Download presentation
Presentation is loading. Please wait.

1
Capacity Mapping and Capacity building in Emergencies, Afghanistan – case study Basra Hassan Nutrition Cluster Coordinator Global Nutrition Cluster Annual Meeting Geneva, 9 – 11 July 2013

3
Nutrition Situation Country was looking forward – MICS 2011 as the last National Nutrition Survey (NNS) was conducted in 2004. Unfortunately major errors were reported found in the Anthropometric data.

4
Nutrition Situation small scale surveys 2011/2012, Sentinel Site Surveillance & CMAM. Surveys Overall mixed picture, still high levels of nutritional vulnerability. I. Particular Concern over the: (a)conflict affected Provinces: South/South-East Regions: Only one province surveyed (Paktia with GAM 17% and SAM 5.6%) and there is assumptions others to be the same. II. Drought Affected Provinces: Northern Regions - 3 provinces of the 5 provinces surveyed showed: GAM Ranging from 9% - 14% and SAM Ranging from 2% - 4.8%. North-Eastern Region - 2 provinces: MUAC – GAM 30%; SAM – 10.7% for Badakhshan GAM – 10.4%; SAM 2% for Takhar. At National level – 9% GAM and 2% SAM at any given time. This means approx. >400,000 wasted and almost 90,000 SAM. CMAM/Sentinel Site surveillance CMAM >539 sites in 21 provinces servicing OTP and approx. 400 sites SFP; In 2012 CMAM Admission: 60,000 SAM and 119,973 MAM U5. Sentinel Site Surveillance in seven drought affected provinces indicates persistent acute malnutrition ranging from 14% to 23% with high incidence rates of Diarrhea ranging 4% to 15%; peak from May - Dec. Persistent Stunting – one of the highest in the world: More than 1 in every 2 U5 children is stunted Causes: Widespread poverty, conflict, lack of availability of food and poor diet, feeding and caring practices are major causes of malnutrition in the country. In general Breast Feeding is common but poor exclusive breastfeeding and complementary feeding.
conflict affected Provinces: South/South-East Regions: Only one province surveyed (Paktia with GAM 17% and SAM 5.6%) and there is assumptions others to be the same. II. Drought Affected Provinces: Northern Regions - 3 provinces of the 5 provinces surveyed showed: GAM Ranging from 9% - 14% and SAM Ranging from 2% - 4.8%. North-Eastern Region - 2 provinces: MUAC – GAM 30%; SAM – 10.7% for Badakhshan GAM – 10.4%; SAM 2% for Takhar. At National level – 9% GAM and 2% SAM at any given time. This means approx. >400,000 wasted and almost 90,000 SAM. CMAM/Sentinel Site surveillance CMAM >539 sites in 21 provinces servicing OTP and approx. 400 sites SFP; In 2012 CMAM Admission: 60,000 SAM and 119,973 MAM U5. Sentinel Site Surveillance in seven drought affected provinces indicates persistent acute malnutrition ranging from 14% to 23% with high incidence rates of Diarrhea ranging 4% to 15%; peak from May - Dec. Persistent Stunting – one of the highest in the world: More than 1 in every 2 U5 children is stunted Causes: Widespread poverty, conflict, lack of availability of food and poor diet, feeding and caring practices are major causes of malnutrition in the country. In general Breast Feeding is common but poor exclusive breastfeeding and complementary feeding..")
5
2011 Capacity Mapping Results

6
Results of 2011/2012 Capacity Mapping in Prioritized areas Prioritized Technical Area 20112012Remarks NiE25%40%More training conducted at Regional level Trained on SMART18%38%More training planned at regional level Trained on Surveillance 26%65% To be nationalized and therefore more training planned IFE8.4%18%Better results expected in 2013 ToT - CMAM46%76%Better results expected in 2013 Micronutrient11%67%Better results expected in 2013 Trained on Cluster Approach 25%15%Most trainings in cluster approach conducted in 2011 during the cluster roll out to regions

8
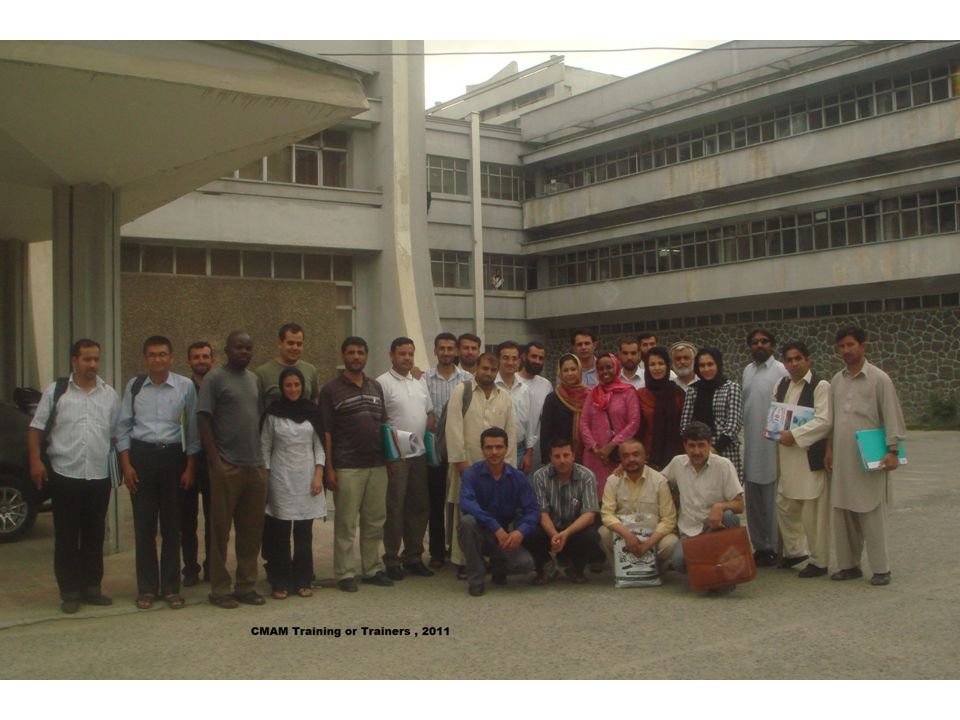
Capacity building to fill in the identified gaps: To improve program functionality and response CMAM Training of Trainers established to support the expansion of CMAM. Two more CMAM training conducted. 75 medical doctors trained. CMAM guidelines revised and use of MUAC expanded and introduced and reporting format and timeline agreed with implementers. TFU guidelines revised and WHO conducted a number of TFU trainings. MN: UNICEF trained health workers on MN and conducted mass distribution of micro – nutrient supplementation. IYCF: Cluster developed an IYCF Pyramid regarding contact points for IYCF dialogue. All PCAs signed with UNICEF ensured to cover IYCF and WASH. Cluster rollout into 5 regions. NiE: At national level Master Trainers representing all regions in the country established. Regional Trainings now completed. Plan to roll out to disaster prone provinces. NiE – Materials contextualized in Afghanistan context developed and translated in local language. Sentinel Site Surveillance introduced to health workers to expand the amount of data available to monitor the situation. - SMART Nutrition Survey: MOPH approved SMART Methodology to be the method of choice when conducting nutrition surveys in an emergency situation which lead two patched 60 cluster members trained on smart methodology. Coordination: Cluster rolled out in 5 Regions IM: Cluster hired an information management officer through standby arrangement to improve capacity of nationals on reporting. Bulletin: Cluster started producing a peridic bulletin for information sharing with cluster members – most of the message – translated in the local language for members in the field particularly the Provincial Nutrition Officers for regular updates

9
Outcome/implications 60 cluster members trained on SMART. Trained members playing a big in the on-going NNS RNA - finalized and validated along with SMART survey – showing good results available to cluster members to use. Number of surveys conducted by cluster members increased (16 provinces surveyed and 3 RNAs conducted). CMAM expanded from 150 sites to 539 OTP sites and 348 SFP. Sentinel site Surveillance: Other clusters (FSAC & WASH) showed interest to participate. Sentinel Site Surveillance – received funding from CIDA – almost $ 7 million for 2 and half years. MOPH/PND – Great efforts to improve IYCF and agreement of IYCF-E as integral part of the IYCF policy. Implications: This played a role in improving status of Nutrition in BPHS system and brought more funds. Only cluster 95% funded in the 2013 CHAP
. CMAM expanded from 150 sites to 539 OTP sites and 348 SFP. Sentinel site Surveillance: Other clusters (FSAC & WASH) showed interest to participate. Sentinel Site Surveillance – received funding from CIDA – almost $ 7 million for 2 and half years. MOPH/PND – Great efforts to improve IYCF and agreement of IYCF-E as integral part of the IYCF policy. Implications: This played a role in improving status of Nutrition in BPHS system and brought more funds. Only cluster 95% funded in the 2013 CHAP.")
10
Enabling Factors Supportive line ministry/Department, BPHS / government stakeholders. Nutrition prioritized amongst the 7 priority areas of BPHS Availability of Funds – ERF, CERF, bilateral. Coordination/ training capacity Good collaboration with health, WASH and FSAC. National Nutrition Survey – in process Innovative models of service delivery coming soon

11
Challenges/Constraints Capacity – Mapping : voluntary involvement – limited participation. Capacity building - trainings for technical people and those in the field. Many times senior management and not technical persons respond to questionnaires. Limited capacity to supervise and monitor due to inadequate government manpower and insecurity. Sustainability: a.Limited resources - only short- term donor funding is available. Program continuity affected and retaining staff. b.High staff turnover in the BPHS- system based on bidding system. c.Over-burden to already over –stretched and a poorly functioning health system. Mixed messages Moving from Emergency Nutrition Programing to Development Programming Change of Indicators from GAM/SAM to Stunting From Cluster Coordination to Sectoral Coordination – Transitioning started From One Ministry to Multi-Sector Coordination for Nutrition Main Challenge of Short term Funding vs Long Term funding

12
Lessons Learnt Capacity Mapping/Building is a key for success of cluster coordination and must be envisaged in the early stages of the cluster activation. Without a proper mapping – difficult to estimate level of capacity. NiE – training and capacity building – improves understanding of what is required in Nutrition during emergencies. It also improved interest and created motivation for non-nutrition implementing agencies. NiE – can play an advocacy role for responding emergency related to Nutrition. NiE – trainings at the field level should not be limited to Nutrition people but expanded to others at supportive levels. RNA - using a validated RNA tool along SMART survey if and when possible maybe best way to go in situation like Afghanistan with security constraints and limited capacity along with SMART survey when if required. GNC – to come up with a simple but accredited tool for capacity mapping and with simple analyzing method to facilitate field staff to be able to conduct the mapping

15
4. Sentinel site Data produced so far

16
Food security, Nutrition And WASH

Similar presentations


 Readiness Assessment.>")


 GLOBAL NUTRITION CLUSTER VISION: 2011-2013.>")

>")
