Download presentation
Presentation is loading. Please wait.

1
Design, performance and capacity - Factors of successful intranet and internet SharePoint sites Sanjay Narang, Anandan Kumaran, Singaram Murigappan

2
Agenda Real Life Implementation – www.cognizant.com Real Life Case Study – Capacity Planning Aspects Of Performance Capacity Management Model –Model –Design

3
www.cognizant.com SharePoint 2010 Implementation

4
Publish Content Marketing team needs a robust mechanism to publish content effectively without needing specialized technical skill

5
Content Deployment Content authored is saved in the authoring server database Content push by marketing admin Content authored is moved to the preproduction environment. It allows the user to verify the content before pushing live Content push by marketing admin Content is moved from preproduction environment to live environment after verification Authoring Pre-Production www.cognizant.com

6
Intuitive User Interface

8
Content Authoring nt Content Author needs a mechanism to add/edit content, upload documents without worrying about the layout or having pre-requisite design skills

9
Author Content

10
Edit Page

11
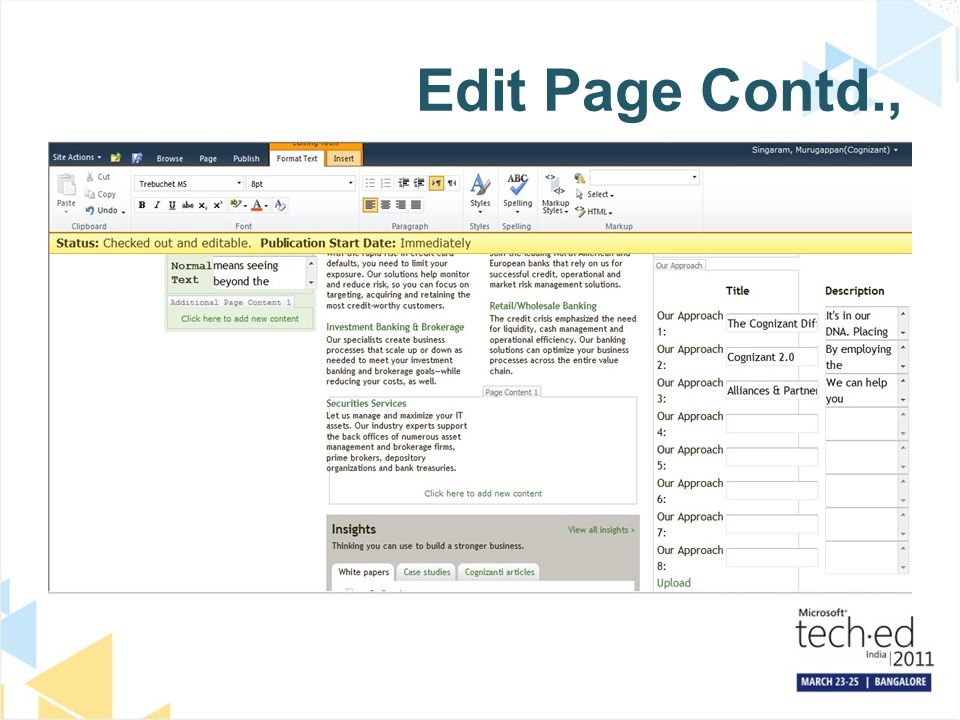
Edit Page Contd.,

13
Our Approach – Edit View

14
Public View

15
Friendly URLs Need for friendly URLs that are easier for users to remember and for search engines to find http://www.cognizant.com/banking-financial-services/Pages/landingPage.aspx

16
URL Rewrite Powerful rules to transform complex URLs into simple and consistent web addresses Rule-based URL rewriting engine Regular expression pattern matching Downloadable Download: http://go.microsoft.com/?linkid=972 2532

17
Configuration - Inbound Inbound rules convert the user friendly URLs provided by the users to actual URLs

18
Configuration - Outbound Outbound rules convert the actual URLs to the user friendly URLs

19
Friendly URL - Output http://www.cognizant.com/banking-financial-services

20
URL Rewrite Support Not officially supported by the Microsoft Product Team

21
Faster Site Need for the site to equally responsive and quick to all users across the globe. The load of users on the application will vary especially during financial results but I need a cost effective solution

22
SharePoint Out-Of-Box Output Caching Object Cache This can load but not latency

23
Content Delivery Network Deliver content faster Scalability Across the globe users has similar experience on accessing the site

24
Capacity Planning and Management

25
Case Study – Contoso Intranet Portal 150,000 users spread across globe Existing site –The gateway to all other applications –primarily HTML/ASP/JavaScript New site –Intranet Publishing on SharePoint Server 2010 –Widget based homepage, –Much more content on home page including Flash videos

26
Capacity Management Capacity Planning –One time sizing –Selection & Configuration Data architecture Topologies (physical and logical) Hardware Capacity Management – Extends Planning – Cyclic Process – Monitored & Optimized – Changing Conditions and Requirements
 Hardware Capacity Management – Extends Planning – Cyclic Process – Monitored & Optimized – Changing Conditions and Requirements")
27
Analogy

29
Capacity Management Model

30
Aspects of Performance Latency Throughput Data Scale Reliability

31
capacity management Model Design Pilot, Test, Optimize Deploy Monitor & Maintain

32
Definitions and Conventions Users –Concurrent Users –Active Users RPS

33
Definitions and Conventions User Types

34
Model Determine Workload Determine DataSet Set Performance and Reliability Targets Model

35
RPS Estimation (New Env) NumberRPH/UserRPH Total Users150,000 Active Users 50,000 Light (10%) 5,00020 100,000 Typical (70%) 35,00036 1260,000 Heavy (15%)7,50060 450,000 Extreme (5%)2,500 120 300,000 Total RPH 2,111,000 RPS (RPH/3600)586 Concurrency50% Effective RPS293 Model
 NumberRPH/UserRPH Total Users150,000 Active Users 50,000 Light (10%) 5, ,000 Typical (70%) 35, ,000 Heavy (15%)7, ,000 Extreme (5%)2, ,000 Total RPH 2,111,000 RPS (RPH/3600)586 Concurrency50% Effective RPS293 Model")
36
IIS Logs –Take from all servers into a central location –Take it for one of the peak day User Tools –LogParser 2.2 RPS Calculations (Existing Env) Model
 Model")
37
Get RPS per second logparser -i:IISW3C -o:CSV " SELECT QUANTIZE(TO_TIMESTAMP(date, time), 3600) AS Hour, QUANTIZE(TO_TIMESTAMP(date, time), 1) AS Second, COUNT(*) AS RPS INTO RPS_No401s.csv FROM *.log WHERE sc-status <> 401 GROUP BY Hour, Second " Model
, 3600) AS Hour, QUANTIZE(TO_TIMESTAMP(date, time), 1) AS Second, COUNT(*) AS RPS INTO RPS_No401s.csv FROM *.log WHERE sc-status <> 401 GROUP BY Hour, Second Model")
38
HourSecondRPS 6/29/2010 18:006/29/2010 18:3010 6/29/2010 18:006/29/2010 18:305 6/29/2010 18:006/29/2010 18:3011 6/29/2010 18:006/29/2010 18:3055 --- 6/30/2010 4:006/30/2010 4:32542 6/30/2010 4:006/30/2010 4:32411 6/30/2010 4:006/30/2010 4:32648 6/30/2010 4:006/30/2010 4:321450 6/30/2010 4:006/30/2010 4:321136 6/30/2010 4:006/30/2010 4:321274 6/30/2010 4:006/30/2010 4:321150 6/30/2010 4:006/30/2010 4:321178 6/30/2010 4:006/30/2010 4:32890 6/30/2010 4:006/30/2010 4:32556 6/30/2010 4:006/30/2010 4:32710 --- 6/30/2010 18:006/30/2010 18:297 6/30/2010 18:006/30/2010 18:295 RPS Every Second for 24 Hours Model

39
Get Average maximum RPS [Hidden] logparser -i:CSV -o:CSV "SELECT Hour, AVG(RPS) AS AvgRPS, MAX(RPS) AS MaxRPS INTO RPS_AvgMax_No401s.csv FROM RPS_No401s.csv GROUP BY Hour" Model
![Get Average maximum RPS [Hidden] logparser -i:CSV -o:CSV SELECT Hour, AVG(RPS) AS AvgRPS, MAX(RPS) AS MaxRPS INTO RPS_AvgMax_No401s.csv FROM RPS_No401s.csv GROUP BY Hour Model](http://images.slideplayer.com/7/1685404/slides/slide_39.jpg "Get Average maximum RPS [Hidden] logparser -i:CSV -o:CSV SELECT Hour, AVG(RPS) AS AvgRPS, MAX(RPS) AS MaxRPS INTO RPS_AvgMax_No401s.csv FROM RPS_No401s.csv GROUP BY Hour Model")
40
HourAvgRPSMaxRPS 6/29/2010 18:0027229 6/29/2010 19:0021188 6/29/2010 20:0020178 6/29/2010 21:0020202 6/29/2010 22:0016153 6/29/2010 23:0016184 6/30/2010 0:0022168 6/30/2010 1:0037194 6/30/2010 2:00141646 6/30/2010 3:005261361 6/30/2010 4:006301450 6/30/2010 5:005081261 6/30/2010 6:00407981 6/30/2010 7:00332988 6/30/2010 8:003511016 6/30/2010 9:003711163 6/30/2010 10:00385997 6/30/2010 11:004751320 6/30/2010 12:00350977 6/30/2010 13:00213641 6/30/2010 14:00122439 6/30/2010 15:0086436 6/30/2010 16:0058345 6/30/2010 17:0043338 6/30/2010 18:0030213 Avg and Max RPS Every Hour for 24 Hours Model

41
Avg RPS vs Max RPS[Hidden] Model
![Avg RPS vs Max RPS[Hidden] Model](http://images.slideplayer.com/7/1685404/slides/slide_41.jpg "Avg RPS vs Max RPS[Hidden] Model")
42
Avoid Image, CSS, JS Get File Extension to_lowercase EXTRACT_EXTENSION(cs-uri-stem)) exclude Where clause fext <> jpg AND fext <> jpeg AND fext <> gif AND fext <> png AND fext <> js AND fext <> css Model
) exclude Where clause fext <> jpg AND fext <> jpeg AND fext <> gif AND fext <> png AND fext <> js AND fext <> css Model")
43
Decision Point – Peak or Average Average RPS on a day Average RPS in a peak hour Maximum RPS in a peak hour 220 700 1500

44
Workload Distribution Model

45
Dataset [Hidden] Different Calculations for new environment vs Existing Content Size –Number of Documents and Average Size –Versions –Site collection size Service Application –Search, Logging, Web Analytics, UPS, MMS Others – Recycle Bin, Audit Logs Model
![Dataset [Hidden] Different Calculations for new environment vs Existing Content Size –Number of Documents and Average Size –Versions –Site collection size Service Application –Search, Logging, Web Analytics, UPS, MMS Others – Recycle Bin, Audit Logs Model](http://images.slideplayer.com/7/1685404/slides/slide_45.jpg "Dataset [Hidden] Different Calculations for new environment vs Existing Content Size –Number of Documents and Average Size –Versions –Site collection size Service Application –Search, Logging, Web Analytics, UPS, MMS Others – Recycle Bin, Audit Logs Model")
46
File System Analysis[Hidden] The directory C:\intepub\wwwroot NumberSize (in MB)%age Total Files (Content)18508340243.2 Pages39,57437821.38% HTM Pages19,487238.2 HTML Pages19,971138.5 aspx pages1161.7 Images1027013458.355.49% jpg764183174.4 GIF25773187.5 jpeg1995.3 bmp31191.1 Model
![File System Analysis[Hidden] The directory C:\intepub\wwwroot NumberSize (in MB)%age Total Files (Content) Pages39, % HTM Pages19, HTML Pages19, aspx pages Images % jpg GIF jpeg bmp Model](http://images.slideplayer.com/7/1685404/slides/slide_46.jpg "File System Analysis[Hidden] The directory C:\intepub\wwwroot NumberSize (in MB)%age Total Files (Content) Pages39, % HTM Pages19, HTML Pages19, aspx pages Images % jpg GIF jpeg bmp Model")
47
Versions[Hidden] Model
![Versions[Hidden] Model](http://images.slideplayer.com/7/1685404/slides/slide_47.jpg "Versions[Hidden] Model")
48
Version and Size Calculations[Hidden] Number of Items %age of size Number of versions Size (in MBs) Size with versions Number with versions Pages3957412540210,061989350 Documents231541686,43951,511185232 Images102701933,62210,866308103 Others1965475330,18290,54758962 TOTAL162,9841541647 Size in GB159GB Model
![Version and Size Calculations[Hidden] Number of Items %age of size Number of versions Size (in MBs) Size with versions Number with versions Pages , Documents ,43951, Images ,62210, Others ,18290, TOTAL162, Size in GB159GB Model](http://images.slideplayer.com/7/1685404/slides/slide_48.jpg "Version and Size Calculations[Hidden] Number of Items %age of size Number of versions Size (in MBs) Size with versions Number with versions Pages , Documents ,43951, Images ,62210, Others ,18290, TOTAL162, Size in GB159GB Model")
49
Dataset - Content DB S.NoParameterValueUnitsSource of Value A Existing size of all documents (pages, images etc) without versions40GBActual size from web servers B Existing size of all documents (pages, images etc) with all versions160GBCalculated as in Table 1 C Total Number of documents with versions1,600,000Calculated as in Table 1 D Estimated number of list items per document2 Approximate assumption based on similar projects ETotal number of list items3,200,000C x D F Avg size of a list item or metadata for a document10KB Approximate assumption based on similar projects GTotal size of list items31GB(E x F)/(1024 x 1024) HTotal size of document metadata15GB(C x F)/(1024 x 1024) IContent DB size for existing content206GBB+G+H Model
 without versions40GBActual size from web servers B Existing size of all documents (pages, images etc) with all versions160GBCalculated as in Table 1 C Total Number of documents with versions1,600,000Calculated as in Table 1 D Estimated number of list items per document2 Approximate assumption based on similar projects ETotal number of list items3,200,000C x D F Avg size of a list item or metadata for a document10KB Approximate assumption based on similar projects GTotal size of list items31GB(E x F)/(1024 x 1024) HTotal size of document metadata15GB(C x F)/(1024 x 1024) IContent DB size for existing content206GBB+G+H Model")
50
Content DB Calculations S.NoParameterValueUnitsSource of Value I Content DB size for existing content206GBB+G+H J Growth estimated over next 2-3 years100%Approximate assumption KTotal size with growth412GBI + (I x J)/100 LRecycle Bin30% MTotal size with Recycle bin535GBK + (L x K)/100 Model
/100 LRecycle Bin30% MTotal size with Recycle bin535GBK + (L x K)/100 Model")
51
All Databases Calculations ParameterValue (in GBs) Content databases for Main Portal site collections535 Custom databases10 Configuration and CA databases5 Database for Usage and Health data collection SA200 Web Analytics Databases200 Managed Metadata SA10 User Profile SA300 TOTAL1,260 Model
 Content databases for Main Portal site collections535 Custom databases10 Configuration and CA databases5 Database for Usage and Health data collection SA200 Web Analytics Databases200 Managed Metadata SA10 User Profile SA300 TOTAL1,260 Model")
52
Overall SQL Server Storage Storage ForValue (GB)%age of DB Databases1,260 Backup1,890150% System10 Transaction Log25220% temp db25220% Total for Databases3,664 Empty Space (25% of total)916 TOTAL for SQL Server4,580 Model
%age of DB Databases1,260 Backup1,890150% System10 Transaction Log25220% temp db25220% Total for Databases3,664 Empty Space (25% of total)916 TOTAL for SQL Server4,580 Model")
53
Performance and Reliability Targets Availability –Numbers of Nines (99%, 99.9%, 99.99%) –Consider Patch Management Code Releases Server Responsiveness –E.g. < 1 sec System Resource Utilization –E.g. Avg CPU < 50%, Available Memory Model

54
Model - Summary Total Number of Users – 150,000 Total Request in a day – 18,000,000 Throughput (RPS) – 1500, 700, 220 Storage - 5 TB Server Response Time < 1 sec Model
 – 1500, 700, 220 Storage - 5 TB Server Response Time < 1 sec Model")
55
capacity management Design ModelDesign Pilot, Test, Optimize Deploy Monitor & Maintain

56
Design Identify case study Choose an Architecture Determine Hardware Design

57
Know SharePoint 2010 Vs SharePoint 2007 –Service Applications & Cross Farm Publishing Oversizing vs. Undersizing Reference Architectures –Single server, small, medium and large farms Design

58
Service Application Web server CPU Web server RAM Application server CPU Application server RAM SQL Server CPU SQL Server IOPS SQL Server storage SharePoint Foundation ServiceXXX XXXXX Central Admin serviceXX XXX Logging Service *XX XXX SharePoint Search ServiceXXX Word Viewing Service Application *XXXXXXX PowerPoint Service *XX XXXXX Excel Calculation ServiceXXX XXX Visio Service *XXXXX XXX Access Service *XXXXXXXXXX User Profile ServiceXXX XXX XX Managed Metadata Service *XXX XX Web Analytics Service *XXXXX Business Connection Service *XX XXX InfoPath Forms ServiceXX XXX Word Conversion ServiceXXXXXXXXXX PerformancePoint Service Application *XX XXX XXX Project Service *XXXXXXX XX Sandboxed Solutions *XXXXX Workflow capabilities *XXX Timer ServiceXX PowerPivot *XXXXX XX XXX Design

59
Constraints and Boundaries Site Collection < 100 GB Content DB < 200 GB 1 SQL Instance < 5 TB Content DBs per Web App < 300 Design

60
Reference Architectures Design

61
Reference Architectures

62
Determine Workload[Hidden] Publishing –Read Oriented Collaboration –Read – Write Search Personalized/Social Records Management
![Determine Workload[Hidden] Publishing –Read Oriented Collaboration –Read – Write Search Personalized/Social Records Management](http://images.slideplayer.com/7/1685404/slides/slide_62.jpg "Determine Workload[Hidden] Publishing –Read Oriented Collaboration –Read – Write Search Personalized/Social Records Management")
63
Identify Case Study Design

64
Case Study - Published Intranet Workload CharacteristicsValue Average Requests per Second (RPS)100 Average RPS at peak time226 Total number of unique users per day33,580 Average concurrent users172 Maximum concurrent users376 Total # of requests per day3,800,000 Design
100 Average RPS at peak time226 Total number of unique users per day33,580 Average concurrent users172 Maximum concurrent users376 Total # of requests per day3,800,000 Design")
65
Case Study - Published Intranet

66
Lab - RPS & Output Cache[Hidden] Design
![Lab - RPS & Output Cache[Hidden] Design](http://images.slideplayer.com/7/1685404/slides/slide_66.jpg "Lab - RPS & Output Cache[Hidden] Design")
67
Lab - RPS & Output Cache [Hidden] Design Output Cache Hit Ratio Measure1x12x14x1 100% Maximum RPS3,4637,33111,032 SQL Server CPU utilization0% 95% Maximum RPS2,1373,9455,937 SQL Server CPU utilization5.93%12.00%21.80% 90% Maximum RPS1,5182,8644,518 SQL Server CPU utilization7.12%14.40%28.00% 50% Maximum RPS4599131,596 SQL Server CPU utilization9.86%19.50%42.00% 0% Maximum RPS172339638 SQL Server CPU utilization9.53%19.00%36.30%
![Lab - RPS & Output Cache [Hidden] Design Output Cache Hit Ratio Measure1x12x14x1 100% Maximum RPS3,4637,33111,032 SQL Server CPU utilization0% 95% Maximum RPS2,1373,9455,937 SQL Server CPU utilization5.93%12.00%21.80% 90% Maximum RPS1,5182,8644,518 SQL Server CPU utilization7.12%14.40%28.00% 50% Maximum RPS ,596 SQL Server CPU utilization9.86%19.50%42.00% 0% Maximum RPS SQL Server CPU utilization9.53%19.00%36.30%](http://images.slideplayer.com/7/1685404/slides/slide_67.jpg "Lab - RPS & Output Cache [Hidden] Design Output Cache Hit Ratio Measure1x12x14x1 100% Maximum RPS3,4637,33111,032 SQL Server CPU utilization0% 95% Maximum RPS2,1373,9455,937 SQL Server CPU utilization5.93%12.00%21.80% 90% Maximum RPS1,5182,8644,518 SQL Server CPU utilization7.12%14.40%28.00% 50% Maximum RPS ,596 SQL Server CPU utilization9.86%19.50%42.00% 0% Maximum RPS SQL Server CPU utilization9.53%19.00%36.30%")
68
Lab - RPS with Authentication Design

69
Be Aware of Thumb Rules Number of Servers –1 WFE per 10 K users –1 SQL server instance per 4 WFEs 3-5 WFE cores per SQL core –1 DC per 3 WFEs RAM –2-4 GB memory CPU core Design

70
Choosing an Architecture High Availability –Hardware vs Software Load Balancer for web servers –Clustering or Mirroring for SQL Server Service Applications –Separate farm or same farm Search Target –Dedicated or Distributed Design

71
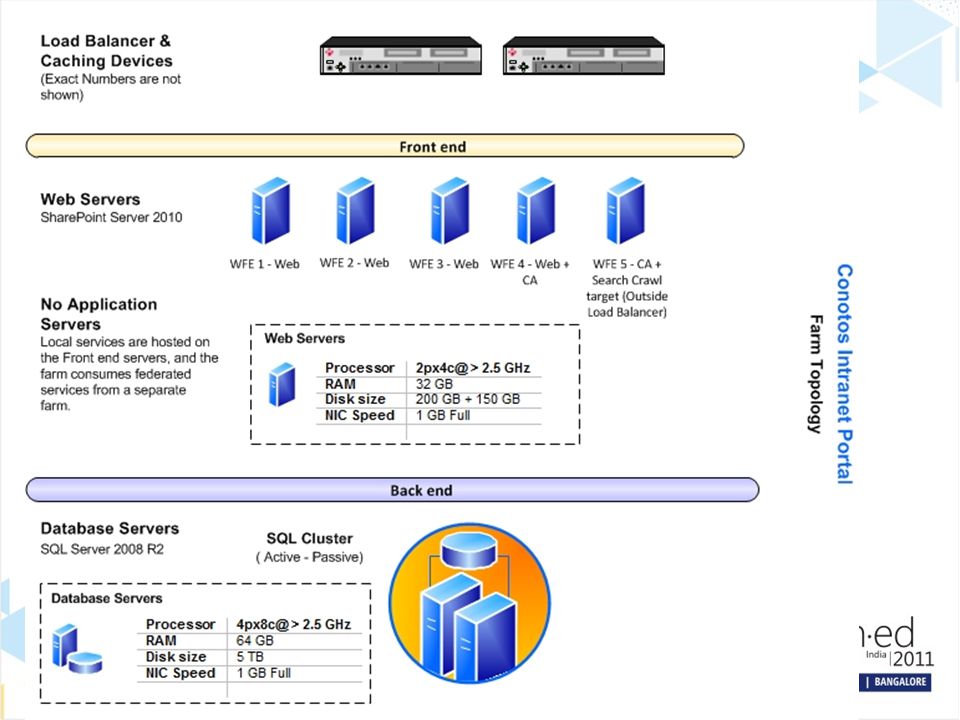
Determining Hardware Server TypeMinimum (as per TechNet) My Recommendation CPUWeb / App64-bit, 4 cores64 bit, 8 cores DB64-bit, 4 – 8 cores64-bit, 16 cores MemoryWeb/App8 GB16 GB DB8-32 GB16-32 GB DiskWeb/App80 GB200 + 150 GB DBAs per requirement IOPSWeb/AppMinimal DBAs per requirement Design
 My Recommendation CPUWeb / App64-bit, 4 cores64 bit, 8 cores DB64-bit, 4 – 8 cores64-bit, 16 cores MemoryWeb/App8 GB16 GB DB8-32 GB16-32 GB DiskWeb/App80 GB GB DBAs per requirement IOPSWeb/AppMinimal DBAs per requirement Design")
72
SQL Server RAM Recommendations Design Combined size of content databasesRecommended RAM Minimum for small production deployments 8 GB Minimum for medium production deployments 16 GB Recommendation for up to 2 terabytes32 GB Recommendation for the range of 2 terabytes to a maximum of 5 terabytes 64 GB

73
Storage Architecture[Hidden] DAS SAN NAS –Only supported for Content DBs with RBS –Ping within 1 ms –First Byte within 20 ms Design
![Storage Architecture[Hidden] DAS SAN NAS –Only supported for Content DBs with RBS –Ping within 1 ms –First Byte within 20 ms Design](http://images.slideplayer.com/7/1685404/slides/slide_73.jpg "Storage Architecture[Hidden] DAS SAN NAS –Only supported for Content DBs with RBS –Ping within 1 ms –First Byte within 20 ms Design")
74
Disk Types[Hidden] Small Computer System Interface (SCSI) Serial Advanced Technology Attachment (SATA) Serial-attached SCSI (SAS) Fibre Channel (FC) Integrated Device Electronics (IDE) Solid State Drive (SSD) or Flash Disk Design
![Disk Types[Hidden] Small Computer System Interface (SCSI) Serial Advanced Technology Attachment (SATA) Serial-attached SCSI (SAS) Fibre Channel (FC) Integrated Device Electronics (IDE) Solid State Drive (SSD) or Flash Disk Design](http://images.slideplayer.com/7/1685404/slides/slide_74.jpg "Disk Types[Hidden] Small Computer System Interface (SCSI) Serial Advanced Technology Attachment (SATA) Serial-attached SCSI (SAS) Fibre Channel (FC) Integrated Device Electronics (IDE) Solid State Drive (SSD) or Flash Disk Design")
75
RAID Levels & IOPS RAID 10 Design TypeRAID levelSpindlesOptimization TempDB[RAID 1+0]2 IOPS/ GBWrite optimized Transaction Logs[RAID 1+0]2 IOPS/GBWrite optimized Content databases [RAID 1+0] (Can have RAID 5, if storage is a constraint) 0.75 IOPS / GBRead optimized
![RAID Levels & IOPS RAID 10 Design TypeRAID levelSpindlesOptimization TempDB[RAID 1+0]2 IOPS/ GBWrite optimized Transaction Logs[RAID 1+0]2 IOPS/GBWrite optimized Content databases [RAID 1+0] (Can have RAID 5, if storage is a constraint) 0.75 IOPS / GBRead optimized](http://images.slideplayer.com/7/1685404/slides/slide_75.jpg "RAID Levels & IOPS RAID 10 Design TypeRAID levelSpindlesOptimization TempDB[RAID 1+0]2 IOPS/ GBWrite optimized Transaction Logs[RAID 1+0]2 IOPS/GBWrite optimized Content databases [RAID 1+0] (Can have RAID 5, if storage is a constraint) 0.75 IOPS / GBRead optimized")
76
Design - Summary Workload – Published Intranet Case Study – WCM Lab Results Architecture –Availability Hardware Load Balancer Clustering for SQL Server –Service Applications in separate farm Number of Servers Hardware Configurations Design

78
Design - Summary Number of Servers –Lab results: 4 servers = 3200 RPS, 2 servers = 1700 RPS –Scaled UP SQL server for 5 servers Hardware Configurations –RAM oversized because of low cost –Used thumb rule for SQL Memory Design

79
Possible Variations Internet Website (anonymous) Requirement for local services: Office Web Apps, Excel Services etc. Data Scale more than 5 TB

80
© 2011 Microsoft Corporation. All rights reserved. Microsoft, Windows, Windows Vista and other product names are or may be registered trademarks and/or trademarks in the U.S. and/or other countries. The information herein is for informational purposes only and represents the current view of Microsoft Corporation as of the date of this presentation. Because Microsoft must respond to changing market conditions, it should not be interpreted to be a commitment on the part of Microsoft, and Microsoft cannot guarantee the accuracy of any information provided after the date of this presentation. MICROSOFT MAKES NO WARRANTIES, EXPRESS, IMPLIED OR STATUTORY, AS TO THE INFORMATION IN THIS PRESENTATION.

Similar presentations