Download presentation
Presentation is loading. Please wait.

1
Analytical Science A course (in 15 Chapters), developed as an Open Educational Resource, designed for use at 2nd year England & Wales undergraduate level and as a CPD training resource Author Brian W Woodget Owner Royal Society of Chemistry Title Chapter 6 – (1) Introduction to Chromatographic Methods and (2) This Layer Chromatography Classification F180, Analytical Chemistry Keywords ukoer, sfsoer, oer, open educational resources, metadata, analytical science, cpd training resource, analytical chemistry, measurement science, chromatographic methods, thin layer chromatography Description This chapter reviews the variety of separation techniques which come under the banner of ‘Chromatography’, compares the ‘Plate’ and ‘Rate’ theories of separation and finally considers in more detail that of ‘Thin Layer Chromatography’. Some of the images show a degree of animation. Creative Commons licence Language English File size 1.4 Mbytes File format Microsoft PowerPoint (1997 – 2003) 1 © Royal Society of Chemistry 2010 1
, developed as an Open Educational Resource, designed for use at 2nd year England & Wales undergraduate level and as a CPD training resource. parentId=hull%3A2199&type=1&start=10&pid=hull%3A2351. Author. Brian W Woodget. Owner. Royal Society of Chemistry. Title. Chapter 6 – (1) Introduction to Chromatographic Methods and (2) This Layer Chromatography. Classification. F180, Analytical Chemistry. Keywords. ukoer, sfsoer, oer, open educational resources, metadata, analytical science, cpd training resource, analytical chemistry, measurement science, chromatographic methods, thin layer chromatography. Description. This chapter reviews the variety of separation techniques which come under the banner of ‘Chromatography’, compares the ‘Plate’ and ‘Rate’ theories of separation and finally considers in more detail that of ‘Thin Layer Chromatography’. Some of the images show a degree of animation. Creative Commons licence. Language. English. File size. 1.4 Mbytes. File format. Microsoft PowerPoint (1997 – 2003) 1. © Royal Society of Chemistry")
2
Chapter 6 – Introduction to Chromatographic Methods
Chapter 6 – Introduction to Chromatographic Methods. Thin Layer Chromatography Contents

3
Introduction to chromatographic analysis
Chromatography is first and foremost a method of separation. However because chromatographs (sophisticated instruments used for chromatographic analysis) allow for qualitative identification and quantitative measurement in addition to performing separations, chromatography is often viewed as a total method of analysis. Sample sizes used for analysis are generally very small (often less than 1microlitre (µl), however they are sufficient to provide complex analysis information. Once separated the analytes (or solutes) are detected. If mass spectrometry, infra-red or nuclear magnetic resonance detection is used, the resulting chromatographic system is referred to as a tandem system. Tandem systems are very powerful analytical tools allowing samples of nanogram size to be both separated and characterised. 3 3 3 3 3
 allow for qualitative identification and quantitative measurement in addition to performing separations, chromatography is often viewed as a total method of analysis. Sample sizes used for analysis are generally very small (often less than 1microlitre (µl), however they are sufficient to provide complex analysis information. Once separated the analytes (or solutes) are detected. If mass spectrometry, infra-red or nuclear magnetic resonance detection is used, the resulting chromatographic system is referred to as a tandem system. Tandem systems are very powerful analytical tools allowing samples of nanogram size to be both separated and characterised")
4
A stationary phase, which as the name suggests is in a fixed place;
Chromatography relies on having two phases. A phase is a liquid, solid or gas which can interact either chemically or physically with the analytes (solutes) to be separated. In chromatography, the two phases are termed: A stationary phase, which as the name suggests is in a fixed place; A mobile phase which is a gas or liquid, and which moves past (over or through) the stationary phase. Analytes are usually introduced into the mobile phase stream. As this stream moves past the stationary phase, some of the analytes will interact with this fixed phase, resulting in them being retained. Other analytes remain in the mobile phase and move on. The retained analytes can then move back into a fresh portion of mobile phase as it flows past them. To achieve separation each analyte needs to spend different lengths of time being retained or held by the stationary phase. 4 4 4
 to be separated. In chromatography, the two phases are termed: A stationary phase, which as the name suggests is in a fixed place; A mobile phase which is a gas or liquid, and which moves past (over. or through) the stationary phase. Analytes are usually introduced into the mobile phase stream. As this stream moves past the stationary phase, some of the analytes will interact with this fixed phase, resulting in them being retained. Other analytes remain in the mobile phase and move on. The retained analytes can then move back into a fresh portion of mobile phase as it flows past them. To achieve separation each analyte needs to spend different lengths of time being retained or held by the stationary phase")
5
5

6
History of chromatography
The first chromatographic separation was reported in 1903 by Tswett, who separated plant pigments using a stationary phase of calcium carbonate and a mobile phase of petroleum ether. The separation as illustrated in figure (6.1) shows the two coloured pigments separating as they progress through the column allowing them to be collected separately as they emerge (elute) from the column. As the pigments formed distinct coloured bands Tswett coined the phrase chromatography (colour writing) from chroma – colour and graphien - writing Figure 6.1 6 6 6
 shows the two coloured pigments separating. as they progress through the column allowing. them to be collected separately as they emerge. (elute) from the column. As the pigments formed distinct. coloured bands Tswett coined. the phrase chromatography. (colour writing) from chroma – colour and graphien - writing. Figure")
7
In 1952, Martin and James invented gas-liquid chromatography (glc), a
In 1941 Martin and Synge published a paper describing the principles of partition chromatography, in which the stationary phase was a high boiling liquid coated onto a solid support. In 1952 they were jointly awarded the Nobel prize for chemistry. In 1952, Martin and James invented gas-liquid chromatography (glc), a technique which uses a gas as the mobile phase. This is now a widely used technique for separating volatile or semi-volatile organic substances, for example herbicide pollutants in water or the components in a petroleum fraction. Although research into high pressure (now termed high performance) liquid chromatography (hplc) began in the late 1960’s, the technique did not get widely used until about a decade later with the advent of instrumental components that could withstand pressures as high as 6000 psi and pumps that could deliver these pressures in a smooth rather than a pulsed flow mode. More recently, further advances have enabled the development of ultra performance liquid chromatography (uplc) where pressures of psi are used. In the 1990s electrochromatography was developed. The mobile phase flow is driven through a packed capillary column by an electric field rather than a pump. These developments are summarised in table (6.1) on the next slide. 7 7 7
, a. technique which uses a gas as the mobile phase. This is now a widely used. technique for separating volatile or semi-volatile organic substances, for example. herbicide pollutants in water or the components in a petroleum fraction. Although research into high pressure (now termed high performance) liquid. chromatography (hplc) began in the late 1960’s, the technique did not get. widely used until about a decade later with the advent of instrumental. components that could withstand pressures as high as 6000 psi and pumps that. could deliver these pressures in a smooth rather than a pulsed flow mode. More. recently, further advances have enabled the development of ultra performance. liquid chromatography (uplc) where pressures of psi are used. In the 1990s electrochromatography was developed. The mobile phase flow is. driven through a packed capillary column by an electric field rather than a pump. These developments are summarised in table (6.1) on the next slide")
8
Table 6.1 - summary of historical landmarks in chromatography
8 8 8

9
Principles of chromatography
In column chromatography analytes are injected into the mobile phase stream and are swept on to the column containing the stationary phase. Those analytes which do not interact in any way with the stationary phase pass straight through the column, they are the first to elute (flow out of the column). Some analytes will interact so strongly with the stationary phase that they remain on the column, ‘never to be seen again’. In between these two extremes, are analytes which spend some time interacting with the mobile phase, during this time they move through the column, and some time bonded to the stationary phase. Each analyte spends a slightly different length of time in the two phases and hence by the end of the column, the individual components of the analyte sample, which had been injected into the mobile phase stream, are separated and can be detected. Remember the analogy of the boats on the river (slide 5) 9 9 9
. Some analytes will interact so strongly with the stationary phase that they remain on the column, ‘never to be seen again’. In between these two extremes, are analytes which spend some time interacting with the mobile phase, during this time they move through the column, and some time bonded to the stationary phase. Each analyte spends a slightly different length of time in the two phases and hence by the end of the column, the individual components of the analyte sample, which had been injected into the mobile phase stream, are separated and can be detected. Remember the analogy of the boats on the river (slide 5)")
10
As the name suggests the stationary phase does not move. It is:
As described on the previous slide, analytes distribute themselves between two phases the stationary and the mobile phase. As the name suggests the stationary phase does not move. It is: A finely divided solid spread as a thin layer onto a sheet of glass or plastic; A finely divided solid packed tightly into a glass or stainless steel tube, referred to as a column; A finely divided solid coated with a thin layer of organic liquid and again packed into a glass or stainless steel column. A glass or silica capillary whose inner surface is coated with a low volatile organic liquid The mobile phase moves. It can be a gas, a single solvent or a mixture of solvents. Modern instrumentation makes use of columns. The sample is injected into the mobile phase stream at the front of the column. Separation occurs on the column and the separated analytes then pass out of the column into a suitable detector placed at the end of the column. A plot of the detector signal versus time is called a chromatogram, an example of which can be seen on the next slide. 10 10 10

11
Results aimed for In any chromatographic separation,
10 minutes Detector response Retention time In any chromatographic separation, the following features are desirable: All analytes separated Well separated peaks Symmetrical, sharp peaks Short run times Figure an example of a chromatogram Ideal results are not always easily achieved, however the following notes provide the basic information to enable simple chromatographic separations to be carried out. 11 11 11 11 11

12
Column chromatography
Most chromatography is performed on columns, figure (6.3) on the right is a schematic of a packed column, the arrows at the top of the column are indicative of the mobile phase. A plot of detector response versus time is called a chromatogram an example of which was seen as figure (6.2) on the previous slide. Figure 6.3 – schematic diagram of a packed column 12 12 12 12 12
 on the right is a schematic of a packed column, the arrows at the top of the column are indicative of the mobile phase. A plot of detector response versus time is called a chromatogram an example of which was seen as figure (6.2) on the previous slide. Figure 6.3 – schematic diagram. of a packed column")
13
Modes of chromatography
The particles which fill a chromatographic column are not all the same hence the types of interactions between analytes and stationary phases are not all the same. In liquid-solid chromatography the stationary phase is a solid such as calcium carbonate or more likely these days silica or alumina (Al2O3). In gas-liquid chromatography the stationary phase is a low volatility liquid coated on to a solid support eg Carbowax 20M - a polyethylene glycol with a molecular mass of 20,000 g/mole. In liquid-liquid chromatography, the stationary phase is a liquid, eg a C18 silane, covalently bonded to an inert silica support. Movement between the stationary and mobile phase can be summarised by the following equation, where A is an analyte Amobile Astationary phase 13 13 13
. In gas-liquid chromatography the stationary phase is a low volatility liquid coated on to a solid support eg Carbowax 20M - a polyethylene glycol with a molecular mass of 20,000 g/mole. In liquid-liquid chromatography, the stationary phase is a liquid, eg a C18 silane, covalently bonded to an inert silica support. Movement between the stationary and mobile phase can be summarised by the following equation, where A is an analyte. Amobile Astationary phase")
14
The modes of chromatography outlined in the following slides are:
Adsorption Partition Bonded phase Ion exchange Affinity Size exclusion The mode describes the way in which analytes interact with the stationary phase. 14 14 14

15
Adsorption chromatography
If silica, a silicon-oxygen polymer as illustrated in figure (6.4) is the stationary phase, the surface hydroxyl groups interact with the analytes, the more the interaction the more the analytes are retained and therefore the longer they take to pass through the column. Figure 6.4 - structure of silica Figure 6.5 – binding of analytes to silica. Some analytes (pink) will bind more than others (blue) and hence separation is obtained. 15 15 15 15 15
 is the stationary phase, the surface hydroxyl groups interact with the analytes, the more the interaction the more the analytes are retained and therefore the longer they take to pass through the column. Figure structure of silica. Figure 6.5 – binding of analytes to silica. Some analytes (pink) will bind more than others (blue) and hence separation is obtained")
16
Figure 6.6 – competition for adsorption sites
The mobile phase (solvent) and analyte molecules compete for the adsorbent sites of the stationary phase. The more polar the molecules the longer they are retained. Modification of the adsorbent sites can make it possible to separate isomers. ‘Strong solvents’ result in short retention times as the solvent molecules successfully compete for the stationary phase active sites which means there are fewer available sites to retain the analyte molecules. Figure 6.6 – competition for adsorption sites 16
 and analyte molecules compete for the adsorbent sites of the stationary phase. The more polar the molecules the longer they are retained. Modification of the adsorbent sites can make it possible to separate isomers. ‘Strong solvents’ result in short retention times as the solvent molecules successfully compete for the stationary phase active sites which means there are fewer available sites to retain the analyte molecules. Figure 6.6 – competition for adsorption sites. 16.")
17
Applications of adsorption chromatography
Separation of relatively non-polar, water insoluble compounds Separation of isomers Purification of antibody fragments 17 17 17

18
Partition chromatography
In partition chromatography a solid support with a high surface area such as crushed firebrick or keiselguhr is coated with a high boiling liquid which acts as the stationary phase. Separation occurs because of the differences in solubility for the analytes in the stationary and mobile phases. The partition coefficient is defined as: Concn. in stationary phase K = Concn. in mobile phase Solid support Stationary phase Analyte Figure 6.7 – coated support particle Equation (6.1) 18 18 18 18 18
")
19
Applications of partition chromatography
There are an immense number of possible applications of partition chromatography. The list below gives just a few examples of where this technique is routinely applied: Determination of water quality; Separation of aroma molecules of wine; Determination of pesticide residues; Quality control of pharmaceutical preparations; Identification and measurement on petroleum fractions. 19 19 19

20
Bonded phase chromatography
In bonded phase chromatography, the molecule acting as the stationary phase is chemically bonded to the solid support. R can be a C18 alkane chain or an amine (NH2) or cyano (CN) group or some other group. The nature of R determines the types of analytes which can be separated. The theories of partition and adsorption chromatography are both used to describe this mode of chromatography although it is often classified as a partition technique. See: for more description of bonded phases Figure 6.8 – diagram of phase bonded to silica 20 20 20 20 20
 or cyano (CN) group or some other group. The nature of R determines the types of analytes which can be separated. The theories of partition and adsorption. chromatography are both used to describe. this mode of chromatography although it is. often classified as a partition technique. See: for more description of bonded phases. Figure 6.8 – diagram of phase. bonded to silica")
21
There are two types of partition chromatography normal phase and reversed phase, they are defined by the relative polarities of the mobile and stationary phases For this reason, the use of silica (a polar molecule) as the stationary phase (as in adsorption chromatography) is also considered to be a normal phase separation method. Because of its versatility and wide range of applicability, reversed-phased chromatography is the most frequently used hplc method. 21 21 21
 as the stationary phase (as in adsorption chromatography) is also considered to be a normal phase separation method. Because of its versatility and wide range of applicability, reversed-phased chromatography is the most frequently used hplc method")
22
Ion exchange (or ion) chromatography
As the name suggests, in ion exchange chromatography, ionic analytes are exchanged with ionic groups on the stationary phase - usually a polymer with ionic functional groups. The mobile phase is an ionic solution, such as a solution of sodium bicarbonate and carbonate (8 – 12 mmolar) for separating anions, or a sulphonic acid for separating cations. Using some form of ion-suppression immediately after the analytical column, eliminates the high background conductivity of the mobile phase, enabling conductivity detectors to be used as the end of the column. Conductivity measurements in the absence of background conductivity, can provide sensitive detection for a large range of ions. The next 3 slides explains the mechanism of the suppression effect in ion chromatography 22 22 22
 for separating anions, or a sulphonic acid for separating cations. Using some form of ion-suppression immediately after the analytical column, eliminates the high background conductivity of the mobile phase, enabling conductivity detectors to be used as the end of the column. Conductivity measurements in the absence of background conductivity, can provide sensitive detection for a large range of ions. The next 3 slides explains the mechanism of the suppression effect in ion chromatography")
23
Polymeric stationary phase
Polymer functional group Exchanging ion Figure 6.9 diagram of the active site on an anion (negative ion) exchange stationary phase On the next slide, figure (6.10) shows the analytical and suppressor columns used in ion exchange chromatography. 23 23 23
 exchange stationary phase. On the next slide, figure (6.10) shows the analytical and suppressor columns used in ion exchange chromatography")
24
Figure 6.10 – Schematic representation of ion exchange separating and
suppressor columns D Cl- Br- OH- H2O Separating column NaX is the salt of the ion of interest, X is Cl- or Br-. Suppressor column OH- represents ions of high conductivity from the mobile phase Conductance detector Comparatively low conductivity 24 24 24 24 24

25
Figure (6.10) on the previous slide, shows that analyte ions literally exchange with similarly charged ions from the stationary phase. Each analyte ion will interact with the stationary phase according to its charge, size and to a certain extent shape, thereby bringing about a separation. As the analytes are ions, a convenient way of detecting them is to use a conductance detector. The problem with using a conductance detector is that it will also measure the conductance of the mobile phase. As the mobile phase is an ionic solvent it will itself have a high conductance against which the comparatively small analyte signal needs to be measured. For a long time the problem described above, meant that ion chromatography was not sensitive enough to detect low (ppm) levels of ionic analytes. The problem was solved by a company called Dionex (their name is often synonymous with ion exchange chromatography), which introduced a suppressor column after the separating column. The suppressor column also contains an ion exchange resin. The ions from this resin react with the ions of the mobile phase to produce molecules which have a lower conductance, e.g. water, than the ions themselves. The analyte ions will also react with this resin but the molecules formed will be of equal conductance to those they replace. In the previous slide NaCl (eluting analyte) would be replaced with HCl. 25 25 25

26
Applications of ion exchange chromatography
Separation of vitamins Separation of inorganic cations and anions Separation low molecular weight organic acids Analysis of serum Analysis of drugs 26 26 26

27
Affinity chromatography
Affinity chromatography involves the interaction of a ligand (bound to a solid support with a spacer molecule) with the analyte. Figure illustration of a ligand bound to the solid support There are two types of ligand that can be used in affinity chromatography. Those which are specific and so bind to a specific analyte and those which are general and which bind to a group of analytes which have similar properties. A ligand acts in a similar way to an enzyme, a brief description of which is given on the next slide. 27 27 27
 with the analyte. Figure illustration of a ligand bound to the solid support. There are two types of ligand that can be used in affinity chromatography. Those which are specific and so bind to a specific analyte and those which are general and which bind to a group of analytes which have similar properties. A ligand acts in a similar way to an enzyme, a brief description of. which is given on the next slide")
28
Enzymes in analytical science
An enzyme is typically a protein molecule which enables reactions to proceed under physiological conditions. Often an enzyme reacts with a very limited number of compounds referred to as substrates. Binding between an enzyme and a substrate is via weak covalent bonds the formation of which is strongly influenced by the shapes of the enzyme and substrates, this has led to the lock and key theory to describe how the shape of the enzyme allows only those substrates with a complimentary shape to react; this theory also explains how the ligand in affinity chromatography behaves (seeing binding step in figure (6.12). Because the bonds between an enzyme and its substrate are weak any change in the shape of the substrate due to chemical reactions which have taken place while bound to the enzyme or any change in the conditions under which the reaction is taking place cause the bonds between enzyme and substrate to further weaken and ultimately to release the modified substrate. In affinity chromatography it is undesirable to modify the substrate so one mobile phase is used to give the conditions to enable binding and a second mobile phase is used to elute the retained analytes, a small change in the pH or ionic strength of the mobile phase can be sufficient to enable elution. In affinity chromatography the ligand is bound to the solid support using a spacer molecule this molecule is present to ensure that the ligand retains its required binding properties as if it was in close proximity to the solid support the shape of the ligand could be distorted by additional binding to with the solid support itself. 28
. Because the bonds between an enzyme and its substrate are weak any. change in the shape of the substrate due to chemical reactions which have taken place. while bound to the enzyme or any change in the conditions under which the reaction is. taking place cause the bonds between enzyme and substrate to further weaken and. ultimately to release the modified substrate. In affinity chromatography it is undesirable to. modify the substrate so one mobile phase is used to give the conditions to enable binding. and a second mobile phase is used to elute the retained analytes, a small change in the. pH or ionic strength of the mobile phase can be sufficient to enable elution. In affinity chromatography the ligand is bound to the solid support using a spacer molecule. this molecule is present to ensure that the ligand retains its required binding properties as. if it was in close proximity to the solid support the shape of the ligand could be distorted by. additional binding to with the solid support itself. 28.")
29
The five steps in affinity chromatography
activation the ligand is bound to the chromatographic solid support. loading the analytes to be separated are introduced into the mobile phase stream. binding the analytes of interest are retained due to interaction with the ligand of the stationary phase. washing unwanted analytes are eluted from the column. elution the analyte(s) of interest are washed from the column by changing the mobile phase composition. These five steps are illustrated in figure (6.12) shown on the next slide 29 29 29
 of interest are washed from the column by changing the mobile phase composition. These five steps are illustrated in figure (6.12) shown on the next slide")
30
activation load binding washing elution
Figure 6.12 – schematic diagram of affinity chromatography 30 30 30

31
Applications of affinity chromatography
Purification of proteins Study of drug and hormone interactions with proteins Immunoassays 31 31 31

32
Size exclusion chromatography
In size exclusion chromatography (sec) there are no chemical interactions with the mobile phase. The analytes are separated based on physical interactions - whether on not they are small enough to fit into the pores of the stationary phase. The stationary phases used are wide-pore silica gel, polysaccharides, and synthetic polymers like polyacrylamide or styrene-divinylbenzene copolymer. Pore sizes within the solid phases range from 4 – 250 nm. When an aqueous mobile phase is used, the technique is known as gel filtration chromatography (gfc sec) and the stationary phase will be hydrophilic (hydrophilic means water loving). If an organic mobile phase is used it is known as gel permeation chromatography (gpc sec) and the stationary phase will be hydrophobic (hydrophobic means water hating). 32 32 32
 there are no chemical interactions with the mobile phase. The analytes are separated based on physical interactions - whether on not they are small enough to fit into the pores of the stationary phase. The stationary phases used are wide-pore silica gel, polysaccharides, and synthetic polymers like polyacrylamide or styrene-divinylbenzene copolymer. Pore sizes within the solid phases range from 4 – 250 nm. When an aqueous mobile phase is used, the technique is known as gel filtration chromatography (gfc sec) and the stationary phase will be hydrophilic (hydrophilic means water loving). If an organic mobile phase is used it is known as gel permeation chromatography (gpc sec) and the stationary phase will be hydrophobic (hydrophobic means water hating)")
33
Continued on the next slide
6.13 6.14 Continued on the next slide 33

34
Figure (6.14) on the previous slide, illustrates how each size exclusion column is only capable of separating molecules within a limited molecular weight range ( on the graph shown). All molecules with a mass larger than this, will pass straight through the column and be eluted together at the start of the chromatogram ie: they will provide ‘tm‘ the retention time for un-retained analytes. Molecules which have a mass smaller than the range will be trapped within the pores of the stationary phase and ‘never seen again’. In order for molecules to be separated they need mass differences of approximately 10%. Note: a fuller description of ‘tm‘ is provided in later slides 34 34 34

35
Application of size exclusion chromatography
Determination of the molecular mass distribution of synthetic polymers Analysis of sugars Analysis and isolation of lipid polymers Purification, identification, and quantification of protein mixtures Study of polymer reaction kinetics Separation and purification of large biomolecules (molecular mass > 10,000 g/mole) 35 35 35
")
36
Chromatographic terms
Chromatography is a method used for separating a mixture of compounds. Separation takes place on the column containing the stationary phase. By washing eluent or mobile phase through the column the sample is separated into its individual components and is eluted from the column. A chromatograph is a sophisticated instrument used to separate analytes. The components of different types of chromatograph will be considered in a later chapters. A chromatogram is a recording of the detector response versus time. 36 36 36 36 36

37
Void time or void volume
Figure (6.15) shows a chromatogram containing two peaks: The analyte peak (tr from the point of injection) The unretained peak (tm from the point of injection The time tm represents the void time of the column, which is the time required for an un-retained solute (those that move through the column at the same rate as the mobile phase) to move from the point of injection to Signal Point of injection Time Figure 6.15 column void time the detector. This time can be significant for solutes that elute rapidly from the column and thus should be allowed for in calculations of relative retention. To allow for the void time, measurements of retention time are made, not from the time of injection, but from the retention time of an unretained component ‘tm’ These values are sometimes referred to as ‘Adjusted retention times’ and are given the symbol ( tr’), see next slide. 37
 shows a chromatogram containing two peaks: The analyte peak (tr from the point. of injection) The unretained peak (tm from the. point of injection. The time tm represents the void time of the column, which is the time required for an un-retained solute (those that move through the column at the same rate as the mobile phase) to move from the point of injection to. Signal. Point of. injection. Time. Figure 6.15 column void time. the detector. This time can be significant for solutes that elute rapidly from the. column and thus should be allowed for in calculations of relative retention. To. allow for the void time, measurements of retention time are made, not from the. time of injection, but from the retention time of an unretained component ‘tm’ These values are sometimes referred to as ‘Adjusted retention times’ and are. given the symbol ( tr’), see next slide. 37.")
38
Figure 6.16 – a sketch of a chromatogram showing
The chromatogram Figure 6.16 – a sketch of a chromatogram showing tm, trA and t’ref Adjusted retention (t’rA) = trA – tm ( ) Equation (6.2) adjusted retention of analyte t’rA Relative retention ratio (R) = = adjusted retention reference t’ref Equation (6.3) 38 38 38 38 38
 = trA – tm ( ) Equation (6.2) adjusted retention of analyte t’rA. Relative retention ratio (R) = = adjusted retention reference t’ref. Equation (6.3)")
39
When analytes have been separated, their chromatographic retention time is indicative of their identity. However it is important to remember that chromatography is a separation method not an identification method. In order to identify the analytes giving rise to the peaks on a chromatogram, it is necessary to compare the results for a sample solution with the results for standard solutions containing known analytes with known retention times. It is also very helpful to have prior knowledge of what analytes are expected to be present. It is also important that standard and sample solutions are separated using the same chromatographic conditions as retention data can be greatly affected by any such changes. On the previous slide the adjusted retention and relative retention ratios were illustrated. These values are sometimes used instead of the retention time itself, as they are less influenced by any changes in the experimental conditions which can occur. 39 39 39

40
The partition coefficient
Once introduced into the chromatographic column, the analytes begin to distribute themselves between the stationary and the mobile phases in accordance with their partition coefficients. The partition coefficient (K) is defined as the ratio of these concentrations at equilibrium. Thus: Concentration of analyte in the stationary phase (Cs) K = Concentration of analyte in the mobile phase (Cm) Separation occurs between mixtures of analytes, when each analyte has a different ratio of solubility's in the mobile and stationary phases. Equation (6.4) 40 40 40 40 40
 is defined as the ratio of these concentrations at equilibrium. Thus: Concentration of analyte in the stationary phase (Cs) K = Concentration of analyte in the mobile phase (Cm) Separation occurs between mixtures of analytes, when each analyte has a different ratio of solubility s in the mobile and stationary phases. Equation (6.4)")
41
Resolution -Rs Equation (6.5) where:
tr1 is the retention time of one analyte and tr2 is the retention time of the next analyte to elute w1 and w2 are the widths of the peaks at base when approximated to triangles. Note: both tr measurements are made from that of the unretained peak. Figure 6.17 – a sketch of a chromatogram showing adjusted retention times and peak width Baseline resolution when R = 1.0 for triangles! Chromatographic peaks are not triangles they are Gaussian in shape; for Gaussian peaks Rs = 1.5 for baseline resolution (complete separation) as when Rs = 1.0 only 94% resolution is obtained. 41 41 41 41 41
 as when Rs = 1.0 only 94% resolution is obtained")
42
The capacity factor Capacity factor, k’ (kay prime) or more correctly k The capacity factor is sometimes used instead of the retention time as it is a comparative method of reporting results and therefore less affected by experimental variables. Remember the retention ratio, another comparative method used to report chromatographic results. The capacity factor [equation (2a.22)] tends to be used most for high performance liquid chromatographic (hplc) results. When developing chromatographic methods a k’ value between 5 – 20 is aimed for, as this usually gives good separation in a reasonable time. Equation (6.6) 42 42 42
 or more correctly k The capacity factor is sometimes used instead of the retention time as it is a comparative method of reporting results and therefore less affected by experimental variables. Remember the retention ratio, another comparative method used to report chromatographic results. The capacity factor [equation (2a.22)] tends to be used most for high performance liquid chromatographic (hplc) results. When developing chromatographic methods a k’ value between 5 – 20 is aimed for, as this usually gives good separation in a reasonable time. Equation (6.6)")
43
Chromatographic plate theory
The plate theory arises from the theories which describe fractional distillation. It shows why analyte molecules which are injected into the mobile phase at the same time, give rise to a peak which is Gaussian (bell) shaped and why peaks have a finite width of many seconds. According to the theory, an analyte will partition itself between zones (or plates) of the mobile and stationary phases as they come into contact with each other. Figure (6.18) on the following slide, illustrates the chromatographic process for a single analyte with a value of K = 1 and which therefore partitions itself equally between the mobile and the stationary phases. 43 43 43 43 43
 shaped and why peaks have a finite width of many seconds. According to the theory, an analyte will partition itself between zones (or plates) of the mobile and stationary phases as they come into contact with each other. Figure (6.18) on the following slide, illustrates the chromatographic process for a single analyte with a value of K = 1 and which therefore partitions itself equally between the mobile and the stationary phases")
44
Figure 6.18 - an animated diagram of a chromatographic separation, illustration
movement of an analyte through a column The analyte (64 parts) partitions itself between the two phases as they come into contact. Mobile phase 32 64 32 16 12 16 12 16 12 8 64 2 8 4 8 4 8 4 8 4 2 4 4 8 2 12 8 12 8 8 2 16 32 16 Stationary phase 44 44 44 44 44
 partitions itself between the two phases as they come. into contact. Mobile phase Stationary phase")
45
Figure 6.19 – Gaussian distribution
In figure (6.18) the analyte started on one plate of the mobile phase but after 5 equilibrations it was spread across five plates. This demonstrates how dividing the phases into theoretical plates explains the spreading of analyte molecules during a chromatographic separation. It also demonstrates why chromatographic peaks are Gaussian, or bell shaped, in shape rather than being triangular. In reality the analyte molecules also spread due to other factors which will be discussed when the deficiencies or limitations of the plate theory are considered. Only five equilibrations were considered in figure (6.18) , however if the calculation had been extended to 10, and the resultant relative concentrations plotted, a Gaussian distribution plot as illustrated in figure (6.19) would have been obtained. It is important to note that even the shortest chromatographic column will have many more ‘plates’ than this. Figure 6.19 – Gaussian distribution plot 45 45 45
 the analyte started on one plate of the mobile phase but after 5 equilibrations it was spread across five plates. This demonstrates how dividing the phases into theoretical plates explains the spreading of analyte molecules during a chromatographic separation. It also demonstrates why chromatographic peaks are Gaussian, or bell shaped, in shape rather than being triangular. In reality the analyte molecules also spread due to other factors which will be discussed when the deficiencies or limitations of the plate theory are considered. Only five equilibrations were considered in figure (6.18) , however if the calculation had been extended to 10, and the resultant relative concentrations plotted, a Gaussian distribution plot as illustrated in figure (6.19) would have been obtained. It is important to note that even the shortest chromatographic column will have many more ‘plates’ than this. Figure 6.19 – Gaussian distribution. plot")
46
Concentration of analyte
The figure (6.20) below illustrates the effect of the analyte partition coefficients, the ‘parts’ of the analyte have been plotted as the concentration of the analyte. Analytes with different partition coefficients separate from one another as they partition between the theoretical plates. Concentration of analyte solvent Plate number Figure Plot showing the separation of three analytes (plus solvent), each with a different partition coefficient 46 46 46
 below illustrates the effect of the analyte partition coefficients, the ‘parts’ of the analyte have been plotted as the concentration of the analyte. Analytes with different partition coefficients separate from one another as they partition between the theoretical plates. Concentration of analyte. solvent Plate number. Figure Plot showing the separation of three analytes (plus solvent), each with a different partition coefficient")
47
A number of experimental variables affect chromatographic separations:
The nature of the analyte and the mobile and stationary phases determines the partition coefficients; How sensitive a detector is to a particular analyte - the response factor changes the size of the peak observed; The number of equilibrations which can take place in a column ie the number of theoretical plates determines how good the final separation of the analytes will be. It is important to remember that the plates are purely hypothetical, being a means of describing the movement of analytes through a column, whereby the analyte (A) spends time in both phases and equilibrates itself between the two phases before moving on. The analyte only moves through the column when it is in the mobile phase. Therefore the rate at which an analyte moves through the column is proportional to the time spent in the mobile phase. Differences in the value of K, the partition coefficient, for different analytes results in them separating into distinct zones or bands. 47 47 47
 spends time in both phases and equilibrates itself between the two. phases before moving on. The analyte only moves through the column when. it is in the mobile phase. Therefore the rate at which an analyte moves. through the column is proportional to the time spent in the mobile phase. Differences in the value of K, the partition coefficient, for different analytes. results in them separating into distinct zones or bands")
48
Figure 6.21- chromatographic
Column efficiency ‘H’ or HETP is the length of column which corresponds to a theoretical plate. This needs to be a minimum for efficient separation ‘N’ is the number of plates per column ‘L’ is the length of the column From a chromatographic peak, such as the one shown in figure (6.21), it is possible to evaluate ‘H’ and ‘N’. Figure chromatographic peak showing tr and w Continued on the next slide 48 48 48 48 48
, it is possible to evaluate ‘H’ and ‘N’. Figure chromatographic. peak showing tr and w. Continued on the next slide")
49
Statistically it can be shown that
Equation (6.7) Statistically it can be shown that From equation (6.9) it is possible to see that for a given length of column (L) the greater the number of plates, the smaller each individual plate will be. Equation (6.8) Thus by combining equations (6.7 & 6.8) Equation (6.9) For this reason ‘H’ and ‘N’ are often quoted, e.g. in suppliers catalogues, to give an indication how good (efficient) a column is at separating particular analytes. The higher the value of ‘N’ and conversely the lower the value for ‘H’, the more efficient the column. This enables a comparison of similar chromatographic columns from different suppliers. However it is important to remember that when selecting a column to perform a particular separation, ‘like separates like’ i.e. in gas chromatography a polar column is needed to separate polar analytes. In practise this means that if a column is efficient at separating one class of analytes (eg alcohols) it will not necessarily be as efficient as separating those of a different nature (eg alkanes). 49 49 49
 Statistically it can be shown that. From equation (6.9) it is. possible to see that for a given. length of column (L) the greater. the number of plates, the. smaller each individual plate. will be. Equation (6.8) Thus by combining equations (6.7 & 6.8) Equation (6.9) For this reason ‘H’ and ‘N’ are often quoted, e.g. in suppliers catalogues, to give an indication how good (efficient) a column is at separating particular analytes. The higher the value of ‘N’ and conversely the lower the value for ‘H’, the more efficient the column. This enables a comparison of similar chromatographic columns from different suppliers. However it is important to remember that when selecting a column to perform a particular separation, ‘like separates like’ i.e. in gas chromatography a polar column is needed to separate polar analytes. In practise this means that if a column is efficient at separating one class of analytes (eg alcohols) it will not necessarily be as efficient as separating those of a different nature (eg alkanes)")
50
Deficiencies of the plate theory
The plate theory is far from perfect and as the following four slides show, it has a number of limitations: The plate theory assumes K is linear and therefore that the plates are symmetrical; It assumes rapid equilibration of the analyte between mobile and stationary phases; All peak broadening is not accounted for; The effect of the mobile phase is ignored; The dimensions (eg the thickness) of the phases are not taken into account 50 50 50 50 50
 of the phases are not taken into. account")
51
Eddy diffusion 6.22 The fact that the analyte molecules do not all take the same path through a packed column means that they do not all reach the detector at the same time hence peak broadening is observed. 51

52
Longitudinal broadening (blotting paper effect)
Mobile phase flow Narrow at point of introduction on the column Broadened analyte zone some time after introduction on to the column due to the diffusion of the analyte. Figure illustration of the effect of longitudinal diffusion If the velocity of the mobile phase is high then the analyte spends less time on the column which decreases the effects of longitudinal broadening. 52 52 52 52 52

53
Equilibrium not established
Mobile phase flow Broadened peak, due to equilibrium being too slow to establish before the mobile phase has moved on down the column, taking some of the analyte with it. Time for equilibrium to establish so no peak broadening. If the mobile phase velocity is high the worse the broadening becomes. Figure illustration of the effect of not establishing an equilibrium of the analyte between the stationary and mobile phases. 53 53 53 53 53

54
Comparison of peak broadening theories
The peak broadening effects on the previous three slides require very different mobile phase flow rates in order for peak broadening to be minimised. Longitudinal broadening requires high flow rates; Mass transfer (establishing the equilibrium) requires flow rates to be kept to a minimum. As will be shown at the end of the ‘Rate theory’ section of these notes, this apparent contradiction results in an optimum value for the mobile phase flow rate. 54 54 54
 requires flow rates to be kept to. a minimum. As will be shown at the end of the ‘Rate theory’ section of these notes, this apparent contradiction results in an optimum value for the mobile phase flow rate")
55
Chromatographic Rate theory
Because of the limitations of the plate theory it has been largely replaced by the ‘Rate theory’, which is based mathematically upon the Van Deemter equation. This is shown as equation (6.10) below: Equation (6.10) For a packed column the Van Deemter equation is directly applicable. However for capillary columns which are now commonly used in gas-liquid chromatography, a similar equation applies but without the ‘A’ term which is now zero, as capillary columns have no column packing. Where: is the average mobile phase velocity A takes into account eddy diffusion B longitudinal diffusion C mass transfer 55 55 55 55 55
 below: Equation (6.10) For a packed column the Van Deemter equation is directly applicable. However for capillary columns which are now commonly used in gas-liquid chromatography, a similar equation applies but without the ‘A’ term which is now zero, as capillary columns have no column packing. Where: is the average mobile phase velocity. A takes into account eddy diffusion. B longitudinal diffusion. C mass transfer")
56
The effect of the three terms in the van Deemter equation are shown graphically in figure (6.25) below. 6.25 Remember that we want ‘H’ to be a minimum for efficient separations. So the above plot illustrates that there is an optimum mobile phase flow rate to achieve this, the range is shown by the red arrows. The red line shows the combination of the three broadening terms. 56

57
Comparison between Plate and Rate theories
The advantage of the rate theory is that the terms A, B and C are defined in terms of experimental variables which in practise are seen to affect the chromatographic separation which is obtained. Typical variables are: Thickness of the stationary phase; Nature of the analyte; Nature of the mobile and stationary phases; Column length and diameter. The plate theory does not take into account all these variables nor does it take into account the mobile phase flow rate which as has been shown has a significant effect on the peaks obtained during a separation. However the plate theory does explain why separation is achieved and the shape of the peaks. 57 57 57

58
Types of chromatography
This chapter of this teaching & learning programme has outlined the theoretical principles of a number of chromatographic techniques. Three of these techniques will be considered in more detail. These are: Thin-layer chromatography (tlc); Gas chromatography (gc) – (see Chapter 7 of this teaching and learning programme) High Performance liquid chromatography (hplc) – (see Chapter 7 of this teaching and learning programme) 58 58
; Gas chromatography (gc) – (see Chapter 7 of this teaching and learning programme) High Performance liquid chromatography (hplc) – (see Chapter 7 of this teaching and learning programme)")
59
Thin layer chromatography (tlc)
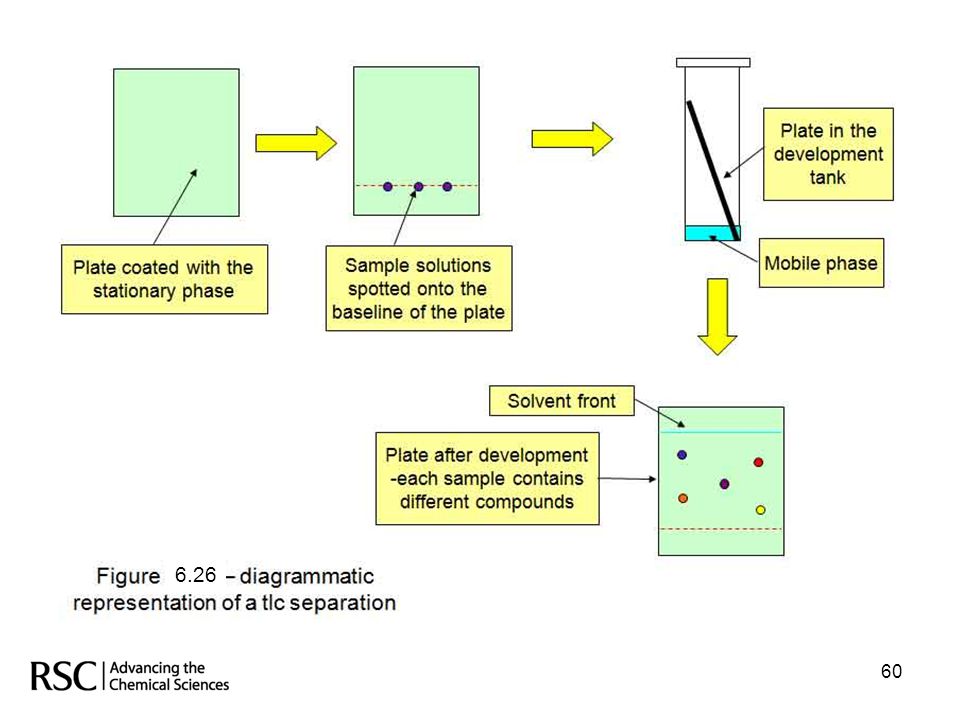
In thin layer chromatography (tlc) the stationary phase is coated, as a thin layer, onto a flat sheet of glass, plastic or sometimes metal. The mobile phase (a single solvent or a mixture of solvents) is poured into the developing tank, a lid placed on the tank and the atmosphere inside the tank allowed to equilibrate with the solvent(s). The mixture of analytes is spotted onto the plate at a height above the level of the solvent. The plate is then placed into the developing tank, the lid replaced and the mobile phase allowed to rise up the plate by capillary action. The analytes separate in the usual chromatographic manner due to their interactions with the mobile and stationary phases. Figure (6.26) on the next slide, illustrates these procedures diagrammatically. The line along which the analytes are spotted on to the plate is called the baseline and the line to which the mobile phase travels is known as the solvent front. In tlc, the choice of stationary phase is comparatively limited, silica or alumina based stationary phases (both are polar) are common, but virtually any combination of miscible solvents can be used as the mobile phase. 59 59
 the stationary phase is coated, as a thin. layer, onto a flat sheet of glass, plastic or sometimes metal. The mobile phase. (a single solvent or a mixture of solvents) is poured into the developing tank, a. lid placed on the tank and the atmosphere inside the tank allowed to equilibrate. with the solvent(s). The mixture of analytes is spotted onto the plate at a height. above the level of the solvent. The plate is then placed into the developing. tank, the lid replaced and the mobile phase allowed to rise up the plate by. capillary action. The analytes separate in the usual chromatographic manner. due to their interactions with the mobile and stationary phases. Figure (6.26) on the next slide, illustrates these procedures diagrammatically. The line along which the analytes are spotted on to the plate is called the. baseline and the line to which the mobile phase travels is known as the. solvent front. In tlc, the choice of stationary phase is comparatively limited, silica or alumina. based stationary phases (both are polar) are common, but virtually any. combination of miscible solvents can be used as the mobile phase")
60
6.26 60
61
tlc mobile phases Figure (6.27) on the next slide shows the importance of selecting a suitable mobile phase in order to create the best conditions for separation. The analytes are of medium ‘polarity’. In this instance the heptane / toluene mobile phase is not strong (or polar) enough to compete with the polar sites on stationary phase for the analytes, hence the analytes do not move far from the baseline where they were spotted initially onto the plate. Conversely the methanol / toluene mobile phase is too strong (too polar) and therefore the analytes all move to the solvent front. In this instance the analytes are unable to compete with the mobile phase for the stationary phase. When toluene (weakly polar), is used as the mobile phase the ‘polarities’ of the stationary and mobile phases are suitably balanced so that there is discrimination between the analytes and hence they are separated. Remember the rule of thumb ‘like separates like’. Here it applies to the relative polarities of the mobile phase and the analytes. As stated earlier, there is a limited number of stationary phases for use in tlc, therefore discrimination between analytes is achieved by altering the mobile phase composition. 61 61 61
 on the next slide shows the importance of selecting a suitable mobile phase in order to create the best conditions for separation. The analytes are of medium ‘polarity’. In this instance the heptane / toluene mobile phase is not strong (or polar) enough to compete with the polar sites on stationary phase for the analytes, hence the analytes do not move far from the baseline where they were spotted initially onto the plate. Conversely the methanol / toluene mobile phase is too strong (too polar) and therefore the analytes all move to the solvent front. In this instance the analytes are unable to compete with the mobile phase for the stationary phase. When toluene (weakly polar), is used as the mobile phase the ‘polarities’ of the stationary and mobile phases are suitably balanced so that there is discrimination between the analytes and hence they are separated. Remember the rule of thumb ‘like separates like’. Here it applies to the relative polarities of the mobile phase and the analytes. As stated earlier, there is a limited number of stationary phases for use in tlc, therefore discrimination between analytes is achieved by altering the mobile phase composition")
62
The mobile phase is too weak compared to the stationary phase
Heptane / toluene (non-polar) toluene Methanol / toluene (polar) The mobile phase is too weak compared to the stationary phase The mobile phase is sufficiently strong to result in discrimination between the analytes The mobile phase is too strong compared to the stationary phase Figure effect of mobile phase on tlc separations 62 62
 toluene. Methanol / toluene. (polar) The mobile phase is too weak compared to the stationary phase. The mobile phase is sufficiently strong to result in discrimination between the analytes. The mobile phase is too strong compared to the stationary phase. Figure effect of mobile phase on tlc separations")
63
Tlc visualisation Physical Methods
In tlc there are a number of ways of observing or visualising the separated (and mostly colourless) analytes. These divide into two categories physical and chemical methods. Physical Methods The physical methods are based on the absorbance or emission of radiation, usually in the ultraviolet (UV) range of the electromagnetic spectrum. Many of the compounds separated will absorb uv light. Therefore placing a developed tlc plate under a UV lamp will show up these compounds as darker spots (the light having been absorbed) against a lighter background. If the separated analytes are capable of emitting radiation (fluorescing), then placing the plate under a suitable light source will results in bright, fluorescing spots being shown. Some analytes are incapable of absorbing UV light or fluorescing. In this case a fluorescent compound, such as cadmium or zinc sulphides, is incorporated into the stationary phase so the whole plate appears bright yellow/green when held under a uv light source. Once this type of plate is developed the analytes appear as dark spots as they quench the background fluorescence from the stationary phase. 63 63 63
 analytes. These divide into two categories physical and chemical methods. Physical Methods. The physical methods are based on the absorbance or emission of radiation, usually in the ultraviolet (UV) range of the electromagnetic spectrum. Many of the compounds separated will absorb uv light. Therefore placing a developed tlc plate under a UV lamp will show up these compounds as darker spots (the light having been absorbed) against a lighter background. If the separated analytes are capable of emitting radiation (fluorescing), then placing the plate under a suitable light source will results in bright, fluorescing spots being shown. Some analytes are incapable of absorbing UV light or fluorescing. In this case a fluorescent compound, such as cadmium or zinc sulphides, is incorporated into the stationary phase so the whole plate appears bright yellow/green when held under a uv light source. Once this type of plate is developed the analytes appear as dark spots as they quench the background fluorescence from the stationary phase")
64
Chemical Methods Chemical methods of visualisation can be selective and highlight a few analytes, or be universal and highlight nearly every analyte. To use a chemical visualiser the reagent is sprayed on to the plate as a fine mist or the plate is quickly dipped into a tank of the reagent vapour. Universal visualisers include iodine and concentrated sulphuric acid. Iodine forms complexes with organic compounds which are brown in colour and hence the analytes on the tlc plate appear brown. The advantage of this method is that the complexes are not very stable and so the spots fade within a short period of time leaving the analyte unchanged. Sulphuric acid also produces brown spots but this is because any organic material has been charred and therefore destroyed. Selective visualisers include ninhydrin which reacts with amines, peptides and amino acids to produce purple/pink compounds. Another reagent, fluorescein can be used to convert hydrocarbons, barbiturates and many other compounds into fluorescent derivatives which then fluoresce under UV light. 64 64

65
Tlc - reporting results
In tlc the retardation factor (Rf) is used to report the results of a separation Distance travelled by analyte Rf = Distance travelled by solvent front Equation (6.11) Solvent front Distance to solvent front Distance travelled by analyte Figure diagram of tlc plate to show distance to the solvent front to enable calculation of the Rf value. 65 65 Continued on the next slide 65
 is used to report the results of a separation. Distance travelled by analyte. Rf = Distance travelled by solvent front. Equation (6.11) Solvent front. Distance to solvent front. Distance travelled. by analyte. Figure diagram of tlc plate to show distance to the solvent front to enable. calculation of the Rf value Continued on the next slide. 65.")
66
The degree of mobile phase saturation in the atmosphere of the
The retardation factor (Rf), like many other values in chromatography, is another ratio value used to report chromatographic results. In tlc, these are the favoured values, as they are less influenced by changes in the experimental conditions than absolute measurements of distance travelled by individual analytes. The following variables all influence how far an analyte moves up the plate: The degree of mobile phase saturation in the atmosphere of the developing tank; The thickness of the stationary phase layer; The distance moved by the solvent front; The sample size; The moisture content of the stationary and mobile phases. 66 66
, like many other values in chromatography, is another ratio value used to report chromatographic results. In tlc, these are the favoured values, as they are less influenced by changes in the experimental conditions than absolute measurements of distance travelled by individual analytes. The following variables all influence how far an analyte moves up the plate: The degree of mobile phase saturation in the atmosphere of the. developing tank; The thickness of the stationary phase layer; The distance moved by the solvent front; The sample size; The moisture content of the stationary and mobile phases")
67
Tlc - applications Used to check the purity and success of organic syntheses; A quick way of checking the purity of reagents; Can be used to investigate potential hplc separations as the same stationary and mobile phases can be used in both techniques; Can be useful when a high sample throughput required, as 20+ samples can be spotted on a single plate. The main disadvantage of tlc is that it does not readily lend itself to quantitative analyses, unlike hplc or gc and thus is used mainly for identification purposes (qualitative analysis) 67 67
")
68
Question 6. 1 Sketch and label an idealised chromatogram
Question 6.1 Sketch and label an idealised chromatogram. How can the resolution between two peaks be evaluated from such a plot? Question 6.2 What are the causes of peak broadening and which of the terms in the rate equation take them into account?

69
Question number 6.1 The answer to this question can be found on slide 41 which shows a stylised chromatogram and the equation for determining the resolution between two peaks. Note that adjusted or absolute retention times can be used, also note that the width (w) is found by approximating the peak to a triangle this is why a resolution of 1.5 is required for 100% separation.
 is found by approximating the peak to a triangle this is. why a resolution of 1.5 is required for 100% separation.")
70
Question number 6.2 The answer to this question may be found on slides There are a number of factors which cause peak broadening these are summarised in the Van Deemter equation: Longitudinal diffusion, the B term; Eddy diffusion in packed columns only, the A term; Mass transfer, the C term. The A, B and C terms may be defined in terms of a number of variables which the chromatographer can control; such as column length, diameter and thickness of the stationary phase and the nature of both the stationary and mobile phases. In addition the mobile phase flow rate, as shown by the rate equation, also affects the peak broadening.

Similar presentations


>")


![Paper and Thin Layer Chromatography (TLC) Experiment 4 BCH 333[practical]](/18/6082114/big_thumb.jpg "Paper and Thin Layer Chromatography (TLC) Experiment 4 BCH 333[practical]>")


 between mobile phase and stationary phase Richard Vytášek.>")

