Download presentation
Presentation is loading. Please wait.

1
Chapter # 10 – Population Growth (pg. 204 – 221)
")
2
Statistical Results – Biased Coin-flipping Tuesdays LabThursdays Lab 2 0.05, 1,4 = 18.06 Reject Null Hypothesis (Statistically Significant) (P < 0.05) 2 0.05, 1,4 = 0.86 Accept Null Hypothesis (No Difference) (P > 0.05) 2 0.05, 2,8 = 7.28 Reject Null Hypothesis (Statistically Significant) (P < 0.05)
 (P < 0.05) , 1,4 = 0.86 Accept Null Hypothesis (No Difference) (P > 0.05) , 2,8 = 7.28 Reject Null Hypothesis (Statistically Significant) (P < 0.05)")
3
Chapter # 10 – Population Growth (pg. 204 – 221) 10.1Population Growth Reflects the Difference Between Birth and Death. 10.2Life Tables Provide a Schedule of Age- Specific Mortality and Survival. 10.3Different Life Tables Reflect Different Approaches to Defining Cohorts and Age Structure. 10.4Life Tables Provide Data for Mortality and Survivorship Curves.
 10.1Population Growth Reflects the Difference Between Birth and Death. 10.2Life Tables Provide a Schedule of Age- Specific Mortality and Survival. 10.3Different Life Tables Reflect Different Approaches to Defining Cohorts and Age Structure. 10.4Life Tables Provide Data for Mortality and Survivorship Curves..")
5
Chapter # 10 – Population Growth (pg. 204 – 221) 10.2Life Tables Provide a Schedule of Age- Specific Mortality and Survival. Life Tables provide an age-specific account of mortality. The construction of a life table begins with a cohort - a group of individuals born in the same period of time.
 10.2Life Tables Provide a Schedule of Age- Specific Mortality and Survival. Life Tables provide an age-specific account of mortality. The construction of a life table begins with a cohort - a group of individuals born in the same period of time..")
6
Chapter # 10 – Population Growth (pg. 204 – 221) 10.2Life Tables Provide a Schedule of Age- Specific Mortality and Survival. x n x. 0530 1159 2 80 3 48 4 21 5
 10.2Life Tables Provide a Schedule of Age- Specific Mortality and Survival. x n x")
7
Chapter # 10 – Population Growth (pg. 204 – 221) 10.2Life Tables Provide a Schedule of Age- Specific Mortality and Survival. x n x. 0-1530 1-2159 2-3 80 3-4 48 4-5 21 5-6 5 Gray Squirrels (Sciurus carolinensis)
 10.2Life Tables Provide a Schedule of Age- Specific Mortality and Survival. x n x Gray Squirrels (Sciurus carolinensis).")
8
Chapter # 10 – Population Growth (pg. 204 – 221) 10.2Life Tables Provide a Schedule of Age- Specific Mortality and Survival. x n x l x. 0-15301.00 1-21590.30 2-3 800.15 3-4 480.09 4-5 210.04 5-6 50.01 l x = the probability at birth of surviving to any given age. 159/530
 10.2Life Tables Provide a Schedule of Age- Specific Mortality and Survival. x n x l x l x = the probability at birth of surviving to any given age. 159/530.")
9
Chapter # 10 – Population Growth (pg. 204 – 221) 10.2Life Tables Provide a Schedule of Age- Specific Mortality and Survival. x n x d x. 0-1530371 1-2159 79 2-3 80 32 3-4 48 27 4-5 21 16 5-6 5 5 d x = an estimate of age-specific mortality. This is the number of individuals that died during any given time interval. 159 - 80 530 - 159
 10.2Life Tables Provide a Schedule of Age- Specific Mortality and Survival. x n x d x d x = an estimate of age-specific mortality. This is the number of individuals that died during any given time interval")
10
Chapter # 10 – Population Growth (pg. 204 – 221) 10.2Life Tables Provide a Schedule of Age- Specific Mortality and Survival. x n x d x q x. 0-15303710.70 1-2159 790.50 2-3 80 320.40 3-4 48 270.55 4-5 21 160.75 5-6 5 51.00 q x = an estimate of age-specific mortality. 371/530 79/159
 10.2Life Tables Provide a Schedule of Age- Specific Mortality and Survival. x n x d x q x q x = an estimate of age-specific mortality. 371/530 79/159.")
11
Chapter # 10 – Population Growth (pg. 204 – 221) 10.2Life Tables Provide a Schedule of Age- Specific Mortality and Survival.
 10.2Life Tables Provide a Schedule of Age- Specific Mortality and Survival..")
12
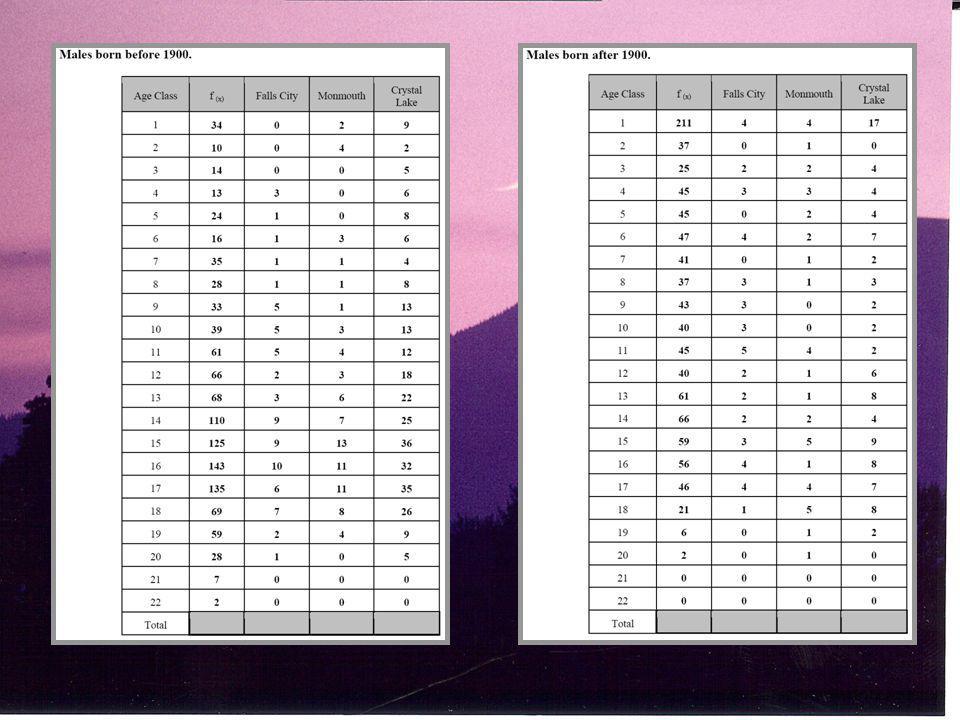
Chapter # 10 – Population Growth (pg. 204 – 221) Locations Falls City Cemetery Fircrest (Monmouth Cemetery Crystal Lake Cemetery (Corvallis) Females Born Before 1900 Born After 1900 Males Born Before 1900 Born After 1900
 Locations Falls City Cemetery Fircrest (Monmouth Cemetery Crystal Lake Cemetery (Corvallis) Females Born Before 1900 Born After 1900 Males Born Before 1900 Born After")
13
Age Class f (x) d (x) l (x) q (x) Age Class f (x) d (x) l (x) q (x) 1121Y10001222 2161331 3161432 4261519 5241623 6201718 729188 826190 921200 10 210 1119 220 Total X ZW0.0
 d (x) l (x) q (x) Age Class f (x) d (x) l (x) q (x) 1121Y Total X ZW0.0")
16
Chapter # 10 – Population Growth (pg. 204 – 221) 10.3Different Life Tables Reflect Different Approaches to Defining Cohorts and Age Structure. Dynamic Life Table – Following the fate (cohort) of a group of individuals born at a given time (year). Time-specific Life Table – One sample period assumes: constant birth and death rates each cohort sample according to actual population proportions.
 10.3Different Life Tables Reflect Different Approaches to Defining Cohorts and Age Structure. Dynamic Life Table – Following the fate (cohort) of a group of individuals born at a given time (year). Time-specific Life Table – One sample period assumes: constant birth and death rates each cohort sample according to actual population proportions..")
17
Chapter # 10 – Population Growth (pg. 204 – 221) 10.4Life Tables Provide Data for Mortality and Survivorship Curves.
 10.4Life Tables Provide Data for Mortality and Survivorship Curves..")
18
Gray Squirrel (Sciurus carolinensis) Years and Months Stonecrop (Sedum smallii)
 Years and Months Stonecrop (Sedum smallii)")
19
Chapter # 10 – Population Growth (pg. 204 – 221) 10.4Life Tables Provide Data for Mortality and Survivorship Curves.
 10.4Life Tables Provide Data for Mortality and Survivorship Curves..")
20
Chapter # 10 – Population Growth (pg. 204 – 221) 10.4Life Tables Provide Data for Mortality and Survivorship Curves. Type I – when individuals live out their physiological life span followed by heavy mortality at the end (convex). ex. - large mammals and humans
 10.4Life Tables Provide Data for Mortality and Survivorship Curves. Type I – when individuals live out their physiological life span followed by heavy mortality at the end (convex). ex. - large mammals and humans.")
21
Chapter # 10 – Population Growth (pg. 204 – 221) 10.4Life Tables Provide Data for Mortality and Survivorship Curves. Type II – when survivorship rates do not vary with age (straight line). ex. – adult birds (some waterfowl and migratory songbirds, small mammals and reptiles.
 10.4Life Tables Provide Data for Mortality and Survivorship Curves. Type II – when survivorship rates do not vary with age (straight line). ex. – adult birds (some waterfowl and migratory songbirds, small mammals and reptiles..")
22
Chapter # 10 – Population Growth (pg. 204 – 221) 10.4Life Tables Provide Data for Mortality and Survivorship Curves. Type I – when mortality rates are extremely high early in life (concave). ex. – fish, invertebrates, plants (annual and perennial).
 10.4Life Tables Provide Data for Mortality and Survivorship Curves. Type I – when mortality rates are extremely high early in life (concave). ex. – fish, invertebrates, plants (annual and perennial)..")
23
Chapter # 10 – Population Growth (pg. 204 – 221) 10.6Birthrate and Survivorship Determine Net Reproductive Rate (R 0 ). Fecundity – the potential reproductive capacity of an organism or population. Net Reproductive Rate (R 0 ) – the average number of females that will be left (progeny) during a lifetime by a newborn female. If (R 0 ) is < 1.0, the population is decreasing. If (R 0 ) is = 1.0, the replacement. If (R 0 ) is > 1.0, the population is increasing.
 10.6Birthrate and Survivorship Determine Net Reproductive Rate (R 0 ). Fecundity – the potential reproductive capacity of an organism or population. Net Reproductive Rate (R 0 ) – the average number of females that will be left (progeny) during a lifetime by a newborn female. If (R 0 ) is < 1.0, the population is decreasing. If (R 0 ) is = 1.0, the replacement. If (R 0 ) is > 1.0, the population is increasing..")
24
Chapter # 10 – Population Growth (pg. 204 – 221) 10.7Age-Specific Mortality and Birthrates Can Be Used to Project Population Change.
 10.7Age-Specific Mortality and Birthrates Can Be Used to Project Population Change..")
25
Chapter # 10 – Population Growth (pg. 204 – 221) 10.7Age-Specific Mortality and Birthrates Can Be Used to Project Population Change. From such a projection table (life table) you can calculate the age distribution (stable or stationary) for each age class or cohort in the population and to project population growth ( λ - lambda ).
 10.7Age-Specific Mortality and Birthrates Can Be Used to Project Population Change. From such a projection table (life table) you can calculate the age distribution (stable or stationary) for each age class or cohort in the population and to project population growth ( λ - lambda )..")
26
Chapter # 10 – Population Growth (pg. 204 – 221) 10.8Stochastic Processes Can Influence Population Dynamics. Stochasticity – variation in a population from random effects within a season or time period (t). Demographic Stochasticity – variation in population growth/declining rates from random effects among individuals in survival and reproduction within a season or time period (t). Environmental Stochasticity – variation in population growth/declining rates from random effects arising from environmental factors or the occurrence of natural disasters such as fire, flood, and drought within a season or time period (t).
 10.8Stochastic Processes Can Influence Population Dynamics. Stochasticity – variation in a population from random effects within a season or time period (t). Demographic Stochasticity – variation in population growth/declining rates from random effects among individuals in survival and reproduction within a season or time period (t). Environmental Stochasticity – variation in population growth/declining rates from random effects arising from environmental factors or the occurrence of natural disasters such as fire, flood, and drought within a season or time period (t)..")
27
Chapter # 10 – Population Growth (pg. 204 – 221) 10.9A Variety of Fators Can Lead to Population Extinction. 1.Resource Shortage 2.Restoration/Reintroduction 3.Potential new competitors, predators, etc. (Human-assisted)
 10.9A Variety of Fators Can Lead to Population Extinction. 1.Resource Shortage 2.Restoration/Reintroduction 3.Potential new competitors, predators, etc. (Human-assisted).")
28
Chapter # 10 – Population Growth (pg. 204 – 221) 10.10Small Populations are Susceptible to Extinction. 1.Stochastic Effects. 2.Wide Dispersal/Small Populations may have trouble locating mates. 3.Allee Effect – a decline in reproduction or survival at low densities. 4.Genetic Drift – random change in gene frequency. 5.Inbreeding.
 10.10Small Populations are Susceptible to Extinction. 1.Stochastic Effects. 2.Wide Dispersal/Small Populations may have trouble locating mates. 3.Allee Effect – a decline in reproduction or survival at low densities. 4.Genetic Drift – random change in gene frequency. 5.Inbreeding..")
Similar presentations


/K>")


 # Surviving from Birth (I)>")

 1950. 2 Estimating Patterns of Survival Three main methods of estimation: Cohort life table Identify individuals.>")


 Population Size (usually estimated)>")
