Download presentation
Presentation is loading. Please wait.

1
AF ablation with 3D mapping: our technique and results
Dr Dhiraj Gupta MRCP MD DM Liverpool Heart and Chest Hospital Northern UK AF experts Best Practice meeting Langdale Hotel, Cumbria 5 Feb 2010

2
Schema Our approach to AF ablation at LHCH Our reasons for each step
Our in-lab and follow-up results

3
Our approach in a nutshell
PVAI with Wide area circumferential ablation CT image integration using CARTO Individualised lesion set prescription Aim to ablate out of AF, ideally to SR Procedure duration limit of 5 hours

4
CT image registration Critical part of the process 2 steps
Single point Landmark registration Surface Registration with Fast Anatomical Mapping Takes 5-10 minutes

5
CT image segmentation

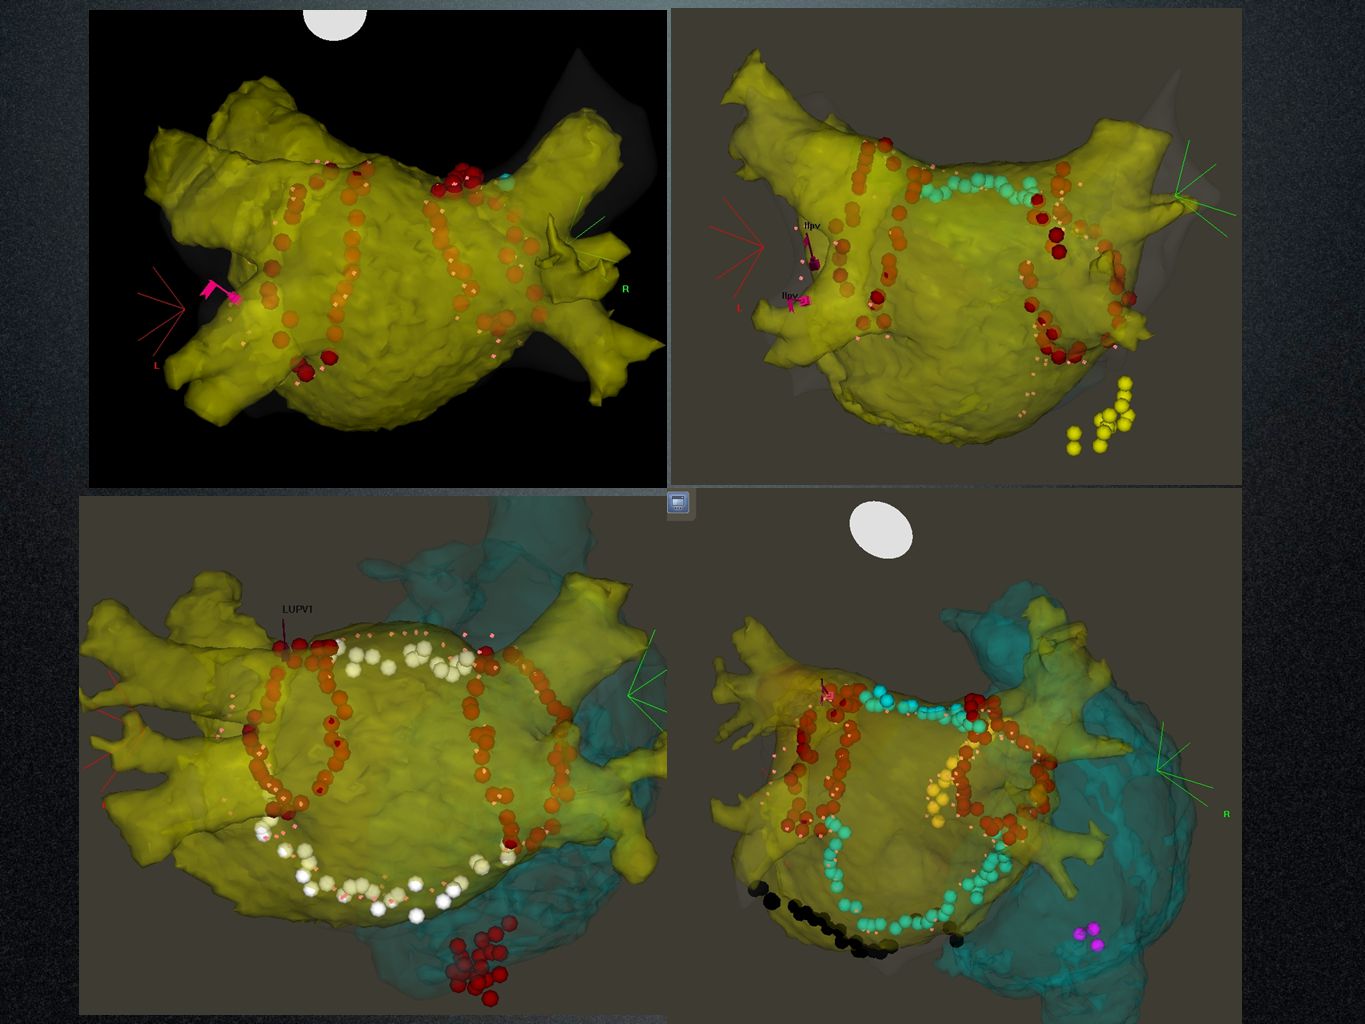
6
Fast Anatomical Map creation

7
Image Surface registration

8
Why the individualised approach?
Heterogeneity amongst AF population Trigger removal vs Substrate Modification Aim to achieve high single procedure success rates Incremental risk with multiple procedures That’s what the patient wants That’s what the health economists want!

9
Patient selection criteria
Patients not offered Catheter ablation if Very long standing Persistent AF (>3 years) Very large LA (>5.5 cm) Morbid Obesity (BMI >40), Sleep Apnea Significant RA dilatation (>LA) Patients not offered first redo at least for 6 months Not offered Second redo if still in PsAF
 Very large LA (>5.5 cm) Morbid Obesity (BMI >40), Sleep Apnea. Significant RA dilatation (>LA) Patients not offered first redo at least for 6 months. Not offered Second redo if still in PsAF.")
10
Not all AF patients are the same
True PAF Short lived episodes, short history, normal sized LA Sustained PAF: 2 or more of the following AF episodes>24 hours, History of AF > 5 years, LA size >4.5 cm, Age >65 years, Documented flutter, High AF burden (most days) Persistent AF Long standing Persistent AF (>12 months)
 Persistent AF. Long standing Persistent AF (>12 months)")
11
Minimum RF Lesion set True PAF PVAI using WACA Sustained PAF
+ LA roof line + RA flutter line Persistent AF + LA floor line + Mitral isthmus line Long standing Persistent AF + Epicardial CS ablation+ CAFÉ ablation

12
Paroxysmal PAF

13
Sustained PAF

14
Persistent AF

15
Long standing Persistent AF

16
Surgical Maze for ‘Permanent AF’
Still the Gold standard in terms of results 96% free of AF at 5 years* * SM Prasad et al, J Thorac Cardiovasc Surg 2003; 126:

17
Results with ‘Catheter Maze’
N Redo AAD therapy Results Complications Haissaguerre JCE 2005 60 1/2 Stopped at ablation 95% at 11 months 2 Tamponades Oral NEJM 2006 77 1/3 Amio 6/52 pre & 3/12 post 77% at 1 year Postch Circ 2008 88 81% at 20 months 1 TIA Lo JCE 2009 87 1/4 AAD for 2/12 post 79% at 21 months 1 Tamponade

19
Why CT image integration?
Forewarned is forearmed: PV anatomical variations Common Left Pulmonary Vein Additional pulmonary vein(s) Important anatomical information thickness of the LAA ridge, intervenous carina extent of the PV antra length of the mitral isthmus
 Important anatomical information. thickness of the LAA ridge, intervenous carina. extent of the PV antra. length of the mitral isthmus.")
22
Why CT image integration?
Dramatically reduces procedural fluoro times: <10 minutes for PAF cases 10-20 minutes for PsAF cases Decreases fatigue Removes ‘the fear of the unknown’….. Demystifies AF ablation for the nurses/ radiographers!

26
Why CARTO rather than ESI?
Unmatched catheter stability no catheter ‘dive’ with onset of RF delivery Allows linear lesions No need for stable intracardiac reference Ability to perform activation mapping if needed Great CT image integration software

27
Advances with CARTO-3 Hybrid of impedance and magnetic catheter location Ability to see all catheters Ability to create fast anatomical maps Makes CT image integration easier More streamlined patient set-up

28
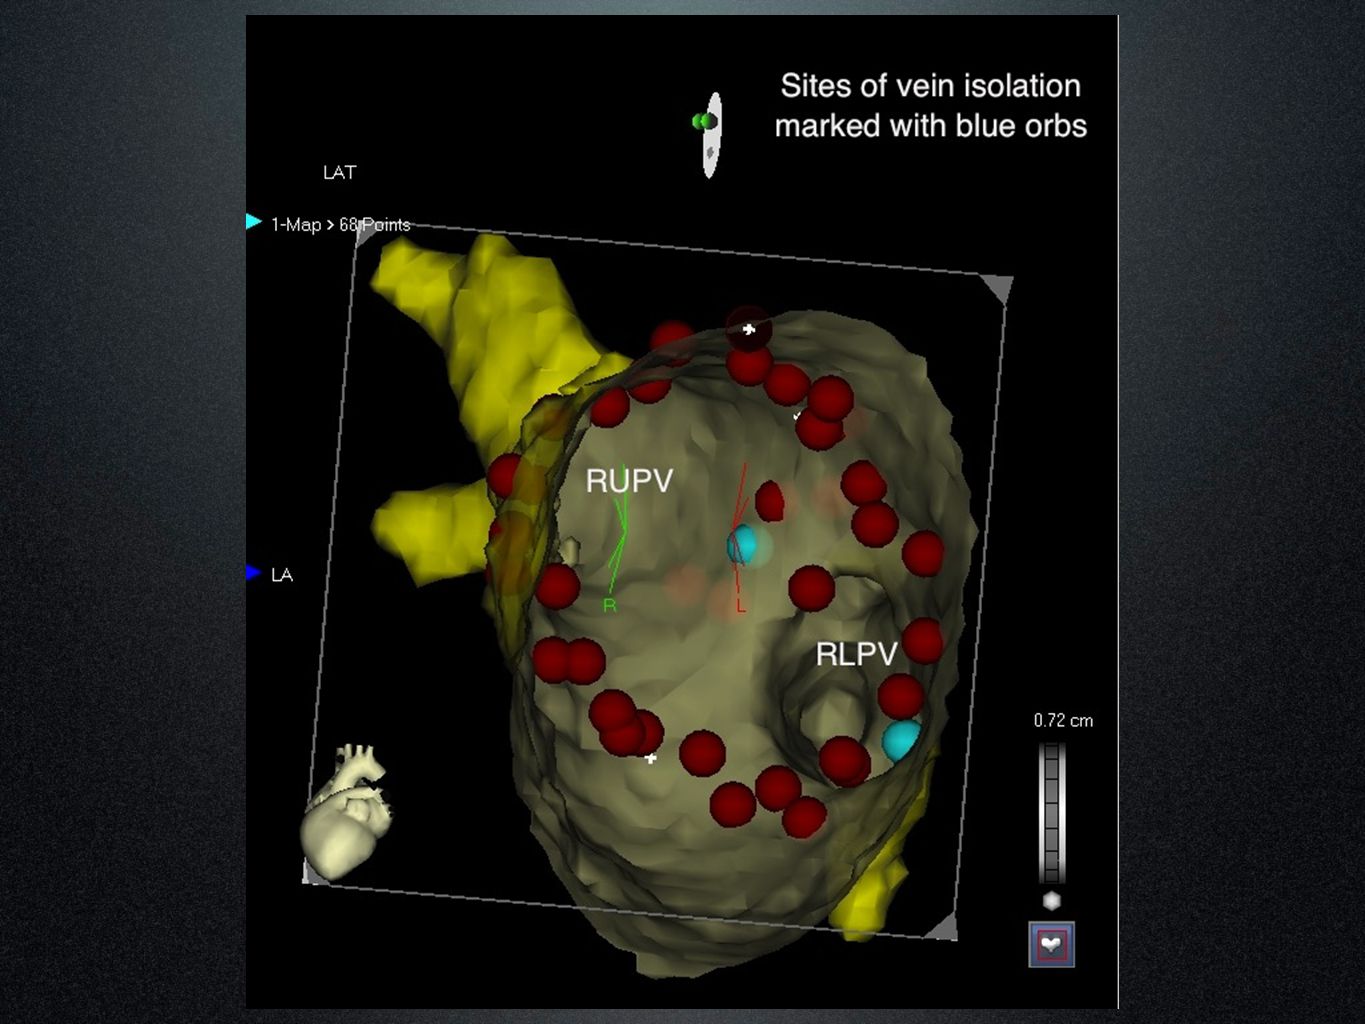
Why WACA? PV ostial/ antral triggers
Substrate modification by Atrial debulking Less risk of PV stenosis Quicker than segmental PVI Easy to anchor linear lesions on either side ‘Et tu, Bordeaux?!’

29
Why our RF settings? Continuous RF: 35 W, 50°C, 10 ml/ min flow
Quicker signal obliteration than 30/25 W Short procedure time (20-30’ per WACA) Prevents peri-lesion edema (? reconnection risk) RF controlled by Foot pedal Frees up a cardiac physiologist Imposes discipline on use of X-ray pedal!
 Prevents peri-lesion edema ( reconnection risk) RF controlled by Foot pedal. Frees up a cardiac physiologist. Imposes discipline on use of X-ray pedal!")
30
131 consecutive pts. between Jan 08-July 09
Our results 131 consecutive pts. between Jan 08-July 09

31
Individualised ablation strategy
True PAF (n=45) PVAI using WACA Sustained PAF (n=31) + LA roof line+ RA flutter line Ps AF (n=22) + LA floor line+ Mitral isthmus line Long standing Ps AF (n=33) + Epicardial CS ablation+ CAFÉ ablation
 PVAI using WACA. Sustained PAF (n=31) + LA roof line+ RA flutter line. Ps AF (n=22) + LA floor line+ Mitral isthmus line. Long standing Ps AF (n=33) + Epicardial CS ablation+ CAFÉ ablation.")
32
In-lab results All patients received prescribed minimum lesion set
Mean Procedure time 173 min (98-300) Fluoroscopy times Mean 26.5 min (13-58) (as pre-CARTO 3 era) Now with CARTO-3 (n=36): Mean 14 min (6-21) Complications 1 tamponade (PVI group), 1 AV fistula
 Fluoroscopy times. Mean 26.5 min (13-58) (as pre-CARTO 3 era) Now with CARTO-3 (n=36): Mean 14 min (6-21) Complications. 1 tamponade (PVI group), 1 AV fistula.")
33
Our follow-up strategy
Antiarrhythmic drug therapy for 2-3 months Early post-op arrhythmias DC CV if sustained and poorly tolerated (n=1) No redo ablation procedure for at least 6 months Mean follow up 11.3 months (6-24)
 No redo ablation procedure for at least 6 months. Mean follow up 11.3 months (6-24)")
34
Our Clinical Results Definition of Procedural Success:
No symptoms beyond 3 months, AND Absence of AF/AT on 24 hour Holter at 6 mo Single procedure success rates at 6 months PAF 84% PsAF 86% Sustained PAF 77% (p=0.05) Long standing PsAF 64% (p<0.001)
 Long standing PsAF 64% (p<0.001)")
35
Conclusions Single procedure success should be the goal
Most patients need substrate modification in addition to trigger removal This needs application of linear lesions 3D mapping guided ablation the gold standard

36
Acknowledgements to Dr Richard Schilling, my mentor and guide
Thank You

Similar presentations


 patients Policy.>")


 Barker D, Patwala A, Damm E, Hall M, Snowdon R, Gupta D Liverpool Heart and Chest.>")


>")


 Trial Presented at The American College of Cardiology Scientific Session 2006 Presented by Dr. Carlo.>")
