Download presentation
Presentation is loading. Please wait.

1
4 Elasticity Notes and teaching tips: 9, 27, 42, 43, 49, and 63.
CHAPTER Elasticity Notes and teaching tips: 9, 27, 42, 43, 49, and 63. To view a full-screen figure during a class, click the red “expand” button. To return to the previous slide, click the red “shrink” button. To advance to the next slide, click anywhere on the full screen figure.

2
After studying this chapter you will be able to
Define, calculate, and explain the factors that influence the price elasticity of demand Define, calculate, and explain the factors that influence the cross elasticity of demand and the income elasticity of demand Define, calculate, and explain the factors that influence the elasticity of supply

3
When Prices Tumble, Does Revenue Grow?
The personal computer industry is operating in fiercely competitive conditions. The prices of notebook have fallen to less than $1,000. The prices of desktops have fallen to less than $500. How did the revenues of computer producers change? Might revenue still grow? The concept of elasticity helps to answer these questions.

4
Price Elasticity of Demand
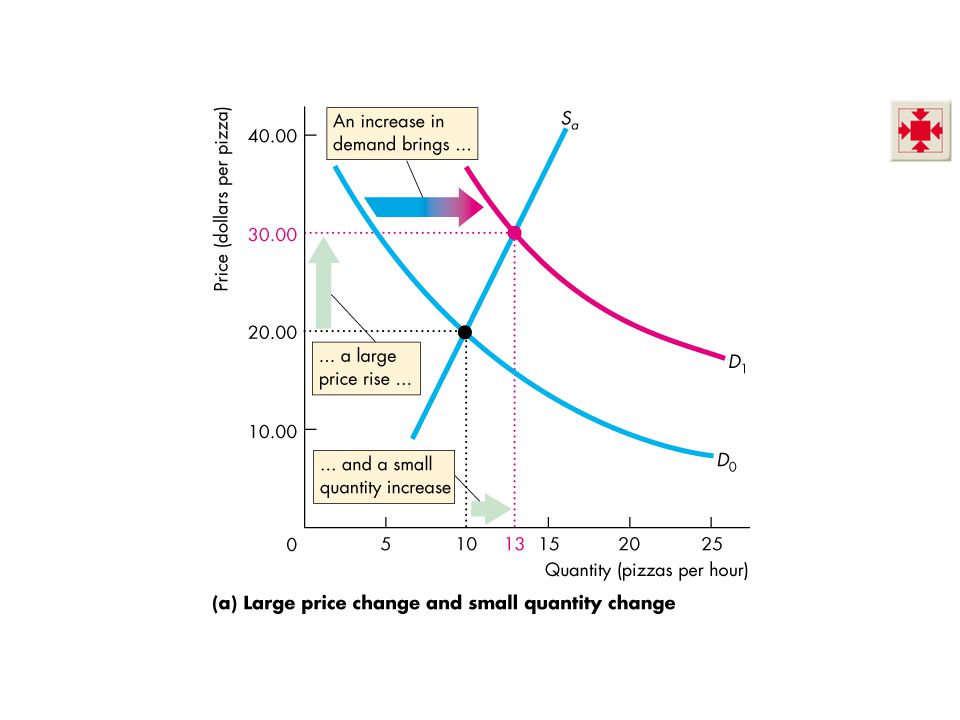
In Figure 4.1(a), an increase in supply brings A large fall in price A small increase in the quantity demanded
, an increase in supply brings. A large fall in price. A small increase in the quantity demanded.")
6
Price Elasticity of Demand
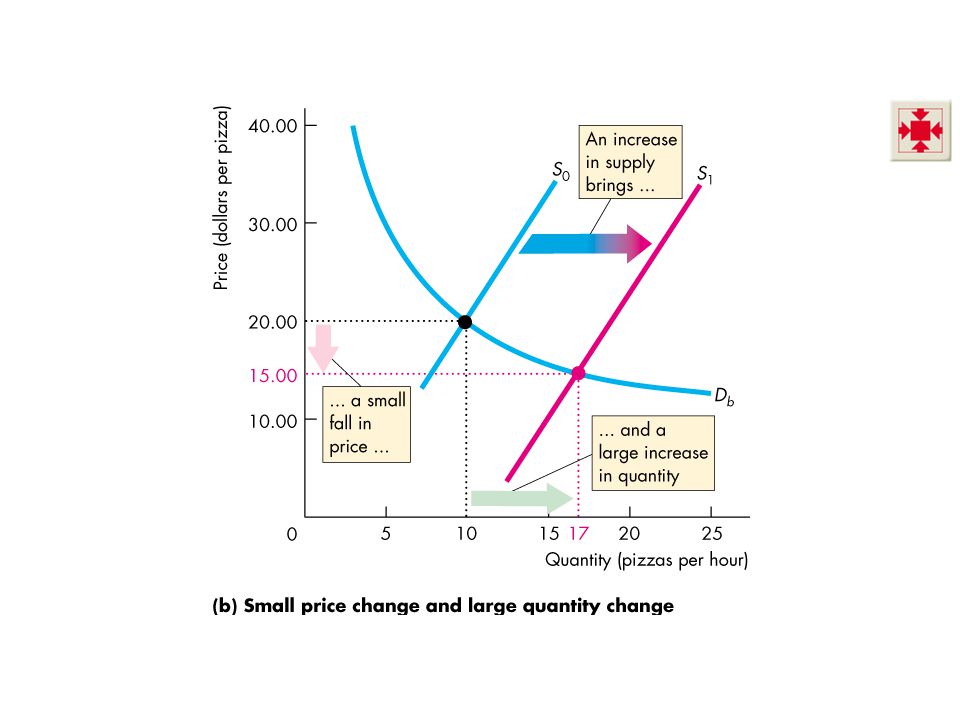
In Figure 4.1(b), an increase in supply brings A small fall in price A large increase in the quantity demanded
, an increase in supply brings. A small fall in price. A large increase in the quantity demanded.")
8
Price Elasticity of Demand
The contrast between the two outcomes in Figure 4.1 highlights the need for A measure of the responsiveness of the quantity demanded to a price change. The price elasticity of demand is a units-free measure of the responsiveness of the quantity demanded of a good to a change in its price when all other influences on buyers’ plans remain the same.

9
Price Elasticity of Demand
Calculating Elasticity The price elasticity of demand is calculated by using the formula: Percentage change in quantity demanded Percentage change in price Percentages and percentage changes. Many students need a refresher and some practice at doing what seems too simple to bother with, calculating percentages and percentage changes. Don’t be afraid to start with this pre-elasticity warm up. Just toss out some numbers. Suppose that the campus bookstore increases the price of an economics text from $70 to $80. What is the percentage increase in price? Suppose the campus computer store lowers the price of an iMac from $1500 to $1000. What is the percentage decrease in price? Next, tell them the prices have moved in the opposite directions: The campus book store cuts the price of an economics text from $80 to $70. What is the percentage decrease in price? And the campus computer store now raises the price of an iMac from $1000 to $1500. What is the percentage increase in price? You’re now all set to get the students using the average of the original and new price to calculate percentages that are independent of the direction of change. Many students have a hard time remembering whether quantity or price goes in the numerator of the elasticity formulas. Have the students create their own mnemonic. Suggest McDonald’s Big Mac™ hamburgers. It’s silly, but it works, reminding the student that Q (quantity) appears before P (price) in the ratio of percentage changes. For practice at calculating the price elasticity of demand, bring out your demand schedule for Coke (or other drink) that you sold in class when you covered demand. Get the students to calculate the price elasticity of demand at various points along that demand curve.
 appears before P (price) in the ratio of percentage changes. For practice at calculating the price elasticity of demand, bring out your demand schedule for Coke (or other drink) that you sold in class when you covered demand. Get the students to calculate the price elasticity of demand at various points along that demand curve.")
10
Price Elasticity of Demand
To calculate the price elasticity of demand: We express the change in price as a percentage of the average price—the average of the initial and new price, and we express the change in the quantity demanded as a percentage of the average quantity demanded—the average of the initial and new quantity.

11
Price Elasticity of Demand
Figure 4.2 calculates the price elasticity of demand for pizza. The price initially is $20.50 and the quantity demanded is 9 pizzas an hour.

13
Price Elasticity of Demand
The price falls to $19.50 and the quantity demanded increases to 11 pizzas an hour. The price falls by $1 and the quantity demanded increases by 2 pizzas an hour.

14
Price Elasticity of Demand
The average price is $20 and the average quantity demanded is 10 pizzas an hour.

15
Price Elasticity of Demand
The percentage change in quantity demanded, %DQ, is calculated as DQ/Qave, which is 2/10 = 1/5. The percentage change in price, %DP, is calculated as DP/Pave, which is $1/$20 = 1/20.

16
Price Elasticity of Demand
The price elasticity of demand is %DQ/ %DP = (1/5)/(1/20) = 20/5 = 4.
/(1/20) = 20/5. = 4.")
17
Price Elasticity of Demand
By using the average price and average quantity, we get the same elasticity value regardless of whether the price rises or falls. The ratio of two proportionate changes is the same as the ratio of two percentage changes. The measure is units free because it is a ratio of two percentage changes and the percentages cancel out. Changing the units of measurement of price or quantity leave the elasticity value the same.

18
Price Elasticity of Demand
The formula yields a negative value, because price and quantity move in opposite directions. But it is the magnitude, or absolute value, of the measure that reveals how responsive the quantity change has been to a price change.

19
Price Elasticity of Demand
Inelastic and Elastic Demand Demand can be inelastic, unit elastic, or elastic, and can range from zero to infinity. If the quantity demanded doesn’t change when the price changes, the price elasticity of demand is zero and the good as a perfectly inelastic demand.

20
Price Elasticity of Demand
Figure 4.3(a) illustrates the case of a good that has a perfectly inelastic demand. The demand curve is vertical.
 illustrates the case of a good that has a perfectly inelastic demand. The demand curve is vertical.")
22
Price Elasticity of Demand
If the percentage change in the quantity demanded equals the percentage change in price, the price elasticity of demand equals 1 and the good has unit elastic demand. Figure 4.3(b) illustrates this case—a demand curve with ever declining slope.
 illustrates this case—a demand curve with ever declining slope.")
24
Price Elasticity of Demand
If the percentage change in the quantity demanded is smaller than the percentage change in price, the price elasticity of demand is less than 1 and the good has inelastic demand. If the percentage change in the quantity demanded is greater than the percentage change in price, the price elasticity of demand is greater than 1 and the good has elastic demand.

25
Price Elasticity of Demand
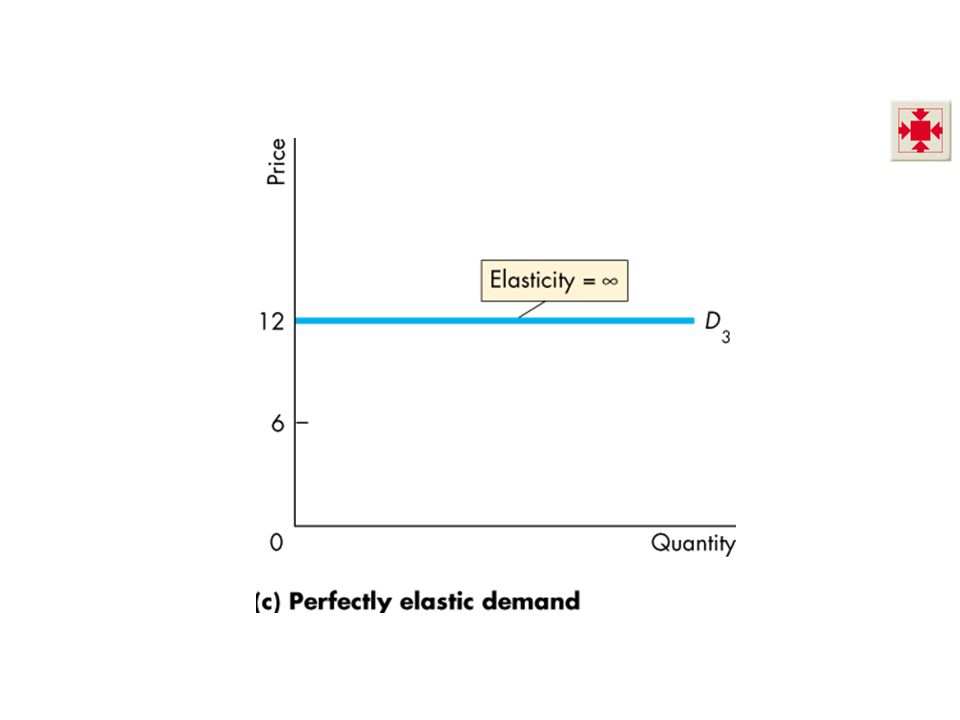
If the percentage change in the quantity demanded is infinitely large when the price barely changes, the price elasticity of demand is infinite and the good has a perfectly elastic demand. Figure 4.3(c) illustrates the case of perfectly elastic demand—a horizontal demand curve.
 illustrates the case of perfectly elastic demand—a horizontal demand curve.")
27
Price Elasticity of Demand
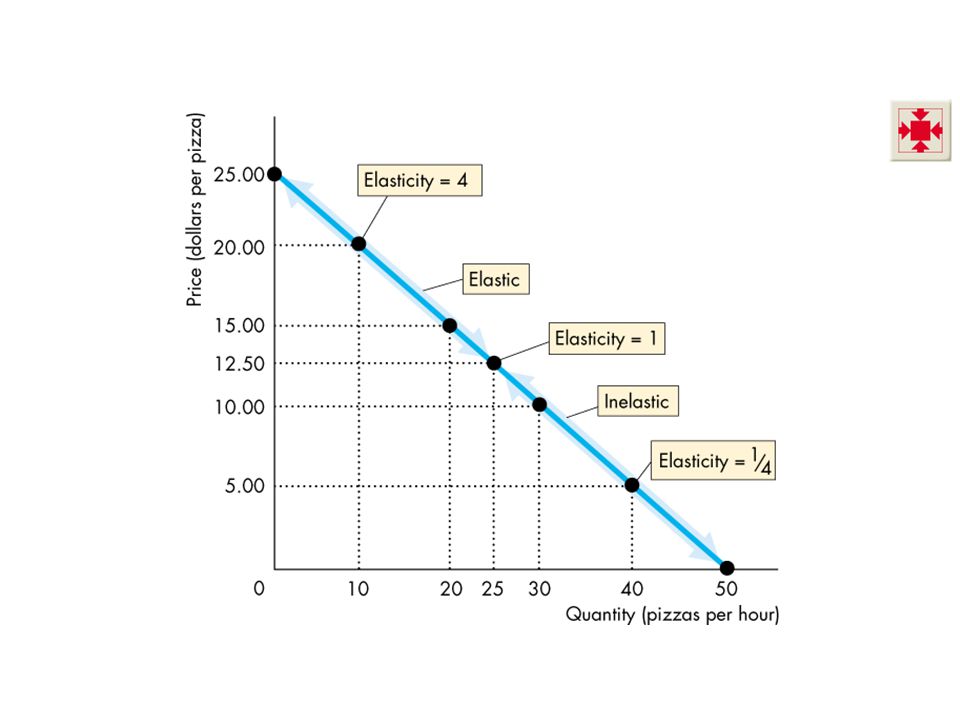
Elasticity Along a Straight-Line Demand Curve Figure 4.4 shows how demand becomes less elastic as the price falls along a linear demand curve. Elasticity and slope along a linear demand curve. You can provide solid intuition on why the elasticity of demand falls as we move down a linear demand curve. Point out first that as the quantity increases, the percentage change in quantity decreases for equal changes in quantity. Do two calculations, one at a small quantity and one at a large quantity. Then point out that this same reasoning applies to the price. As the price falls, the percentage change in price increases for equal changes in price. Again, do two calculations, one at a high price and one at a low price. Now put the two together. As we move downward along the demand curve, the percentage change in quantity is getting smaller and the percentage change in price is getting larger, so the elasticity—the ratio of the percentage change in quantity to the percentage change in price—is getting smaller.

29
Price Elasticity of Demand
At prices above the mid-point of the demand curve, demand is elastic. At prices below the mid-point of the demand curve, demand is inelastic.

30
Price Elasticity of Demand
For example, if the price falls from $25 to $15, the quantity demanded increases from 0 to 20 pizzas an hour. The average price is $20 and the average quantity is 10. The price elasticity of demand is (20/10)/(10/20), which equals 4.
/(10/20), which equals 4.")
31
Price Elasticity of Demand
If the price falls from $10 to $0, the quantity demanded increases from 30 to 50 pizzas an hour. The average price is $5 and the average quantity is 40. The price elasticity of demand is (20/40)/(10/5), which equals 1/4.
/(10/5), which equals 1/4.")
32
Price Elasticity of Demand
If the price falls from $15 to $10, the quantity demanded increases from 20 to 30 pizzas an hour. The average price is $12.50 and the average quantity is 25. The price elasticity of demand is (10/25)/(5/12.5), which equals 1.
/(5/12.5), which equals 1.")
33
Price Elasticity of Demand
Total Revenue and Elasticity The total revenue from the sale of good or service equals the price of the good multiplied by the quantity sold. When the price changes, total revenue also changes. But a rise in price doesn’t always increase total revenue.

34
Price Elasticity of Demand
The change in total revenue due to a change in price depends on the elasticity of demand: If demand is elastic, a 1 percent price cut increases the quantity sold by more than 1 percent, and total revenue increases. If demand is inelastic, a 1 percent price cut decreases the quantity sold by more than 1 percent, and total revenues decreases. If demand is unitary elastic, a 1 percent price cut increases the quantity sold by 1 percent, and total revenue remains unchanged.

35
Price Elasticity of Demand
The total revenue test is a method of estimating the price elasticity of demand by observing the change in total revenue that results from a price change (when all other influences on the quantity sold remain the same). If a price cut increases total revenue, demand is elastic. If a price cut decreases total revenue, demand is inelastic. If a price cut leaves total revenue unchanged, demand is unit elastic.
. If a price cut increases total revenue, demand is elastic. If a price cut decreases total revenue, demand is inelastic. If a price cut leaves total revenue unchanged, demand is unit elastic.")
36
Price Elasticity of Demand
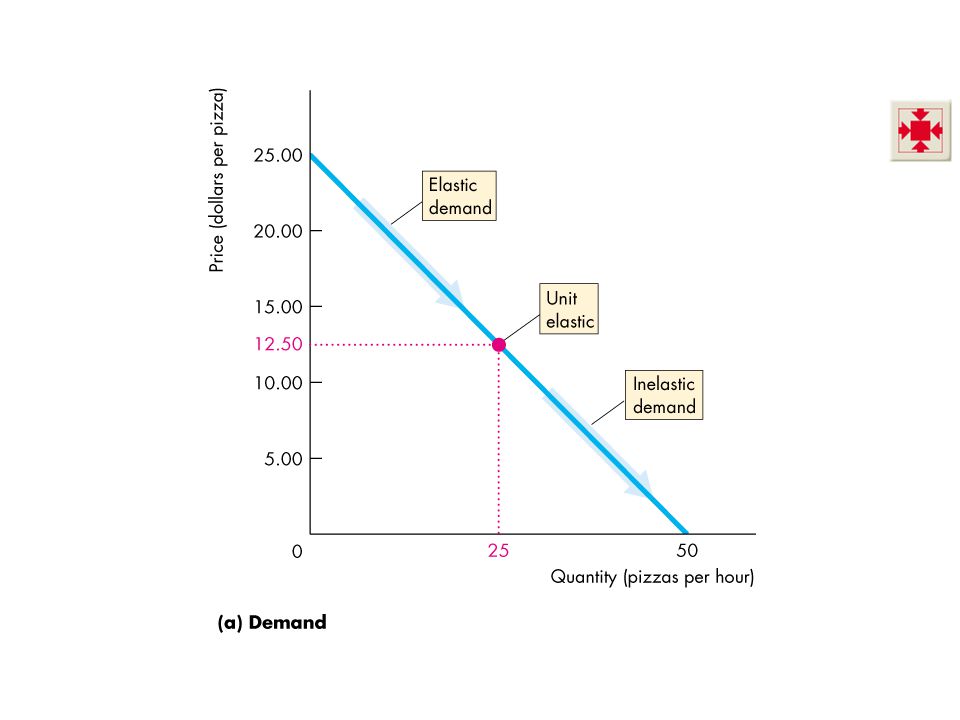
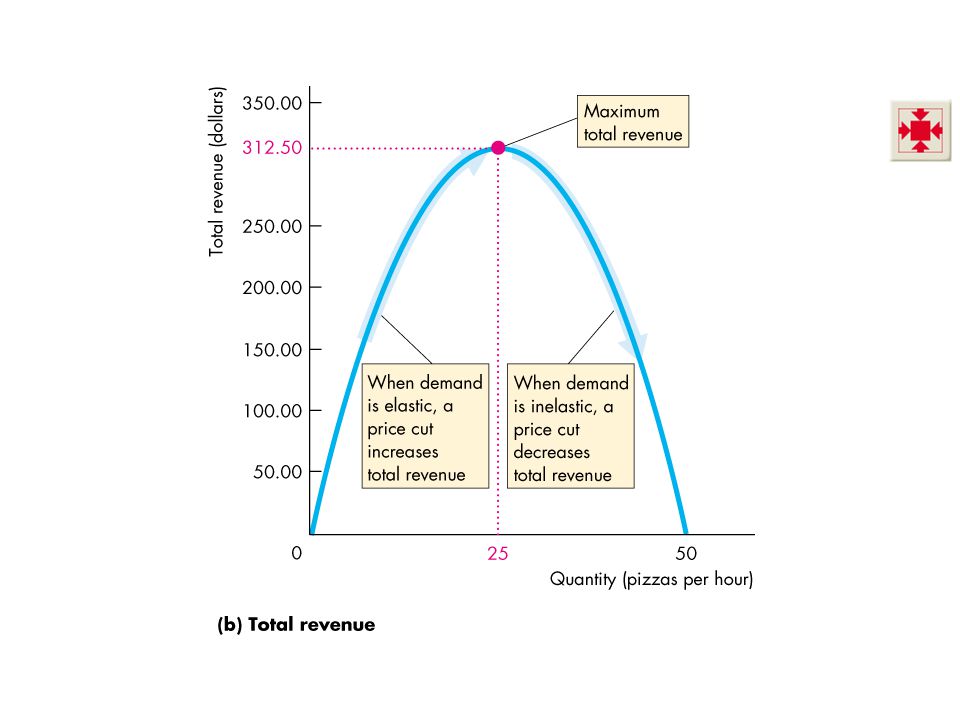
Figure 4.5 shows the relationship between elasticity of demand and the total revenue. As the price falls from $25 to $12.50, the quantity demanded increases from 0 to 25. Demand is elastic, and total revenue increases.

38
Price Elasticity of Demand
In part (b), as the quantity increases from 0 to 25, demand is elastic, and total revenue increases.
, as the quantity increases from 0 to 25, demand is elastic, and total revenue increases.")
40
Price Elasticity of Demand
At $12.50, demand is unit elastic and total revenue stops increasing. As the price falls from $12.50 to zero, the quantity demanded increases from 25 to 50. Demand is inelastic, and total revenue decreases.

41
Price Elasticity of Demand
At 25, demand is unit elastic, and total revenue is at its maximum. As the quantity increases from 25 to 50, demand is inelastic, and total revenue decreases.

42
Price Elasticity of Demand
Your Expenditure and Your Elasticity If your demand is elastic, a 1 percent price cut increases the quantity you buy by more than 1 percent and your expenditure on the item increases. If your demand is inelastic, a 1 percent price cut increases the quantity you buy by less than 1 percent and your expenditure on the item decreases. If your demand is unit elastic, a 1 percent price cut increases the quantity you buy by 1 percent and your expenditure on the item does not change. Encourage your students to use the total revenue test (total expenditure) to check whether their demand for some item the price of which has changed, is elastic or inelastic.
 to check whether their demand for some item the price of which has changed, is elastic or inelastic.")
43
Price Elasticity of Demand
The Factors That Influence the Elasticity of Demand The elasticity of demand for a good depends on: The closeness of substitutes The proportion of income spent on the good The time elapsed since a price change Fuel for thought: Getting some intuition on what determines whether demand is inelastic or elastic The demand for gasoline and junk food in general. Students love their cars and junk food, and they know that the demand for both in general is inelastic because there are no good substitutes for personal transportation and a quick snack. The demand for Joe’s quick-mart gasoline. Ask your students if Joe’s quick-mart (substitute your actual local one) convenience store would lose much business and total revenues if he raised the price of gasoline more than a penny or two compared to the other three gas stations at a street intersection. When the students conclude he’d lose much of his gasoline sales ask them to reconcile this large quantity decrease to a small increase in price (elastic demand) with the fact that they earlier stated that demand for gasoline is very inelastic. They will recognize that gasoline from other corner stations is a very good substitute for Joe’s gasoline. The demand for Joe’s quick-mart junk food. After students recognize that abundant substitute availability keeps elasticity high, ask the students why Joe’s junk food (and all quick-mart stores’ junk food) is priced so much higher than the near-by grocery store’s junk food. Students will conclude that “convenience” stores are well named. Most people aren’t willing to wait in the grocery store check-out line behind the frazzled mother of three screaming kids, each hanging on the over-loaded basket that will take 15 minutes of coupon validating and price checking to check out. The grocery store is not a good substitute for people on the go looking for a fast snack and a quick gas fill.
 convenience store would lose much business and total revenues if he raised the price of gasoline more than a penny or two compared to the other three gas stations at a street intersection. When the students conclude he’d lose much of his gasoline sales ask them to reconcile this large quantity decrease to a small increase in price (elastic demand) with the fact that they earlier stated that demand for gasoline is very inelastic. They will recognize that gasoline from other corner stations is a very good substitute for Joe’s gasoline. The demand for Joe’s quick-mart junk food. After students recognize that abundant substitute availability keeps elasticity high, ask the students why Joe’s junk food (and all quick-mart stores’ junk food) is priced so much higher than the near-by grocery store’s junk food. Students will conclude that convenience stores are well named. Most people aren’t willing to wait in the grocery store check-out line behind the frazzled mother of three screaming kids, each hanging on the over-loaded basket that will take 15 minutes of coupon validating and price checking to check out. The grocery store is not a good substitute for people on the go looking for a fast snack and a quick gas fill.")
44
Price Elasticity of Demand
Closeness of substitutes The closer the substitutes for a good or service, the more elastic are the demand for it. Necessities, such as food or housing, generally have inelastic demand. Luxuries, such as exotic vacations, generally have elastic demand. Proportion of income spent on the good The greater the proportion of income consumers spent on a good, the larger is its elasticity of demand.

45
Price Elasticity of Demand
Time Elapsed Since Price Change The more time consumers have to adjust to a price change, or the longer that a good can be stored without losing its value, the more elastic is the demand for that good.

46
Price Elasticity of Demand
Table 4.1 (page 89) shows estimates of the price elasticity of demand for various goods and services. Figure 4.6 shows how the elasticity of demand for food varies with the proportion of income spent on food in different countries.
 shows estimates of the price elasticity of demand for various goods and services. Figure 4.6 shows how the elasticity of demand for food varies with the proportion of income spent on food in different countries.")
48
More Elasticities of Demand
Cross Elasticity of Demand The cross elasticity of demand is a measure of the responsiveness of demand for a good to a change in the price of a substitute or a complement, other things remaining the same. The formula for calculating the cross elasticity is: Percentage change in quantity demanded Percentage change in price of substitute or complement

49
More Elasticities of Demand
The cross elasticity of demand for a substitute is positive. The cross elasticity of demand for a complement is negative. Emphasize the information content in the algebraic sign of the cross elasticity and the income elasticity and contrast this situation with the price elasticity for which we focus only on the magnitude and not the sign.

50
More Elasticities of Demand
Figure 4.7 shows the increase in the quantity of pizza demanded when the price of burger (a substitute for pizza) rises. The figure also shows the decrease in the quantity of pizza demanded when the price of a soft drink (a complement of pizza) rises.
 rises. The figure also shows the decrease in the quantity of pizza demanded when the price of a soft drink (a complement of pizza) rises.")
52
More Elasticities of Demand
Income Elasticity of Demand The income elasticity of demand measures how the quantity demanded of a good responds to a change in income, other things remaining the same. The formula for calculating the income elasticity of demand is Percentage change in quantity demanded Percentage change in income

53
More Elasticities of Demand
If the income elasticity of demand is greater than 1, demand is income elastic and the good is a normal good. If the income elasticity of demand is greater than zero but less than 1, demand is income inelastic and the good is a normal good. If the income elasticity of demand is less than zero (negative) the good is an inferior good.
 the good is an inferior good.")
54
More Elasticities of Demand
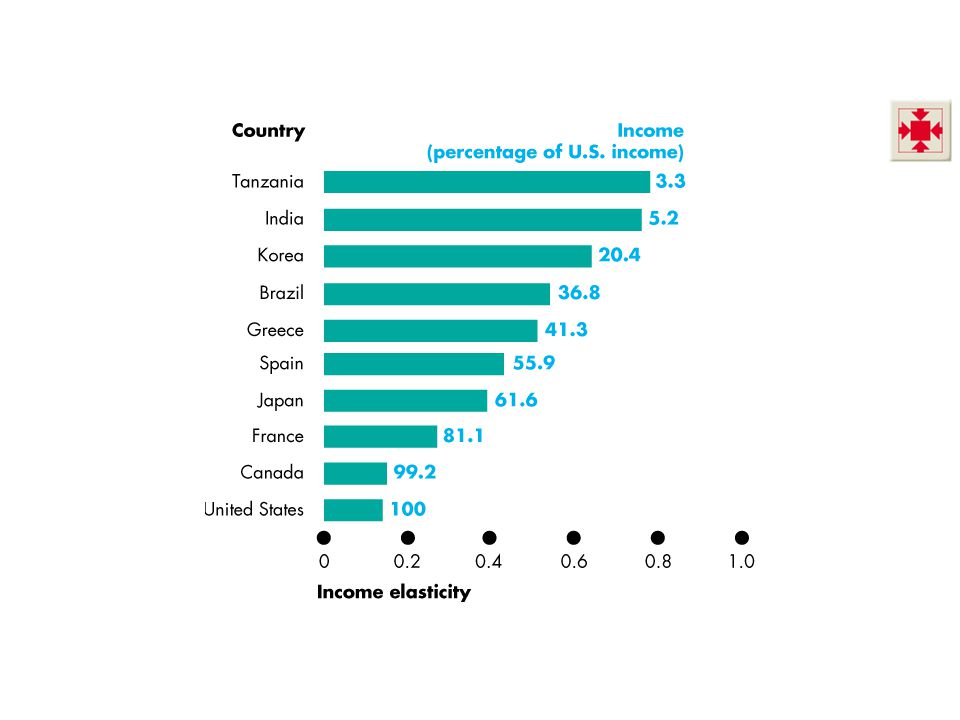
Table 4.2 (page 93) shows estimates of income elasticity of demand for various goods and services. Figure 4.8 shows estimates of the income elasticity for food in different countries. A higher average income is associated with a lower income elasticity of demand for food.
 shows estimates of income elasticity of demand for various goods and services. Figure 4.8 shows estimates of the income elasticity for food in different countries. A higher average income is associated with a lower income elasticity of demand for food.")
56
Elasticity of Supply In Figure 4.9(a), an increase in demand brings
A large rise in price A small increase in the quantity supplied

58
Elasticity of Supply In Figure 4.9(b), an increase in demand brings
A small rise in price A large increase in the quantity supplied

60
Elasticity of Supply The contrast between the two outcomes in Figure 4.9 highlights the need for A measure of the responsiveness of the quantity supplied to a price change. The elasticity of supply measures the responsiveness of the quantity supplied to a change in the price of a good when all other influences on selling plans remain the same.

61
Elasticity of Supply Calculating the Elasticity of Supply
The elasticity of supply is calculated by using the formula: Percentage change in quantity supplied Percentage change in price

62
Elasticity of Supply Figure 4.10 on the next slide shows three cases of the elasticity of supply. Supply is perfectly inelastic if the supply curve is vertical and the elasticity of supply is 0. Supply is unit elastic if the supply curve is linear and passes through the origin. (Note that slope is irrelevant.) Supply is perfectly elastic if the supply curve is horizontal and the elasticity of supply is infinite.
 Supply is perfectly elastic if the supply curve is horizontal and the elasticity of supply is infinite.")
63
Elasticity of Supply The unit elastic demand curve is a good one to use to emphasize that elasticity and slope are not equal. Have the students calculate the elasticity of supply on two linear demand curves that passes through the origin, one with a slope of 0.5 and the other with a slope of 2. They’ll get the message.

67
Elasticity of Supply The Factors That Influence the Elasticity of Supply The elasticity of supply depends on Resource substitution possibilities Time frame for supply decision Resource Substitution Possibilities The easier it is to substitute among the resources used to produce a good or service, the greater is its elasticity of supply.

68
Elasticity of Supply Time Frame for Supply Decision
The more time that passes after a price change, the greater is the elasticity of supply. Momentary supply is perfectly inelastic. The quantity supplied immediately following a price change is constant. Short-run supply is somewhat elastic. Long-run supply is the most elastic. Table 4.3 (page 97) provides a glossary of the all elasticity measures.
 provides a glossary of the all elasticity measures.")
69
THE END

Similar presentations


 with respect to changes in its own price (or income or the price.>")


