Download presentation
Presentation is loading. Please wait.

1
PERTTI LAITINEN NORTH KARELIA UNIVERSITY OF APPLIED SCIENCES Future Finance

5
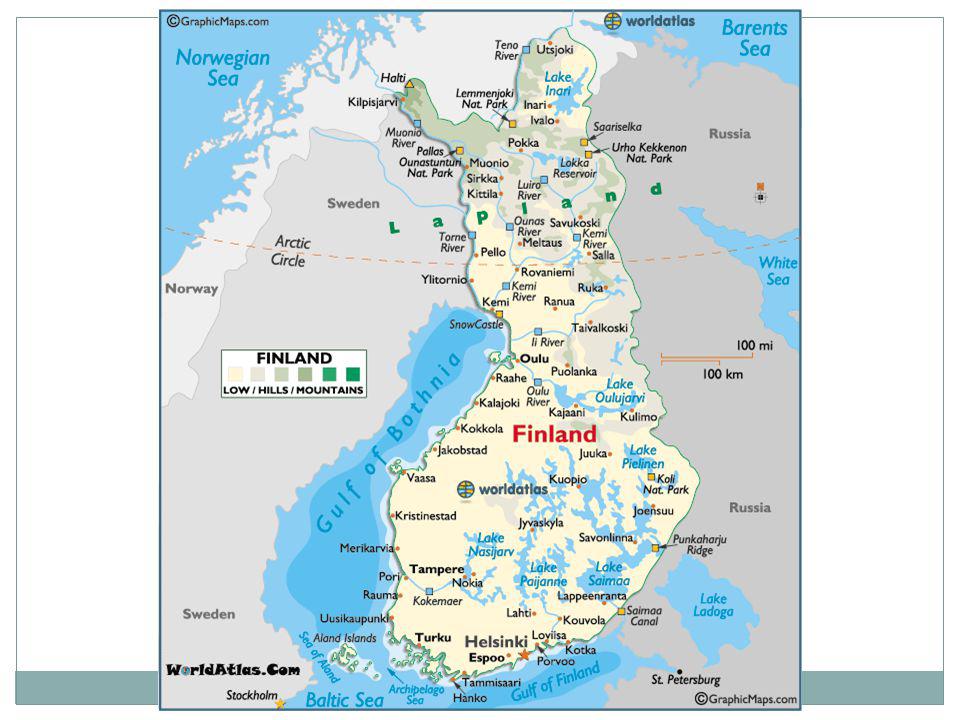
Demographics The population of Finland is currently about 5,400,000. Finland has an average population density of 16 inhabitants per square kilometer. This is the third-lowest population density of any European country. Finland's population has always been concentrated in the southern parts of the country, a phenomenon that became even more pronounced during 20th-century urbanization. The share of foreign citizens in Finland is 2.5%, among the lowest in the European Union. Most of them are from Russia, Estonia and Sweden.

6
Definition of 'Okun's Law' The relationship between an economy's unemployment rate and its gross national product (GNP). Twentieth-century economist Arthur Okun developed this idea, which states that when unemployment falls by 1%, GNP rises by 3%. Other version of Okun's Law focus on a relationship between unemployment and GDP, whereby a percentage increase in unemployment causes a 2% fall in GDP. (Investopedia 2013)
.")
7
Workers(henkilöstö) Production (tuotanto)
 Production (tuotanto)")
8
Gross national product in Finland 1979-2012

9
Major factors affecting income distribution Economical Neoclassical explanations Natural laws, technological change, relative productivities, capital-labor substitution Globalization and relative trade prices (Stolper and Samuelson 1941) (Giovannoni 2010, 7)
 (Giovannoni 2010, 7)")
10
Economical demand based explanations Investment rate (Kaldor 1956) Unemployment (Goodwin 1967) Monopoly power, labor power, policies (Kalecki 1938) (Giovannoni 2010, 7)
 Unemployment (Goodwin 1967) Monopoly power, labor power, policies (Kalecki 1938) (Giovannoni 2010, 7)")
11
Structural and policy explanations Liberalization, privatization, financialization, deregulation Oil price, bargaining power, unionization, capital-output ratios Composition effects, technical change (Giovannoni 2010, 7)
")
12
Labor share of income Between 1980 and 2000 the average labor share has fallen by 10 points in the Eurozone, according to the OECD-SULCI dataset. This a clear sign of redistribution from labor to capital. Voluntary wage depression in the Eurozone is partly explained by the willingness to boost European competitiveness in order to capture foreign markets (Giovannoni 2010, 21)
.")
13
European policy of wage deflation to foster external competitiveness stresses the importance of trade. this may result in a beggar-thy-neighbor policy, to the extent that most of European trade is intra- European Community(Giovannoni 2010, 21). European countries are competing in lowering the workers wages and other benefits and raising their taxes. In Germany there are about 7 million working poor most of them with mini jobs (400 euro pay per month and no federal tax or social security payments). (Ojapelto, 2012)
. European countries are competing in lowering the workers wages and other benefits and raising their taxes. In Germany there are about 7 million working poor most of them with mini jobs (400 euro pay per month and no federal tax or social security payments). (Ojapelto, 2012).")
14
Three squeezes the wage share fell and inequality rose, starting in the 80s.. 1. There is less income that has gone to workers and 2. The amount of available income was more unequally distributed. Some countries have even seen a triple squeeze with related above-average unemployment during that period. The reason of an increase in poverty is that the heightened unemployment situation would have forced people out of the work force, or alternatively forced workers to hold very low-paid jobs (Giovannoni, 29)
.")
15
Some history and present events in the US After the WW2 The rise of US The amazing growth of the wealth of the nation Becoming the superpower it still is The industry growing and exports soaring Becoming a debt driven economy – everybody spends more than they earn – consumerism War economy – big corporations earning from the wars US is fighting

16
Uneven distribution of wealth which is only accelerating Deteriorating infrastructure Very strange and unfair tax system which enables the rich to dodge paying taxes but collects the taxes from the middle class and the poor Federal Government expenses 23% of GDP – tax income 19%

17
In a democracy, politicians and the public are unlikely to accept depressed spending power if they can help it. They can try to compensate by easing credit standards, effectively encouraging the non- rich to sustain purchasing power by borrowing. They might, for example, create policies allowing banks to write flimsy home mortgages and encouraging consumers to seek them. Call this the let them eat credit strategy. (Jonathan Rauch, 2012)
.")
18
Income inequality

19
Google pay taxes? Not likely! Google is avoiding paying both U.S. and foreign taxes through the use of complex loopholes. The strategy, known as "income shifting," moves Google's profits through Ireland and the Netherlands to Bermuda. These strategies have helped Google "reduce its overseas tax rate to 2.4 percent, " Closing tax loopholes could return $190 billion to the U.S. Treasury over the next decade.

20
Transfer pricing and tax avoidance An average of two-thirds of companies operating in the United States paid no federal corporate income tax from 1998 - 2005. Transfer pricing can be used for tax planning "the prices between related companies, such as a parent and subsidiary, charged on intercompany transactions." So in complex corporate structures, a company can charge itself essentially for goods and services (and even things like trademarks and copyrights).
..")
21
Facebook tax savings

23
Cases in Finland and Britain Attendo Med One which is owned by IK Investment Partners, has received over 1,4 million in recent years from the finnish tax payers. (In 2010 700 000 for renting personnel)- Ownership in Luxembourg GlaxoSmith Klein used transfer pricing to get 140 million from Britain to Luxemburg – tax rate 0,5% GE healthcare Finland is paying annually 50 million as royalties to Global Technology and Lisensing in US. Finland and USA have a tax agreement on royalties – tax rate = 0,0% (Helsingin Sanomat, 2013, A6-A7)
- Ownership in Luxembourg GlaxoSmith Klein used transfer pricing to get 140 million from Britain to Luxemburg – tax rate 0,5% GE healthcare Finland is paying annually 50 million as royalties to Global Technology and Lisensing in US. Finland and USA have a tax agreement on royalties – tax rate = 0,0% (Helsingin Sanomat, 2013, A6-A7).")
24
24

25
Global Division of Labour In the last 10-15 years countries like China, India, Indonesia Vietnam… have come to the global markets with cheap labour and very little restrictions about the use of natural resources or pollution. European and American consumers have wanted the cheap import goods. But probably did not want to loose their jobs.

26
Squeezed middle refers to hard-working families on an average income, who are seeing their living standards eroded by rising prices, pay freezes, cuts to their pensions and increases in VAT. If you have any savings or property it will be used to finance your care when you are old.

27
Corporations in developing countries Monsanto and Syngenta in India: Seed saving is prevented by patents as well as by the engineering of seeds with non-renewable traits, seed has to be bought for every planting season by poor peasants. This increases poverty and leads to indebtedness. As debts increase and become unpayable, farmers are compelled to sell kidneys or even commit suicide. Since 1997, 182,936 Indian farmers have taken their lives and the numbers continue to rise. According to a recent study by the National Crime Records Bureau, 46 Indian farmers kill themselves every day (Sourcewatch, 2012)
.")
28
Europe needs more foreign labor by 2050 Germany 11,3 million (4,7%) Italy 9,5 million (14,4%) Spain 7,2 million (13,6%) France 2,4 million Portugal 1,5 million (3,3%) Austria 730 000 (8,1%) Belgium 616 000 (4,7%) Netherlands 611 000 (3,5%) Finland 453 000 (7,9%) Denmark 282 000 (4,7%) Source Eurostat; European commission
 Italy 9,5 million (14,4%) Spain 7,2 million (13,6%) France 2,4 million Portugal 1,5 million (3,3%) Austria (8,1%) Belgium (4,7%) Netherlands (3,5%) Finland (7,9%) Denmark (4,7%) Source Eurostat; European commission")
29
Finnish economy Finland has a highly industrialized mixed economy with a per capita output equal to that of other European economies such as France, Germany, Belgium or the UK. The largest sector of the economy is services at 66%, followed by manufacturing and refining at 31%. Primary production is 2.9%. With respect to foreign trade, the key economic sector is manufacturing. The largest industries are electronics (22%), machinery, vehicles and other engineered metal products (21.1%), forest industry (13%) and chemicals (11%).
, machinery, vehicles and other engineered metal products (21.1%), forest industry (13%) and chemicals (11%)..")
30
Unemployment level development in Finland from 1989

31
THE OMX HELSINKI STOCK INDEX FROM 1993-2011

34
Citizens for Tax Justice Analysis, 2012 http://ctj.org/ctjreports/2013/02/facebooks_multi- billion_dollar_tax_break_executive- pay_tax_break_slashes_income_taxes_on_facebook--.php#.UVmbghwqw_g Giovannoni, O. 2010:Functional Distribution of Income, Inequality and the Incidence of Poverty. http://utip.gov.utexas.edu/papers/utip_58.pdf http://utip.gov.utexas.edu/papers/utip_58.pdf Helsingin Sanomat, 9.3.2013, A6-A7, Veroparatiisiyhtiöille kelpaa tuki. Investopedia 2013, Okuns law. http://www.investopedia.com/terms/o/okunslaw.asp#ixzz2No zRm9NM Ojapelto, A. 2012. Työ on jo loppunut http://ariojapelto.blogspot.fi/2013/01/tyo-on-jo- loppunut.html Rauch, Jonathan, 2012, NationalJournal; Inequality and its perils http://www.nationaljournal.com/next-economy/essay-the- growing-income-gap-in-the-u-s-harms-the-economy-20120927 Sourcewatch, 2012; Monsanto in India http://www.sourcewatch.org/index.php/Monsanto_in_India

Similar presentations


 (a)At market prices. Contributions may not sum.>")


 Motto on U.S. currency The Economy: Myth and Reality E pluribus unum (Out of many,>")
 World economy = a delicately balanced house of cards. Key card that held up the rest was American economic prosperity. HoJun.>")
 “European R&D Benchmarking (2002)” Science, Technology and Innovation Policy Student Presentations Students: Miguel.>")
 Germany To which country does the UK export the most.>")


