Download presentation
Presentation is loading. Please wait.

1
Chapter 2. The Labor Market: Definitions, Facts, and Trends.

2
Labor Force Measures (Adult) Civilian noninstitutional population. –persons 16 years of age and older –residing in the 50 States & DC –not inmates of institutions (e.g., penal and mental facilities, homes for the aged), –not on active duty in the Armed Forces.
, –not on active duty in the Armed Forces..")
3
Labor Force Measures Employed persons. –during the reference week, did any work at all (at least 1 hour) as paid employees, worked in their own business, profession, or on their own farm, or worked 15 hours or more as unpaid workers in an enterprise operated by a member of the family, all those who were not working but who had jobs or businesses from which they were temporarily absent (vacation, sick)
 as paid employees, worked in their own business, profession, or on their own farm, or worked 15 hours or more as unpaid workers in an enterprise operated by a member of the family, all those who were not working but who had jobs or businesses from which they were temporarily absent (vacation, sick).")
4
Labor Force Measures Unemployed persons. –no employment during the reference week, –available for work, except for temporary illness, and made specific efforts to find employment some time during the 4-week- period ending with the reference week. –Persons who were waiting to be recalled to a job from which they had been laid off need not have been looking for work to be classified as unemployed.

5
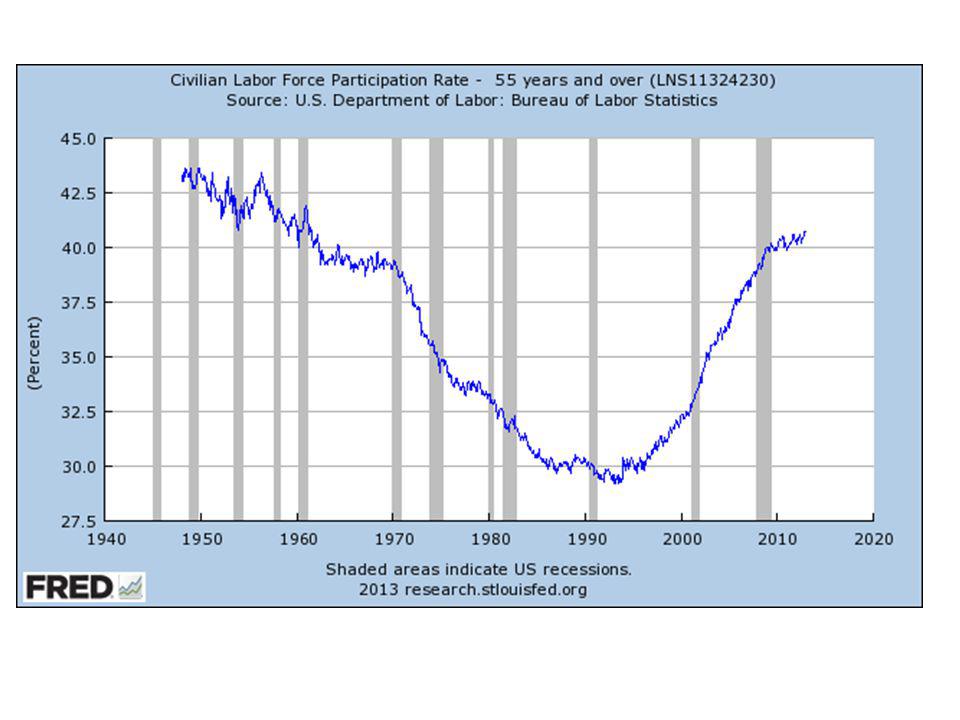
Labor Force Measures Labor force. employed + unemployed Unemployment rate. Unemployed / Labor Force Labor Force Participation rate. Labor Force / Civ. NonInst. Pop Employment-population ratio. Employed/ Civ. Noninst. Pop. Historical Data (Table B35 from Econ. Report)Historical Data
Historical Data.")
6
1990/2011 Data Adult Civilian Noninst. Population (189.164 m / 238.618m.) Civilian Labor Force (125.840m / 153.617 m.) Employed (118.793m./ 139.869 m.) Unemployed (7.047m / 13.747m) Not in labor force (63.324m / 85.001m)
 Civilian Labor Force ( m / m.) Employed ( m./ m.) Unemployed (7.047m / m) Not in labor force (63.324m / m).")
7
Labor force measures 19902011 Unemployment rate Labor force participation rate Employment rate

8
1.Between 2010 & 2011, unemployment rate and employment rate both fell. How is this possible? 2.Based on the growth in Civilian Non-institutional Population between 2010 and 2011, how many jobs would have to be added over the year to keep the unemployment rate at 9.6% if LFPR a. stayed at 2010 level (64.7%)? b. drops to 2011 level (64.1%)? c. rises to level prior to recession (66.0%)?
. b. drops to 2011 level (64.1%). c. rises to level prior to recession (66.0%) .")
9
Start with U=10 million, E=90 million, CNIP=200 million What would happen to unempl rate, lfpr, and empl rate if –10 million people out of labor force begin looking for work and 6 million find jobs. –1 million unemployed people become discourage and quit looking for work? –1 million unemployed people find new jobs? –1 million employed people lose jobs and.5 million choose to retire while the other.5 million begin search for new jobs.

13
Variation in unemployment rates Employment Situation from bls.govEmployment Situation –Sex –Age –Education Why is there a correlation between these characteristics and unemployment rates? Unemployment and employment rates by state.Unemployment and employment rates by state.

14
Wage rate X hours worked =Earnings Earnings + Benefits = Total Compensation Total compensation + unearned (non- labor) income = Total Income Labor Earnings
 income = Total Income Labor Earnings")
15
Earnings Measures

16
Real versus Nominal Wages. CPI t = Real Wage t = Nominal Wage represents earnings in current dollars. Real Wage represents earnings in constant (base year) dollars.
 dollars..")
17
Real versus Nominal Wages. Issues with Indexing –The bundle Varies across people/time. Evidence that CPI over-states growth in cost of living by 1 to 1.5 percent per year. –Quality of goods –Substitution effects Point in time adjustments versus across time –Comparable salary in city j = salary in city k * city j cpi city k cpi

18
Real versus Nominal Wages. CPI data (available from BLS)CPI data If a person earned $8 per hour in 1980, what would yield the equivalent purchasing power in 2010? If a persons nominal wage rose from $10 per hour in 2000 to $11 per hour by 2010, what happened to her real wage (in 1982-84 dollars)?
CPI data If a person earned $8 per hour in 1980, what would yield the equivalent purchasing power in If a persons nominal wage rose from $10 per hour in 2000 to $11 per hour by 2010, what happened to her real wage (in dollars) .")
19
Earnings Measures Cost of Living by City (ACCRA)Cost of Living by City If a person moved from Cincinnati to San Francisco and his earnings rose from $50,000 to $70,000, did his real earnings rise or fall? What are some of the problems with the Cinci/San Francisco comparison?

20
Labor Demand Changes in wages (move along D-curve) –scale effect –substitution effect Changes in other factors (shift D-curve) –demand for product scale effect, no substitution effect –supply of other inputs (e.g. capital) scale effect and substitution effect
 scale effect and substitution effect.")
21
Labor Demand Market, Industry, and Firm Demand. –different ways of measuring labor demand. Long run versus short run demand. –substitution effects tend to be larger in the long run, making labor demand more elastic in the long run.

22
Labor Supply Labor supply curve. –Market supply curve: upward sloping. –Firm supply curve: horizontal in competitive market. Factors shifting labor supply: –population. –alternative opportunities (other employment, nonemployment) –taxes –non-pecuniary aspects of job (fringes, risk, night shifts, etc.)
 –taxes –non-pecuniary aspects of job (fringes, risk, night shifts, etc.).")
23
Labor Market Equilibrium If wage is below equilibrium: shortage. If wage is above equilibrium: surplus (unemployment). Shortages put upward pressure on wages. Surpluses put downward pressure on wages.
. Shortages put upward pressure on wages. Surpluses put downward pressure on wages..")
24
Labor Market Equilibrium Effect of –Increased population –Increased tax on employers –Increased tax on employees –Cheaper capital –Cheaper imports (consumer versus intermediate goods) –Increased demand for product
 –Increased demand for product")
Similar presentations


 GDP vs GPI discussion The Other Major Macroeconomic Variables (Unemployment and.>")


. The Labor Market Labor markets determine –Terms of employment Earnings versus total compensation Working conditions –Levels.>")
