Download presentation
Presentation is loading. Please wait.

1
Measures of Academic Progress
M.A.P. Measures of Academic Progress “One of the most powerful allies of an educator is an informed parent who understands their child's academic needs and is in a position to reinforce what happens in the classroom. When educators share M.A.P. assessment data and resources with parents, the partnership that is created can be very beneficial for the student.” - NWEA

2
What are we going to talk about?
What is MAP? Why use MAP instead of other standardized tests? Unique features of MAP. The benefits of MAP. What does MAP look like for our student? RIT scores, MAP, and reports. OK, MAP.... Now what?

3
(A) What is M.A.P.? Unique student assessment in reading, language, math, and science. Computerized and adaptive that measures academic growth. The difficulty of the assessment will adjust based on how the student performs on the questions as they progress through the test. It is individualized and unique for each student.

4
(B) Why use M.A.P. instead of other standardized tests?
We can administer these tests utilizing less class time. Results are quick, detailed, and accurate about the student’s academic growth over time. MAP is an assessment FOR learning, not OF learning.

5
M.A.P. OF / FOR Learning

6
(C ) Features of M.A.P. Provides a challenging test for every student.
It is a continuous test starting in Grade 1 through Grade 10. Dynamically built based on the achievement level of the student and will give reliable information for each student. Data is individualized to show academic progress, yet can also be analyzed with respect to norms set by NWEA.

7
Features of M.A.P. (Cont.) The tests are NOT timed. Students will be given as much time as needed to complete each test. The AVERAGE time required to complete each test is 50 minutes. Computer displays one question at a time. Students will be tested once or twice each year in reading, language, math and science.

8
Features of M.A.P. (cont.) The test measures academic growth and shows how students are progressing. The data can be looked at historically from test to test, season to season, and year to year. Results are received, with preliminary scores given at the end of each testing season. Following each testing period, parents will receive a report showing your child’s growth and/or a collective test result for the whole year.

9
(D) Benefits of M.A.P. All students have the opportunity to succeed because each test is individualized. Parents and teachers will receive quick, detailed, and accurate information about the student’s academic growth. This assessment is designed to let teachers / parents know where the student’s strengths are, and where help is needed.

10
Benefits of M.A.P. MAP will also help the student to know what they can be working on to improve the most. A strong partnership can develop between teachers and parents that promotes each student’s learning and positively affects the life of the child.

11
(E) What does M.A.P. look like?
The first screen the student will see looks like this.

12
What does M.A.P. look like? (cont.)
Sample Math Question Work the problem on your scratch paper Click on the best answer Click on the <Go on> button

13
What does M.A.P. look like? (cont.)
Sample Reading Question Read the passage and select the best answer Click the <Go on> button

14
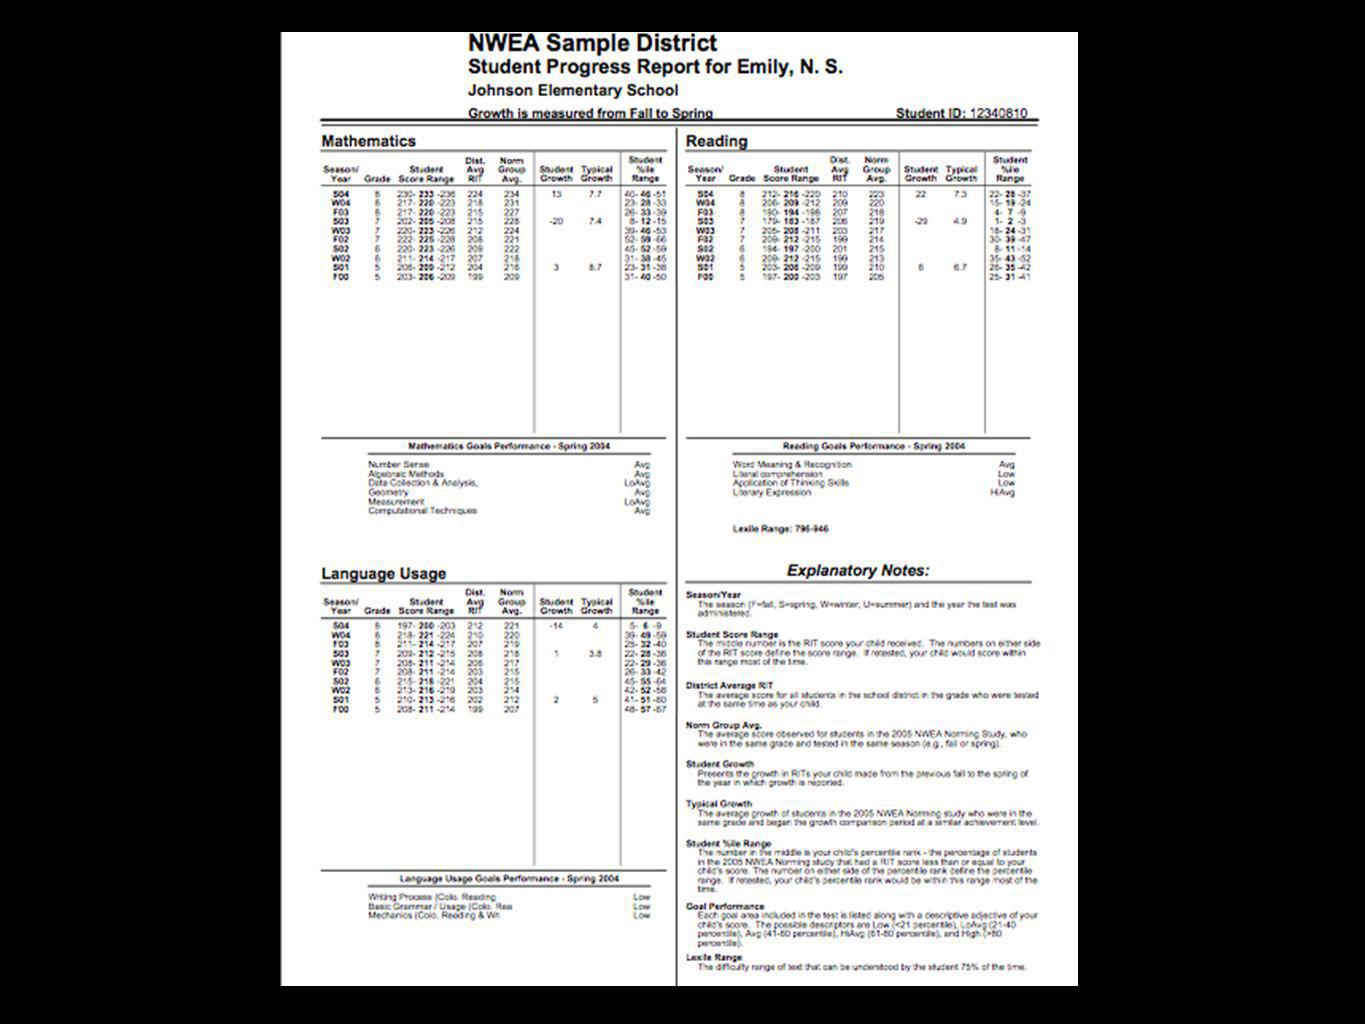
(F) How is M.A.P. Scored? Each student’s progress is reported in RIT (Rasch unIT) scores and normative data. The RIT score is NOT a percentage score, like on other tests. This type of score enables teachers and parents to understand where to focus attention for the child’s optimum learning. The normative data shows the national average (mean) and middle (median) RIT scores for different grades for a typical school district.
 and middle (median) RIT scores for different grades for a typical school district.")
15
RIT Scores An equal-interval scale, like feet and inches, that is independent from grade level. A curriculum scale that uses item difficulty values to estimate student achievement. The RIT score can relate the numbers on the scale directly to the difficulty of items on the tests. RIT scores range from 100 to 280. Scores can be added together to calculate accurate class or school averages.

18
Example of Growth Stages
Class of 2016

19
Class of 2016 vs. National Norms

20
Class of 2016 vs. National Norms

21
Class of 2016 vs. National Norms

22
Example of Growth Stages (cont.)
Class of 2017

23
Class of 2017 vs. National Norms

24
Class of 2017 vs. National Norms

25
Class of 2017 vs. National Norms

26
How do Teachers use MAP results?
MAP assessments are important to teachers because they help keep track of progress and growth in basic skills aligned with Common Core Standards for individuals and groups. The results identify students’ strengths and challenges in specific areas. Results are used to inform curriculum and instruction in the classroom.

27
How can Parents support learning at home through MAP?
Help students prepare for test days through sleep, food, and enthusiasm. Communicate with teachers. Reinforce student goals set in advisory.

28
How Parents can Help Students Improve with Reading.
Borrowed from NWEA Parent Tool Kit found at

29
How Parents can Help Students Improve with Language.
Borrowed from NWEA Parent Tool Kit found at

30
How Parents can Help Students Improve with Math.
Borrowed from NWEA Parent Tool Kit found at

31
Websites for Parents and Students
Borrowed from NWEA Parent Tool Kit found at

32
(G) MAP ... now what? “NWEA’s computerized MAP tests provide teachers, students, and parents with an accurate assessment for a student’s learning achievement, precisely measuring what a child knows and needs to learn. When administered at regular intervals over time, it is possible to find out whether an individual student, class, or an entire grade level, is making satisfactory progress in basic skill areas. Teachers can use this assessment for instructional planning for individual students or an entire class.” - NWEA Admin Handbook

33
Some things to think about...

34
Who did have the better year?

35
Thank you for your time

Similar presentations

. What is MAP? MAP (Measures of Academic Progress) are achievement tests delivered by computer to students.>")
 & Measures of Academic Progress (MAP)>")


 Adapted for use at RMSA.>")


 Curt Nath Director of Curriculum Ocean City School District.>")


 OVERVIEW.>")
 Overview Northern Tier Schools October 26, 2011 Carol Jessen and JaLena Slack>")


