Download presentation
Presentation is loading. Please wait.

1
Assuring the Quality of Laboratory Testing in Countries Fighting the HIV/AIDS Epidemic CDC November 29-30, 2000

2
Test Verification & Test Validation Niel T. Constantine, Ph. D. Professor of Pathology Director Clinical Immunology University of Maryland School of Medicine And Institute of Human Virology

3
Test Verification &Test Validation I.Considerations when determining the utility of tests A. Protocols for Evaluation of Tests B. Reference Tests C. Algorithms D. Choice and Number of Samples E. Testing Conditions F. Resolution of Discordant Results G. Indicators of test performance

4
Considerations When Determining the Utility of Tests Protocols for Evaluations of Tests

5
Protocols for Evaluation of Tests Essential to set guidelines. Must be followed exactly. Must outline all characteristics of samples and procedures. Must describe detailed algorithm to follow for discordant results. Must include QA/QC section.

6
Considerations When Determining the Utility of Tests Reference Tests

7
Needed to fully characterize samples. Choice depends on purpose of testing. Concordance – against reference screening test. Accuracy – against confirmatory test. Must be careful about pre-selected samples to evaluate false positives. Should be tests that are recognized by the scientific community.

8
Considerations When Determining the Utility of Tests Algorithms

9
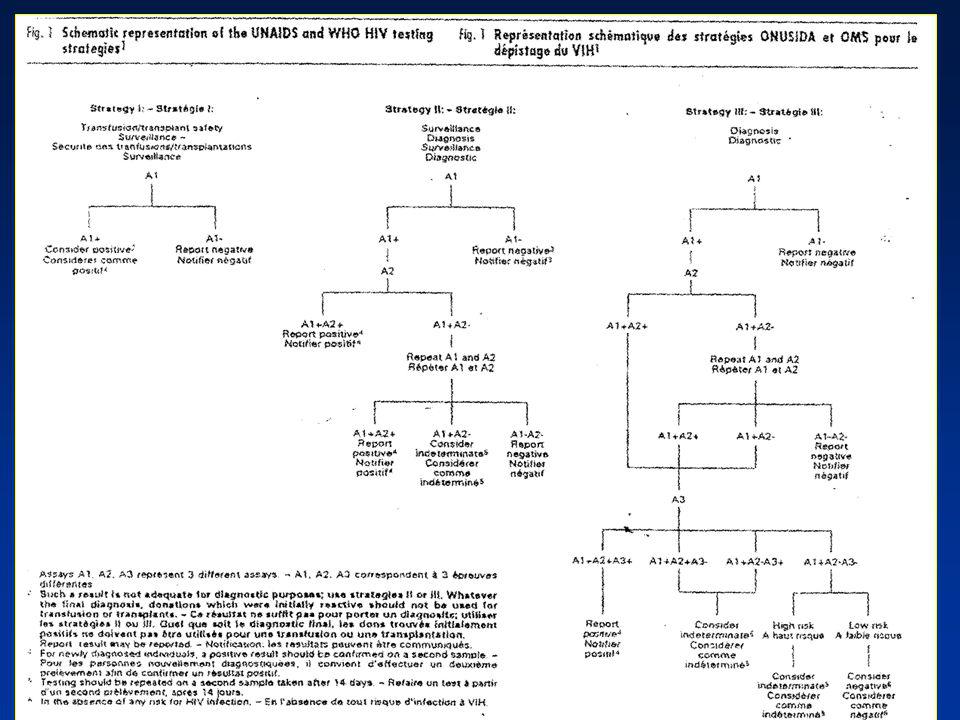
UNAIDS and WHO Recommended Alternative Algorithms To maximize accuracy while minimizing cost Depends on objectives of the test and the prevalence of infection

10
Table 2 UNAIDs and SHO reccommendations for HIV testing strategiesTableau 2 Recommandations de Ionusida et de IOMS aux strategies according to test objective and prevalence of infection in the de depistage du VIH, en fonction de lobectif du test et de la sample population prevalence de linfection dans la population Objective of testingPrevalences of infectionsTesting strategy Objectif du dépistagePrévalences de linfectionStratégie de dépistage Transfustion/transplant safetyAll Prevalences Sécurité des transfusions/transplantationsToutes prévalences Surveillance>10% 10% Clinical signs/symptoms of>30% HIV Infection- Signnes Cliniques/symptôms de 30% linfection à VIH a Asymptomatic>10% Asymptomatique 10% a World Health Organizaion, Intenm proposal for a WHO staging system for HIV infection and desease (WER no.29, 1990, pp 221-228)- Organisation mondiale de la sante. Echelle provisoire OMS proposee pour la determinationdes strades de linfecrtiono VIH et de la malodie (REN no 29, 1990. P.221-228)
.")
12
Considerations When Determining the Utility of Tests Choice and Number of Samples

13
Samples: Should represent population where test will be performed. Same matrix of sample (e.g. plasma). Must meet guidelines stated by manufacturer (e.g. not lipemic). Avoid multiple freeze/thaw, etc. Use cleansamples. Multiple aliquots if possible. Must be well categorized.
. Must meet guidelines stated by manufacturer (e.g. not lipemic). Avoid multiple freeze/thaw, etc. Use cleansamples. Multiple aliquots if possible. Must be well categorized..")
14
Choice and Number of Samples Samples: Should represent population where test will be performed. Same matrix of sample (e.g. plasma). Must meet guidelines stated by manufacturer (e.g. not lipemic). Avoid multiple freeze/thaw, etc. Use cleansamples. Multiple aliquots if possible. Numbers of Samples: The more the better (min. 30 positives, 200 negatives). Depends on purpose of testing (e.g. blood donors). Include appropriate percent of variants. Perform precision and reproducibility studies (lg. Volumes).
. Must meet guidelines stated by manufacturer (e.g. not lipemic). Avoid multiple freeze/thaw, etc. Use cleansamples. Multiple aliquots if possible. Numbers of Samples: The more the better (min. 30 positives, 200 negatives). Depends on purpose of testing (e.g. blood donors). Include appropriate percent of variants. Perform precision and reproducibility studies (lg. Volumes)..")
15
HIV Classification HIV HIV-1HIV-2 O M A, B, C, D, E, F, G, H, I, J Types Clades ANT 70, MVP5180, VAU ROD NIH2 Groups Guidelines for Classification Types: HIV-1 and HIV-2 50% homology Subtypes/Groups: HIV-1 group M, N and O 60-70% homology Clades: HIV-1 Clades A-J >70% homology N

16
Considerations When Determining the Utility of Tests Testing Conditions

17
Must test under identical conditions. (e.g. same lab, equipment, day, tech). Use non-expired kits that have been properly stored. Follow manufacturers recommendations. Sample integrity. Test in a blinded fashion.

18
Considerations When Determining the Utility of Tests Resolution of Discordant Results

19
Check sample integrity, labeling, paperwork, and procedures. Repeat by same technologist. Repeat blindly by another technologist. Repeat reference test blindly. Repeat at different laboratory. Determine true status by other means. What parameters would these investigate?

20
Resolution of Discordant Results Possible Variants Synthetic peptide tests Specific Western blots Specific IFAs Combination tests –Dot blots –Immunoconcentration tests –Augmented blots and LIA PCR - specific

21
Rapid Assay Evaluation Algorithm Rapid Assay + ELISA - Rapid Assay - ELISA + Discordant Results Repeat Rapid & ELISA Western Blot Assay (FDA Licensed) NegativeIndeterminatePositive ResolvedIFA (FDA Licensed) NegativeIndeterminatePositive Resolved Sample Volume > 1 mL Sample Volume ( 0.2 mL) RT-PCR Assay NegativePositive InconclusiveResolved P24 Ag Assay (FDA Licensed) NegativePositive Inconclusive Ag Neutralization Positive Negative Resolved
 NegativeIndeterminatePositive ResolvedIFA (FDA Licensed) NegativeIndeterminatePositive Resolved Sample Volume > 1 mL Sample Volume ( 0.2 mL) RT-PCR Assay NegativePositive InconclusiveResolved P24 Ag Assay (FDA Licensed) NegativePositive Inconclusive Ag Neutralization Positive Negative Resolved")
22
Considerations When Determining the Utility of Tests Indicators of Test Performance

23
Indicators of the Value of a Diagnostic Assay Sensitivity Specificity Test efficiency Delta values Predictive values

24
Sensitivity of Tests Sensitivity (epidemiologic) Sensitivity (analytical) –Low titer –Seroconversion –Dilutions
 Sensitivity (analytical) –Low titer –Seroconversion –Dilutions")
25
Indicators of the Value of a Diagnostic Assay Sensitivity = True Positives True Positives + False Negatives Specificity = True Negatives True Negatives + False Positives X 100%

26
Indicators of the Value of a Diagnostic Assay Positive Predictive = True Positives Value True Positives + False Positives X 100% Negative Predictive = True Negatives Value True Negatives +False Negatives

27
Predictive Values Assume: Test Sensitivity = 100% / Specificity = 99.5% Population #1 Population #1, where the prevalence of infection is high (5%) Population:1000 sera tested 50 sera from infected individuals 950 sera from non-infected individuals Test Results: 50 positives:45 from the infected group 5 false pos from the non-infected group Therefore, the positive predictive value is: PPV = 45 = 90% 45+5 9 out of 10 positive results will be from infected persons
 Population:1000 sera tested 50 sera from infected individuals 950 sera from non-infected individuals Test Results: 50 positives:45 from the infected group 5 false pos from the non-infected group Therefore, the positive predictive value is: PPV = 45 = 90% out of 10 positive results will be from infected persons")
28
Predictive Values Assume: Test Sensitivity = 100% / Specificity = 99.5% Population #2 Population #2, where the prevalence of infection is low (0.7%) Population:1000 sera tested 7 sera from infected individuals 993 sera from non-infected individuals Test Results:7 positives:2 from the infected group 5 false pos from the non-infected group Therefore, the positive predictive value is: PPV = 2 = 28.6% 2+5
 Population:1000 sera tested 7 sera from infected individuals 993 sera from non-infected individuals Test Results:7 positives:2 from the infected group 5 false pos from the non-infected group Therefore, the positive predictive value is: PPV = 2 = 28.6% 2+5")
29
Predictive Values Therefore, the same test that yields the same number of false-positives produces a different positive predictive value when testing two different populations

30
Predictive Values Therefore, the same test that yields the same number of false-positives produces a different positive predictive value when testing two different populations. The chance of a positive result being from a truly infected individual in the low prevalence population is only 28.6% (2 true positive detected by the test and 5 false-positives).
..")
31
Predictive Values Therefore, the same test that yields the same number of false-positives produces a different positive predictive value when testing two different populations. The chance of a positive result being from a truly infected individual in the low prevalence population is only 28.6% (2 true positive detected by the test and 5 false-positives). This indicates that a positive result by the test will be from an infectd individual in only one of four cases (a guess could yield better chance!).
. This indicates that a positive result by the test will be from an infectd individual in only one of four cases (a guess could yield better chance!)..")
32
Test Verification &Test Validation II.Quality Assurance and Errors A. Common Errors B. Quality Assurance Needs 1. Fundamentals of QA 2. Quality Control 3. Quality Assessment 4. Equipment Issues 5. 10 Key Issues for QA

33
Most Common Errors Transcription Carelessness –Procedures –Specimens Environmental conditions Pipettes and pipetting

34
Clerical Errors Logging specimens Aliquoting Worksheets Result printouts Translating results Computer entering Reports Supervisory Review

35
Specimen Problems Insufficient volume for repeating Hemolysis, lipemia, and bacterial contamination Insufficient and inadequate labeling Misidentified specimens Frozen / Thawed (multiple)
")
36
Other Types of Errors Kit Dependent Problems. Technologist – dependent errors. Inter-lot variations and Intra-lot variations. Environmental problems. Non repeatable results. Inter-laboratory and Intra-laboratory variations. Equipment problems.

37
Quality Assurance Fundamental for Quality Test Results Record keeping Monitoring laboratory staff Vigilance in the laboratory Verification of true positive and true negatives Parallel testing of resubmitted samples Reporting of results Confidentiality Interaction with physicians Storage of specimens for follow-up testing Laboratory efficiency Total quality management

38
Components of Quality Control Record Keeping Kit lot numbers (expiration and open dates). Clearly label reagents with date opened or prepared (include open and expiration date) on each label. Daily temperature monitoring and recording i.e. Incubators water baths, ambient. Performance of controls and action taken when out-of-range. Photograph or clear photocopies of Western blots. Ratios of in-house controls to cut-off values.
 on each label. Daily temperature monitoring and recording i.e. Incubators water baths, ambient. Performance of controls and action taken when out-of-range. Photograph or clear photocopies of Western blots. Ratios of in-house controls to cut-off values..")
39
Components of Quality Control Controls Kit controls: Use as directed by the manufacturer. In-house controls: preferably three levels to monitor variability between runs and lot numbers of kits. –Low positive – absorbance enough above cut-off that it should not be misclassified because of expected run-to-run variability. –High positive – well above the cut-off. –Negative – well below cut-off. Storage of in-house control sera: –Dispense in aliquots sufficient for one week of use. –Freeze at -20°C in a non-self-defrosting freezer. –Thaw each aliquot once, store at 4 °C when not in use, do not refreeze and discard after 1 week.

40
Trend Monitoring by External Controls Shift

41
Quality Assessment Internal Quality Assessment –Known Reactors –Unknown Reactors –Blind Testing External Quality Assessment –Proficiency Panels –Blind Proficiency Panels

42
Equipment Issues Pipette Calibrations ESSENTIAL FOR ACCURACY Frequency –At least every 6 months Reasoning –1 l inaccuracy = 10% error (total volume of 10 l) –Controls – o.k., borderline specimens – loss of sensitivity
 –Controls – o.k., borderline specimens – loss of sensitivity")
43
Quality Assurance: What Must Be Done? 10 Key Issues Detailed SOP with total compliance. Supervising review of all paperwork. Develop checklists for monitoring all activities. Dev. Organizational schemes for processing, documentation, and assessment. Monitor staff – blind proficiencies. Neat and complete documentation of all results. No deviation from procedures. Maintain confidentiality. Endorse safety measures. Vigilance.

44
Test Verification &Test Validation III. Introduction of a New Test A. Selection B. Characteristics C. Approved versus Non-Approved tests D. Continual Monitoring

45
Selection Availability Appropriateness Cost and bulk purchases Shelf life and robustness Storage Publications and WHO evaluations Regulations

46
Characteristics Laboratory capabilities Testing Purpose Simplicity Cost Concerns Sample type Test limitations Test principles and antigens Test indices

47
Approved Versus Non-approved Tests Which can be used? When approved tests are unavailable. Validation of non-approved tests. Documentation necessities and qualifications.

48
Continual Monitoring Necessity to monitor new tests. How long to monitor. Methods of monitoring. Looking for trends. Changing tests – Parallel testing. Documentation.

49
Test Verification &Test Validation IV. Special Considerations for Developing Countries A. Selection of Tests and algorithms B. Testing under non-optimal conditions. C. Best fit Strategies D. When Systems Fail

50
Special Considerations for Developing Countries Selection of Tests and Algorithms

51
Selection of Tests Infrastructure Supportability Expertise Accessibility Cost Concerns Algorithms

52
Whats effective? What can be used? Established and recommended algorithms. Use of additional strategies. Differences due to geographical origins of samples. Cost effectiveness. Sample pooling. Blood donations vs. diagnostic testing. Different algorithms within the same country. Epidemiological testing.

53
Simple, Rapid Test Alternative Algorithm Rapid Test #1 Positive Negative P/N OR P/P Rapid Test #2* Repeat in Duplicate REPORT N/N REPORT Positive Negative REPORT indeterminate Resolve with other tests Report as Positive *Different configuration or antigens

54
Special Considerations for Developing Countries Testing Under Non-optimal Conditions

55
Use of expired kits. Unsatisfactory environmental conditions. Limited number of test kits. Limited equipment (e.g. thermometers). Non-calibrated pipettes. Old equipment. Poor integrity of samples. Questionably labeled specimens.
. Non-calibrated pipettes. Old equipment. Poor integrity of samples. Questionably labeled specimens..")
56
Special Considerations for Developing Countries Best Fit Strategies

57
Best-fit Strategies (to Test or Not to Test?) Consequences and necessities. Cost effective strategies. Pooling of samples. Saving reagents. Parallel testing. Sequential testing. Mixing reagents. Alternate testing areas. Testing when temperatures and conditions fail.

58
Pooling of Samples In what situations can pooling be used? How many samples can be pooled? Accuracy. Final sample dilution of pools. Proper sample size for evaluation. Effects of the presence of HIV Antigens.

59
Non-approved Testing Strategies Re-use of rapid tests. Modification of test kits: Cutting WB strips. Halving reagents. Pooling of samples.

60
Special Considerations for Developing Countries When Test Systems Fail

61
Trouble shooting. Repeat testing. Alternative testing. Other personnel, other laboratories. –Getting help. Documentation. Reporting. Consequences.

62
Reasons for the Need for Improved Assays Early diagnosis. Resolution of indeterminate results. Differentiation of retroviral infections. Less expensive tests. Simple and foolproof tests. Detection of viral types and variants. Multiple combination tests. Detection of infection in the newborn.

Similar presentations


. You can freely download, adapt, and distribute this.>")


