Download presentation
Presentation is loading. Please wait.

1
Quaternary dating Techniques - basics Advantages and limitations Age ranges Selected examples

2
Dating techniques Sidereal chronometers Varves *Tree rings Exposure chronometers * TL/OSL *Amino acid racemization Electron spin resistance Obsidian hydration *Weathering/pedogenesis Radio-isotope chronometers *14C *U-series K-Ar Biological chronometers *Lichenometry (Tree rings) *Palaeomagnetism *Tephrochronology
 *Palaeomagnetism *Tephrochronology")
3
Dendrochronology I

4
Dendrochronology II

5
Extending the dendro-record by matching tree-ring fingerprints

6
Fossil moraine ages Advance Retreat (BP) evidence (BP)evidence A <100 younger than B <20 no trees B <600 younger than C ~140 max. tree age C 900 overridden tree ~62 max. tree age D1700 overridden tree >1600 tephra

7
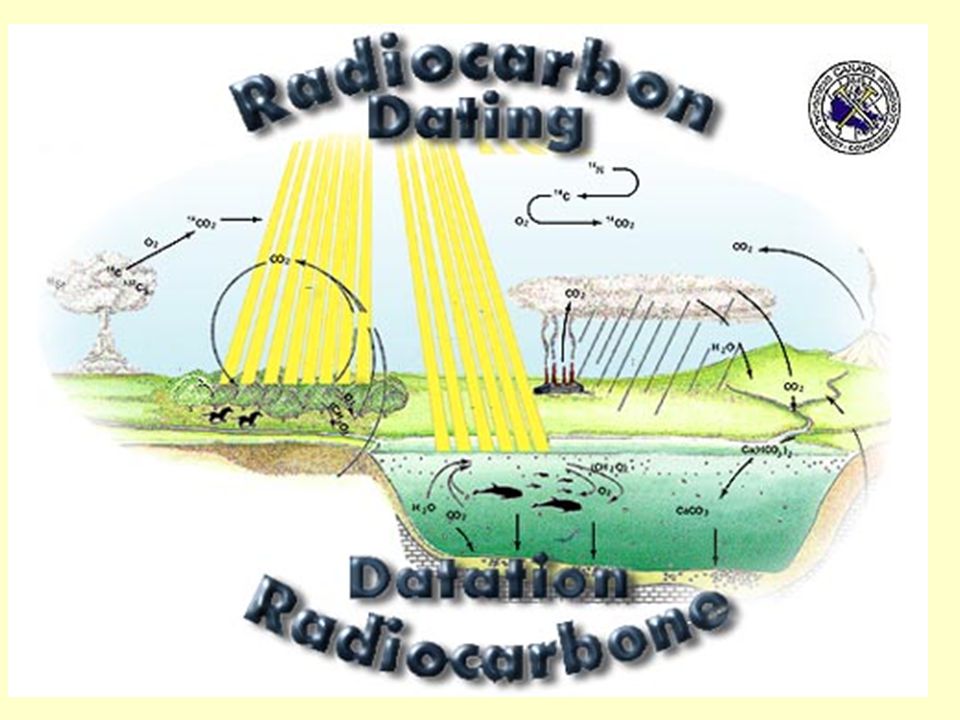
Carbon isotopes

8
Radiocarbon production I

10
14 C decays radioactively to 14 N half- life estimates 5568±30 years (Libby, 1955)* 5730±40 years (Godwin, 1962) 14 C 14 N + + neutrino 1 g sample of modern carbon produces 15 beta particles per minute. 1 g sample of 57,300 year-old carbon produces ~2 beta particles per day (v. difficult to count against background). 1/2 life *by convention the Libby half-life is used
. 1/2 life *by convention the Libby half-life is used.")
11
Radiocarbon measurement Beta particle emissions proportional gas counters liquid scintillation Accelerator mass spectrometry (AMS) measures amount of 14 C directly AMS utilizes smaller samples (x1000 times smaller in some cases), and can date older samples (effective limit ~70 ka vs. 40 ka for older techniques). Ages are reported as a mean ±1, (e.g. 2250±60 years); except for GSC (mean ±2 )
. Ages are reported as a mean ±1, (e.g. 2250±60 years); except for GSC (mean ±2 ).")
12
Influences on 12 C/ 14 C ratio CO 2 content solar output/ sunspot activity controls cosmic ray flux 14 N 14 C lower stratosphere C19 & C20th fossil fuels (old carbon) C20th atomic bomb tests natural variation strength of Earths magnetic field
 C20th atomic bomb tests natural variation strength of Earths magnetic field")
13
Radiocarbon calibration from the rings of living and dead trees e.g. bristlecone pines (Pinus longaeva) growing in the White Mtns, CA. The oldest specimens are >3 000-years old. Irish and German oaks also used.
 growing in the White Mtns, CA. The oldest specimens are >3 000-years old. Irish and German oaks also used..")
14
Calibration: from 14 C years to solar years 14 12 10 8 6 4 2 0 solar years (000, BP) Radiocarbon years (000, BP) 12 10 8 6 4 2 0 1:1
 Radiocarbon years (000, BP) :1")
15
Sample calibration curve 9 820 ±20 14C yrs BP 10 975 - 11 000 cal yrs BP (25-year range) 10 000 ±20 14C yrs BP 11 050 - 11 370 cal yrs BP (320-year range)
 ±20 14C yrs BP cal yrs BP (320-year range)")
16
Isotopic fractionation I Arises because biochemical processes alter the equilibrium distribution of carbon isotopes e.g. photosynthesis depletes 13 C by 1.8% compared to atmospheric ratios; 13 C in inorganic carbon dissolved in the oceans is enriched by 0.7%. The extent of isotopic fractionation on the 14 C/ 12 C ratio is approximately double that of 13 C/ 12 C. So 14 C measurements need to be corrected for fractionation effects. It is common practice for 14 C labs to correct to -25 parts per mille (see next slide)
.")
17
Isotopic fractionation II Standard is the carbonate in PDB sample (see 18 O). Other samples are measured in terms of parts per mille deviation from this standard (set to zero). Material 13 C marine CO 3 0±2 succulents -17±2 bone apatite -12±3 bone collagen -20±2 C4 plants -10±2 C3 plants -23±2 marine organics -15±3 wood-25±3 freshwater plants -16±4 peat, humus -27±3 e.g. normalization of marine samples to 13 C of -25 % requires 16 years per mille added to uncorrected age
. Material 13 C marine CO 3 0±2 succulents -17±2 bone apatite -12±3 bone collagen -20±2 C4 plants -10±2 C3 plants -23±2 marine organics -15±3 wood-25±3 freshwater plants -16±4 peat, humus -27±3 e.g. normalization of marine samples to 13 C of -25 % requires 16 years per mille added to uncorrected age.")
18
Contamination problems: old carbon lake carbonates dissolved CO 3 fossils or bulk sediment samples yield anomalously old ages; old carbon with negligible 14 C activity contaminates deposits reworked coal e.g. beach or floodplain deposits

19
Reservoir effects in 14 C ages of bulk lake sediments In the initial phase of lake development in non-carbonate terrain 14 C ages on bulk deposits yield ages 500-1000 years older than plant macrofossils. This reservoir age declines to 100- 200 years after about a millennium. In carbonate terrain the reservoir age can be much higher. Hutchinson et al. 2004. Quat. Res., 61, 193-203. Heal Lake, Vancouver Is.

20
The oceanic 14 C reservoir effect atmosphere mixing upwelling ocean coastal food web molluscs abyss shelf CO 2 Marine shells have a mean reservoir age of 400 years (global average)
")
21
Spatial variation in oceanic reservoir effects (South Atlantic) 0 10 20 30 40 50 60°S 1010±80 760±50 830±60 880±60 500±60 1000±80 380±60 1120±60 710±50970±40450±120 North Atlantic Deep Water Antarctic Intermediate Water upwelling CO 2 Atmospheric age of water sample 0 5 km
 °S 1010±80 760±50 830±60 880±60 500± ±80 380± ±60 710±50970±40450±120 North Atlantic Deep Water Antarctic Intermediate Water upwelling CO 2 Atmospheric age of water sample 0 5 km")
22
Temporal variations in oceanic reservoir effects (NE Pacific) Str. of Georgia Q. Charlotte Is. S. California Hutchinson et al. 2004. Quat. Res., 61, 193-203.

23
Contamination problems: young carbon fossils or bulk sediment samples yield anomalously young ages; young carbon with high 14 C activity contaminates deposits e.g. dating plant parts or bulk peat from marsh or bog deposits living roots dead roots 14 C ages cone: 2500±50 yr BP peat: 2200±120 yr BP

24
Uranium-series dating I U-238 Po-210Pb-206Pb-210 U-234 Rn-222 Th-230Ra-226 (stable) 4.5 x 10 9 years days years days 2.5 x 10 5 7.5 x 10 4 223.8 138 1.6 x 10 3 years U = uranium; Th = thorium; Ra = radium; Rn = radon; Pb = lead; Po = polonium
 4.5 x 10 9 years days years days 2.5 x x x 10 3 years U = uranium; Th = thorium; Ra = radium; Rn = radon; Pb = lead; Po = polonium")
25
Uranium-series dating II U = uranium; Pa = protactinium; Th = thorium; Ra = radium; Pb = lead; U-235Pa-231 Pb-207 Th-227 Ra-223 (stable) 7.1 x 10 8 years 3.2 x 10 4 19 days 11
 7.1 x 10 8 years 3.2 x days 11")
26
14 C and U-series dates on corals - extending the 14 C calibration curve

27
Thermoluminescence / Optically stimulated luminescence Background

28
TL/OSL measurement

29
TL/OSL vs. 14 C (accuracy and precision) e.g. dating disturbance events (DE) [probably Cascadia tsunamis] in deposits of Bradley Lake, S.Oregon (Ollerhead et al (2001) Quat. Sci Rev., 20, 1915-1926. DE Calibrated OSL age Corrected 14C age (BP) (BP) OSL age (BP) 2 1060-1290 <1310±140 <1590±180 5/6 1600-1820 <4320±420 <5200±530 7 2750-2860 <4300±410 <5170±520 8 2990-3260 2400±150 2950±200 12 4150-4420 3670±170 4400±230
 [probably Cascadia tsunamis] in deposits of Bradley Lake, S.Oregon (Ollerhead et al (2001) Quat. Sci Rev., 20, DE Calibrated OSL age Corrected 14C age (BP) (BP) OSL age (BP) <1310±140 <1590±180 5/ <4320±420 <5200± <4300±410 <5170± ± ± ± ±230.")
30
TL saturation

31
14 C- TL chronology; Weinan loess section, China 14 C (AMS) TL SPECMAP correlation
 TL SPECMAP correlation")
32
Amino-acid racemization These forms of amino acids have the same physical properties, but polarized light is rotated differently by the two forms. Racemization rates are strongly influenced by environmental factors (particularly temperature). Racemization rates differ between types of material (e.g bone, wood, shell) and often between species, so it is important to compare similar genera. levo form ------------------> dextro form (living organism) (after death) decay = racemization
. Racemization rates differ between types of material (e.g bone, wood, shell) and often between species, so it is important to compare similar genera. levo form > dextro form (living organism) (after death) decay = racemization.")
33
Discrepancies in AAR vs. 14 C and U-series ages

34
Pedogenesis / Weathering

35
Lichenometry

36
Lichenometry- measuring the maximum or inscribed circle diameter of a thallus using digital calipers

37
Calibrating lichen growth rates

38
Max. diameter (in mm) =lichen factor, of thalli of Rhizocarpon tinei in western Greenland
 =lichen factor, of thalli of Rhizocarpon tinei in western Greenland")
39
Growth rates of Rhizocarpon geographicum in N. Europe and N. America

40
Palaeomagnetism I

41
Palaeomagnetism II

42
Tephrochronology Volcanic ashes provide bracketing ages for events How old (approximately) are the dune systems?
 are the dune systems")
43
Tephras at Kliuchi, Kamchatka, Russia Shovel handle is ~50 cm long ~900 BP ~7600 BP ~2500 BP

44
Holocene and Late Glacial tephras (western Canada and adjacent USA)
")
45
Holocene and Late Glacial eruptions; W. Canada and adjacent USA

46
Radio-isotope chronometers

47
Exposure chronometers

48
Other chronometers

Similar presentations


>")
>")


 Bones, teeth, shells, hard exoskeletons Usually in sedimentary rocks (water.>")