Download presentation
Presentation is loading. Please wait.

1
A Methodology for Determining the Transferability Rate of Courses Kelly Perez-Vergara, Mike Kramer, Kelly Patel and Martin Orlowski

2
Three main points We talk a lot about transfer equivalencies and the need to increase transferability of courses, but we dont know the extent of the problem. The data is available, but the analysis is missing. Without analysis, our interventions are based on intuition rather than evidence. 2

3
Background Oakland Community College – Five campuses (Oakland County) – Headcount 2011-12 = 57,924 3
 – Headcount = 57,924 3")
4
Introduction Community college priority: transfer & completion Standard measures: transfer rates, subsequent completion rates 4

5
Introduction Community college priority: transfer & completion Standard measures: transfer rates, subsequent completion rates Doyle (2006) on subsequent completion rates – All credits = 82% – Some credits = 42% New measure: extent to which courses transfer 5
 on subsequent completion rates – All credits = 82% – Some credits = 42% New measure: extent to which courses transfer 5")
6
Purpose To determine the extent to which courses transfer to four-year institutions in which a large number of our students transfer. 6

7
Methods: Receiving Institutions of Interest National Student Clearinghouse: subsequent enrollment Students Submitted = 142,034 Returned = 133,057 Hit rate = 93.68% 7

8
Methods: Receiving Institutions of Interest National Student Clearinghouse: subsequent enrollment Students Submitted = 142,034 Returned = 133,057 Hit rate = 93.68% Number of subsequent enrollments @ 4-year 2012 = 7,755 Number of subsequent enrollment anywhere 2012 = 13,332 8

9
Results: Receiving Institutions of Interest Tier 1 Institution Baker College Central Michigan University Davenport University Eastern Michigan University Madonna University Michigan State University Oakland University University of Detroit Mercy University of Michigan- Central Campus University of Michigan- Dearborn University of Michigan- Flint University of Phoenix Walsh College Wayne State University Western Michigan University 9

10
Methods: Determining the Transferability Rate of Courses Courses: all, excluding courses related to occupational program & special topics/internship courses Michigan Transfer Network & institutional websites 10

11
Methods: Determining the Transferability Rate of Courses Courses: all, excluding courses related to occupational program & special topics/internship courses Michigan Transfer Network & institutional websites Coding scheme – Equivalent course – General credit – No credit 11

12
Equivalent Course Examples Transferring From:Transferring To: SubjectCourseCreditsSubjectCourseCourse TitleCredits General Credit Waived Credits MAT11004MATH100Basic Algebra400 MAT1580 MATH143Intro to Probability & Stats MAT11503MAT140Intermediate Algebra3 1 SLS11002ASL113ASL Fingerspelling1 MAT15404MAT111College Algebra31 Methods: Determining the Transferability Rate of Courses 12

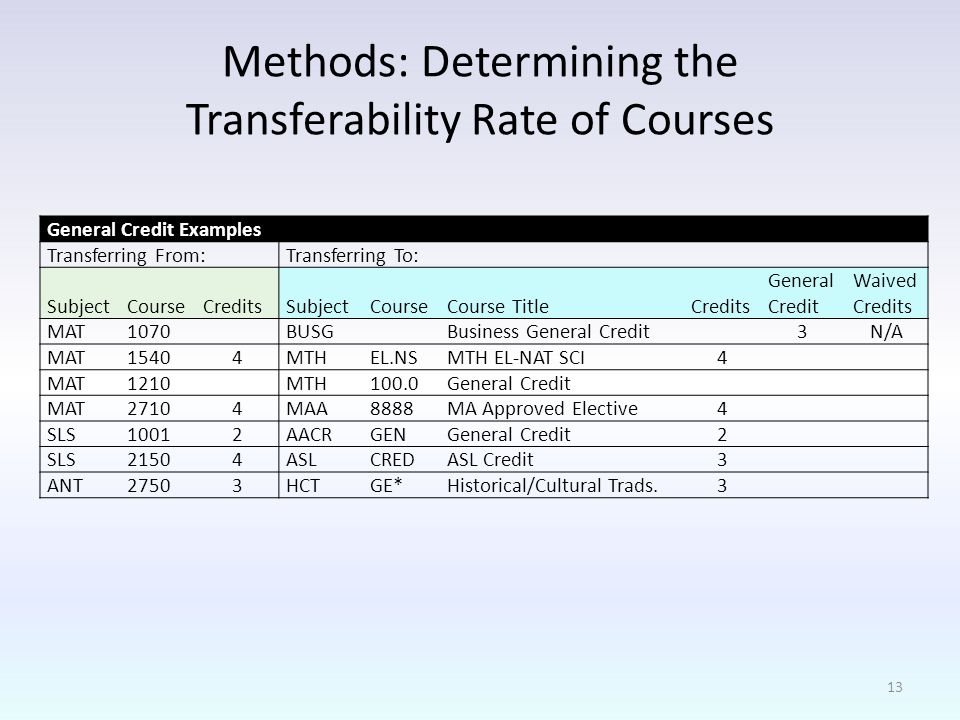
13
Methods: Determining the Transferability Rate of Courses General Credit Examples Transferring From:Transferring To: SubjectCourseCreditsSubjectCourseCourse TitleCredits General Credit Waived Credits MAT1070 BUSG Business General Credit 3N/A MAT1540 4 MTHEL.NSMTH EL-NAT SCI 4 MAT1210 MTH100.0General Credit MAT2710 4 MAA8888MA Approved Elective 4 SLS1001 2 AACRGENGeneral Credit 2 SLS2150 4 ASLCREDASL Credit 3 ANT2750 3 HCTGE*Historical/Cultural Trads. 3 13
14
Methods: Determining the Transferability Rate of Courses No Credit Examples Transferring From:Transferring To: SubjectCourseCreditsSubjectCourseCourse TitleCredits General Credit Waived Credits MAT1045 4 NOCREDNo Credit 0 ARB1530 ARB1XXValidation by Proficiency Exam 14

15
Results: Transferability Rate of Courses Overall averages Compare course rates – Within a discipline – Between disciplines – Based on course characteristics 15

16
Results: Overall averages Average number of institutions that accept courses for credit Number of Courses Average # (%) of Institutions that Accept Courses for Any Credit Average # (%) of Institutions that Accept Courses as Equivalent Courses All courses30610 (69)5 (36) 16
 of Institutions that Accept Courses for Any Credit Average # (%) of Institutions that Accept Courses as Equivalent Courses All courses30610 (69)5 (36) 16")
17
Results: Compare course rates within a discipline 17

18
Results: Compare course rates within a discipline 18

19
Results: Compare course rates between disciplines Subset of disciplines Discipline Average % institutions accepting for equivalent credit # courses German77%2 Chemistry68%4 Political Science65%4 Philosophy61%5 Music25%29 Art24%38 Journalism20%5 Woodworking13%2 Gerontology10%4 Early Childhood Development2%6 Mental Health/Social Work2%7 19

20
Results: Compare course rates by course characteristics Average number of institutions that accept courses for credit Number of Courses Average # (%) of Institutions that Accept Courses for Any Credit Average # (%) of Institutions that Accept Courses as Equivalent Course All courses30610 (69)5 (36) GE courses17311 (73)7 (47) All other courses13310 (64)3 (23) 20
 of Institutions that Accept Courses for Any Credit Average # (%) of Institutions that Accept Courses as Equivalent Course All courses30610 (69)5 (36) GE courses17311 (73)7 (47) All other courses13310 (64)3 (23) 20")
21
Results: Compare course rates by course characteristics General education courses versus all others Benchmark = 47% (equivalent credit) – Below = 199 courses – At or above = 107 courses 21
 – Below = 199 courses – At or above = 107 courses 21")
22
Results: Compare course rates by characteristics Average number of institutions that accept courses for credit Number of Courses Average # (%) of Institutions that Accept Courses for Any Credit Average # (%) of Institutions that Accept Courses as Equivalent Courses All courses30610 (69)5 (36) GE courses17311 (73)7 (47) All other courses13310 (64)3 (23) MACRAO courses11312 (81)8 (53) All other GE courses609 (59)5 (35) 22
 of Institutions that Accept Courses for Any Credit Average # (%) of Institutions that Accept Courses as Equivalent Courses All courses30610 (69)5 (36) GE courses17311 (73)7 (47) All other courses13310 (64)3 (23) MACRAO courses11312 (81)8 (53) All other GE courses609 (59)5 (35) 22")
23
Results: Compare course rates by characteristics Comparison of general education requirements at our institution and MACRAO requirements Institutional General EducationMACRAO Requirements Minimum # creditsRequirements Minimum # credits Communication/English6English6 Fine Arts/Humanities3 8 Mathematics/Science3 8 Social Science6 8 Physical Education3 Total21Total30 23

24
Conclusions Course transfer rates – Previously non-standard or anecdotal – New method adds reliability & validity Focused interventions, change is measurable 24

25
Limitations NSC data limitations Manual coding of transferability Courses coded as no credit due to lack of information Credit applicable to degree requirements Transferability changes more frequently than we can update it 25

26
Future Directions Near future – Track progress for efforts to increase transferability – Update information annually and compare – Utilize similar process for evaluating newly proposed courses – Align our courses with what is offered at the 4 year colleges, in terms of 100 & 200 level courses 26

27
Future Directions Ultimately – Make this methodology obsolete by exchanging standardized datasets with 4-year schools 27

28
Three main points We talk a lot about transfer equivalencies and the need to increase transferability of courses, but we dont know the extent of the problem. The data is available, but the analysis is missing. Without analysis, our interventions are based on intuition rather than evidence. 28

29
Questions? krperezv@oaklandcc.edu 29

Similar presentations


 Grants Chapter 6.>")
