Download presentation
Presentation is loading. Please wait.

1
Sensor-Based Approaches for Cotton Nitrogen Management

2
Introduction 2008 Sensor Projects Sensor-based approaches to manage nitrogen Core data collection

4
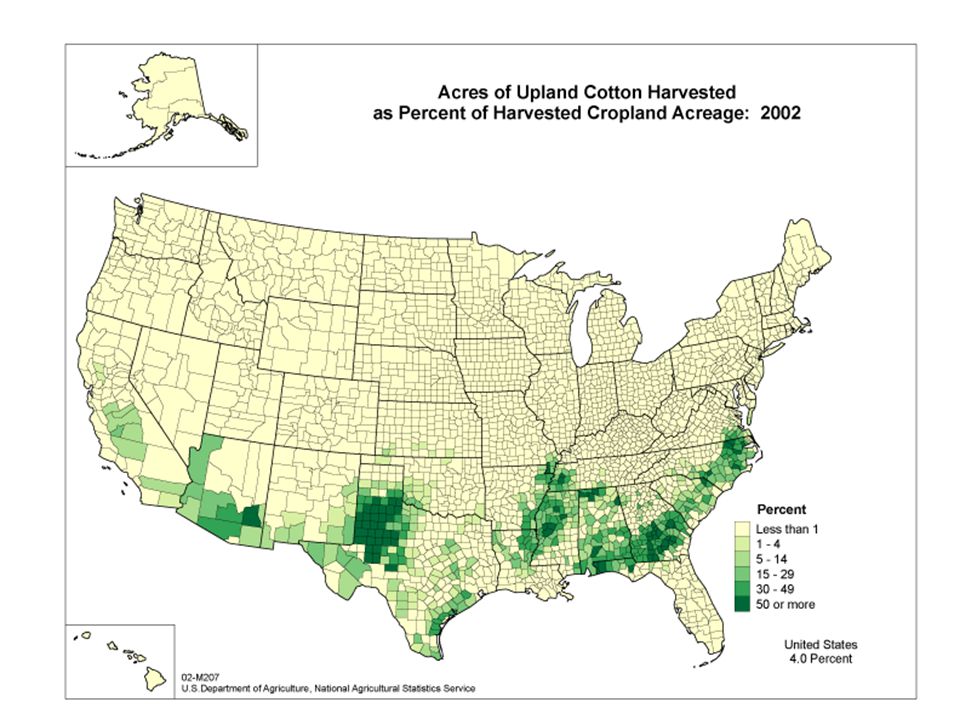
USDA, NASS

5
Perennial plant managed as annual Indeterminate flowering pattern 50 lbs N – per lint bale (1 bale = 480 lbs) Over-application of N: Energy partition to vegetative vs. reproductive development Large plants prevent efficient harvest Growth regulators applied to control vegetative development

6
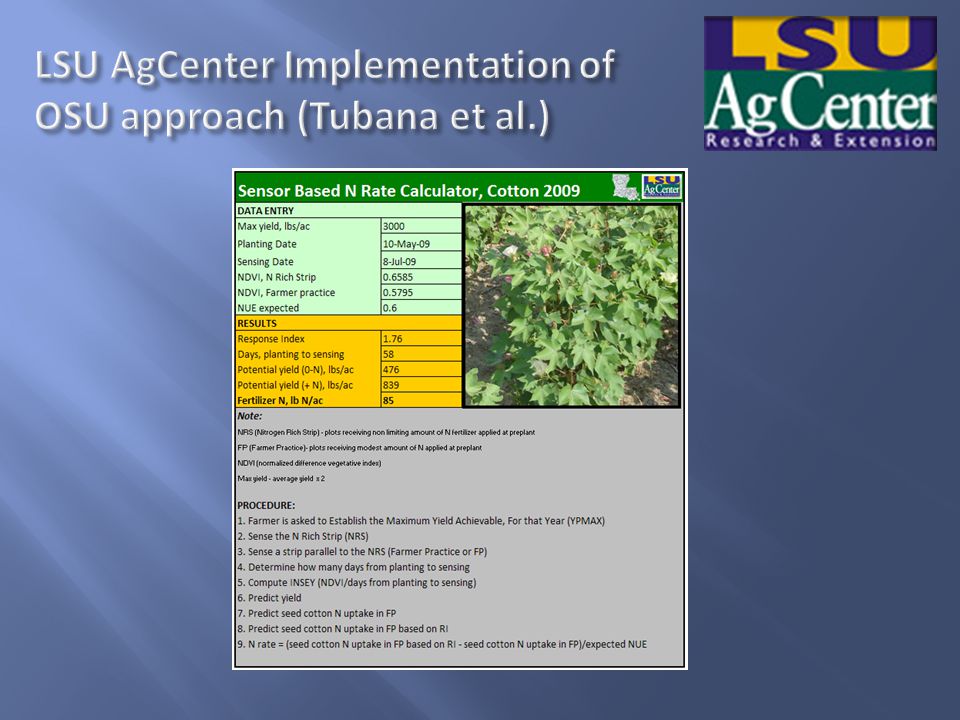
2008 Sensor Projects StateInvestigatorsInputs Managed Based on Modulated Active Light Sensors PGRDefoliantNitrogenInsecticidePlant MapIrrigation AlabamaS. Norwood, A. Winstead, J. Fulton K. Balkcom ArizonaT. Clarke, D. Hunsaker ArkansasM. Mozaffarri GeorgiaG. Vellidis, C. Perry H. Schomberg LouisianaR. Leonard B. Tubana, D. Boquet, E. Clawson MississippiJ. Varco MissouriG. Stevens, P. Scharf, E. Vories New MexicoT. Carrillo, J. Ellington North CarolinaG. Robinson OklahomaR. Taylor, T. Sharp, S. Osborne, J. Banks, B. Arnall, B. Raun South CarolinaM. Jones, P. Bauer A. Khalilian, W. Henderson TennesseeJ. Wilkerson O. Gwathmey J. Larson (Economics) TexasK. Bronson D. Martin A. Thomasson, R. Sui custom sensor + other sensor + other sensor + other sensor + other sensor
 TexasK. Bronson D. Martin A. Thomasson, R. Sui custom sensor + other sensor + other sensor + other sensor + other sensor.")
7
Sensor-Based Approaches Relate yield potential with sensor readings and a well fertilized nitrogen plot Relate yield potential with sensor readings and a well fertilized nitrogen plot Direct regression relationship between sensor reading compared to a reference nitrogen plot Direct regression relationship between sensor reading compared to a reference nitrogen plot A growth stage specific relationship between the sensor reading and N rate A growth stage specific relationship between the sensor reading and N rate Relationship between historic yield, soil type and the sensor reading Relationship between historic yield, soil type and the sensor reading

9
Variables that determine crop N requirements Estimation Procedures Crop yield level Yield goal; history (Yield potential predictive equation) Available soil N organic matter mineralization organic matter mineralization residual N residual N atmospheric deposition atmospheric deposition legumes credit legumes credit nitrate in irrigation water nitrate in irrigation water manure manure Soil and tissue analyses (Estimates of increase in yield due to N using early-season canopy reflectance- response index)
 Available soil N organic matter mineralization organic matter mineralization residual N residual N atmospheric deposition atmospheric deposition legumes credit legumes credit nitrate in irrigation water nitrate in irrigation water manure manure Soil and tissue analyses (Estimates of increase in yield due to N using early-season canopy reflectance- response index)")
10
SBNRC Algorithm OSU – Arnall et al. N Rate = (YP0 * RI – YP0) * %N / NUE N Rate = (YP0 * RI – YP0) * %N / NUE potential cotton lint yield, kg/ha = 235.96 e 2216.2 * INSEY potential cotton lint yield, kg/ha = 235.96 e 2216.2 * INSEY cotton lint yield, kg/ha = 177.41 e 2216.2 * INSEY cotton lint yield, kg/ha = 177.41 e 2216.2 * INSEY Where: Where: Yield Prediction Model: YP0 = 235.96 e 2216.2 * INSEY Yield Prediction Model: YP0 = 235.96 e 2216.2 * INSEY Response Index: RI = 1.8579 * RINDVI – 0.932 Response Index: RI = 1.8579 * RINDVI – 0.932 %N = 0.09 %N = 0.09 Nitrogen Use Efficiency: NUE = 0.50 Nitrogen Use Efficiency: NUE = 0.50
 * %N / NUE N Rate = (YP0 * RI – YP0) * %N / NUE potential cotton lint yield, kg/ha = e * INSEY potential cotton lint yield, kg/ha = e * INSEY cotton lint yield, kg/ha = e * INSEY cotton lint yield, kg/ha = e * INSEY Where: Where: Yield Prediction Model: YP0 = e * INSEY Yield Prediction Model: YP0 = e * INSEY Response Index: RI = * RINDVI – Response Index: RI = * RINDVI – %N = 0.09 %N = 0.09 Nitrogen Use Efficiency: NUE = 0.50 Nitrogen Use Efficiency: NUE =")
11
SBNRC Algorithm OSU – Arnall et al.

12
Initiated in 2008, 3 sites in North Louisiana Growth stage: two weeks after early bloom INSEY is defined as NDVI divided by the number of days from planting to sensing

13
This study also consider the impact of PGR (applied at early bloom) on the yield relationship.
 on the yield relationship.")
15
Soil specific yield by INSEY relationships (soil electrical conductivity categories) Coastal plain soils of South Carolina INSEY was calculated as days from emergence to date of sensing.
 Coastal plain soils of South Carolina INSEY was calculated as days from emergence to date of sensing.")
17
Best-band-ratio predictor of economically optimal nitrogen rate

18
Calculating N rate based on NDVI and refNDVI: Calculating N rate based on NDVI and refNDVI: Crop Circle 210: N rate (lb/ac) = 573 - [549 x (NDVI/refNDVI)] Crop Circle 210: N rate (lb/ac) = 573 - [549 x (NDVI/refNDVI)] GreenSeeker: N rate (lb/ac) = 760 - [732 x (NDVI/refNDVI)] GreenSeeker: N rate (lb/ac) = 760 - [732 x (NDVI/refNDVI)] Cropscan: N rate (lb/ac) = 691 - [673 x (NDVI/refNDVI)] Cropscan: N rate (lb/ac) = 691 - [673 x (NDVI/refNDVI)] Ceilings on total N rate are use: Ceilings on total N rate are use: 200 lbs N/ac for heavy soils (clay, clay loam) 200 lbs N/ac for heavy soils (clay, clay loam) 150 for other soils 150 for other soils Farmers decide on lowest and highest N rates for the system (within the ceiling) Farmers decide on lowest and highest N rates for the system (within the ceiling)
![Calculating N rate based on NDVI and refNDVI: Calculating N rate based on NDVI and refNDVI: Crop Circle 210: N rate (lb/ac) = [549 x (NDVI/refNDVI)] Crop Circle 210: N rate (lb/ac) = [549 x (NDVI/refNDVI)] GreenSeeker: N rate (lb/ac) = [732 x (NDVI/refNDVI)] GreenSeeker: N rate (lb/ac) = [732 x (NDVI/refNDVI)] Cropscan: N rate (lb/ac) = [673 x (NDVI/refNDVI)] Cropscan: N rate (lb/ac) = [673 x (NDVI/refNDVI)] Ceilings on total N rate are use: Ceilings on total N rate are use: 200 lbs N/ac for heavy soils (clay, clay loam) 200 lbs N/ac for heavy soils (clay, clay loam) 150 for other soils 150 for other soils Farmers decide on lowest and highest N rates for the system (within the ceiling) Farmers decide on lowest and highest N rates for the system (within the ceiling)](http://images.slideplayer.com/5/1584609/slides/slide_18.jpg "Calculating N rate based on NDVI and refNDVI: Calculating N rate based on NDVI and refNDVI: Crop Circle 210: N rate (lb/ac) = [549 x (NDVI/refNDVI)] Crop Circle 210: N rate (lb/ac) = [549 x (NDVI/refNDVI)] GreenSeeker: N rate (lb/ac) = [732 x (NDVI/refNDVI)] GreenSeeker: N rate (lb/ac) = [732 x (NDVI/refNDVI)] Cropscan: N rate (lb/ac) = [673 x (NDVI/refNDVI)] Cropscan: N rate (lb/ac) = [673 x (NDVI/refNDVI)] Ceilings on total N rate are use: Ceilings on total N rate are use: 200 lbs N/ac for heavy soils (clay, clay loam) 200 lbs N/ac for heavy soils (clay, clay loam) 150 for other soils 150 for other soils Farmers decide on lowest and highest N rates for the system (within the ceiling) Farmers decide on lowest and highest N rates for the system (within the ceiling)")
20
Relationship between GNDVI or NDVI at a specific stage of growth and fertilizer N rate Leaf N approach (graph): Utilize N rates to that produce leaf N values at various physiological stages
: Utilize N rates to that produce leaf N values at various physiological stages")
21
Example of established relationship at the third week of squaring (experimental data): Example of established relationship at the third week of squaring (experimental data): Fertilizer N rate equivalence (FNRE) = -999.562 + 1584.984(GNDVI or NDVI on-the-go value) Variable N rate = FNRE (experimental data) – target rate Variable N rate = FNRE (experimental data) – target rate Ceilings on total N rate (cutoff values) Ceilings on total N rate (cutoff values)
: Example of established relationship at the third week of squaring (experimental data): Fertilizer N rate equivalence (FNRE) = (GNDVI or NDVI on-the-go value) Variable N rate = FNRE (experimental data) – target rate Variable N rate = FNRE (experimental data) – target rate Ceilings on total N rate (cutoff values) Ceilings on total N rate (cutoff values)")
23
Bracket the response of real-time nitrogen prescription algorithms Bracket the response of real-time nitrogen prescription algorithms Incorporate a map of historic information: identify areas within a field as historically low or high yielding and increment/decrement the N prescription accordingly Incorporate a map of historic information: identify areas within a field as historically low or high yielding and increment/decrement the N prescription accordingly Additional agronomic data to determine the size of increment or decrement in response to yield potential is needed. Additional agronomic data to determine the size of increment or decrement in response to yield potential is needed. Historic Yield Potential NDVILowAverageHigh R--R-R AverageR-RR+ LowRR+R++ Where: R is the average recommended rate, R+ and R++ are positively incremented, and R- and R- - are decremented from the recommended rate.

24
Canopy chlorophyll content index (CCCI) – relative estimate of the chlorophyll content in a crop canopy Canopy chlorophyll content index (CCCI) – relative estimate of the chlorophyll content in a crop canopy CCCI accounts for variation in canopy density and less likely to give false indications of low chlorophyll content (vs. simple ratio or NDVI) CCCI accounts for variation in canopy density and less likely to give false indications of low chlorophyll content (vs. simple ratio or NDVI) Well-suited for the three-band sensor (Crop Circle) Well-suited for the three-band sensor (Crop Circle)
 CCCI accounts for variation in canopy density and less likely to give false indications of low chlorophyll content (vs. simple ratio or NDVI) Well-suited for the three-band sensor (Crop Circle) Well-suited for the three-band sensor (Crop Circle).")
25
Develop a simplified yield potential nitrogen rate estimate – under discussion. Producer usable approach - 2010

26
Core Data Collection Growth stages for plant data collection: Growth stages for plant data collection: Early squaring: 3 to 7 squares Early squaring: 3 to 7 squares Early bloom: 2 to 3 blooms Early bloom: 2 to 3 blooms Mid bloom Mid bloom Peak bloom Peak bloom Nitrogen rates: 0, 90, and 120 lb N/ac Nitrogen rates: 0, 90, and 120 lb N/ac

27
Core Data Collection Soils data set (Mehlich-3 P & K, soil NO 3 ) Soils data set (Mehlich-3 P & K, soil NO 3 ) Preplant samples Preplant samples Post-harvest samples Post-harvest samples
 Soils data set (Mehlich-3 P & K, soil NO 3 ) Preplant samples Preplant samples Post-harvest samples Post-harvest samples")
28
Core Data Collection Within season plant information: Within season plant information: Sensor readings Sensor readings Within season plant information: Within season plant information: Sensor readings Sensor readings

29
Core Data Collection Within season plant information: Within season plant information: SPAD readings and plant height SPAD readings and plant height Tissue samples for leaf N Tissue samples for leaf N

30
Hand harvest – 13.3 ft of row Machine – 40 feet of 2 rows Determine seed cotton and lint weight Seed N content Hand harvest – 13.3 ft of row Machine – 40 feet of 2 rows Determine seed cotton and lint weight Seed N content Yield Data Collection

31
Other Record Keeping Varieties Varieties Planting and harvest dates Planting and harvest dates Nitrogen rates, timing, application methods and N sources Nitrogen rates, timing, application methods and N sources PIX rates and dates (if applicable) PIX rates and dates (if applicable) Irrigation amounts (indicate in furrow, pivot, drip) Irrigation amounts (indicate in furrow, pivot, drip) Rainfall Rainfall
 PIX rates and dates (if applicable) Irrigation amounts (indicate in furrow, pivot, drip) Irrigation amounts (indicate in furrow, pivot, drip) Rainfall Rainfall")
32
One or more of these approaches should be ready for extended on-farm evaluation in 2010. Will this end with one concept: analysis of core data: correction procedures (thermal time, days from planting to sensing etc.) components (yield potential, response index, simple ratio)
 components (yield potential, response index, simple ratio).")
Similar presentations


 IN SOUTH DAKOTA ECONOMIC OPTIMUM NITROGEN RATE FOR HRSW IN SOUTH DAKOTA Nitrogen Use Efficiency Meeting Cheryl Reese*,>")


