Download presentation
Presentation is loading. Please wait.

1
Livestock & Crop Outlook
Chad Hart Iowa State University Livestock information from Lee Schulz, Department of Economics, Iowa State University (515) ;
 ;")
2
Beef: + 2015.Q4 Pork: + 2015.Q1 Total Poultry: +2012.Q4
Data Source: USDA-NASS, Compiled & Analysis by LMIC Livestock Marketing Information Center

3
Relative Changes in Beef & Cattle Prices
ALL COMPRE HENSIVE FRESH BOXED IA/MN IA RETAIL BEEF DIRECT 550 LB CUTOUT STEER CALF $/lb $/cwt 2008 $3.97 $151.05 $91.39 $122.56 2009 $3.89 $139.53 $82.44 $112.24 2010 $4.02 $154.24 $94.25 $130.02 2011 $4.44 $178.71 $115.02 $150.38 2012 $4.69 $187.95 $122.70 $169.29 2013 $4.94 $193.18 $125.80 $173.53 2014 $5.60 $236.02 $153.84 $253.26 2015 $6.04 $235.25 $147.24 $253.33 2016 $5.73 $202.22 $119.54 $168.56 YR/YR Change (%) -1.9% -7.6% -9.8% -8.4% 3.3% 10.5% 14.3% 15.8% 10.4% 15.9% 22.0% 15.7% 5.7% 5.2% 6.7% 12.6% 2.8% 2.5% 13.4% 22.2% 22.3% 45.9% 7.8% -0.3% -4.3% 0.0% -5.0% -14.0% -18.8% -33.4% Source: USDA/ERS, USDA/AMS
 -1.9% -7.6% -9.8% -8.4% 3.3% 10.5% 14.3% 15.8% 10.4% 15.9% 22.0% 15.7% 5.7% 5.2% 6.7% 12.6% 2.8% 2.5% 13.4% 22.2% 22.3% 45.9% 7.8% -0.3% -4.3% 0.0% -5.0% -14.0% -18.8% -33.4% Source: USDA/ERS, USDA/AMS.")
4
Data Source: USDA/ERS. FAPRI

5
2017 Beef Cattle Market Situation
Cow-calf: Converging toward long-term levels Though tremendous variability across producers Backgrounding: Varies widely across situations Opportunities but risk of owning cattle and managing risk Feedlot: Worst behind us, still some red ink Opportunities to ‘lock-in’ profits Keeping in position is key Cyclical price pendulum will swing back

6
Data Source: USDA/AMS

7
Source: National Drought Mitigation Center
7 7

8
Data Source: USDA/NASS

11
Cattle Crush Margin The Crush Margin is the return after the feeder steer and corn costs. Live weight: pounds Feeder weight: 750 pounds Corn: 50 bushels per head Source: ISU Extension

14
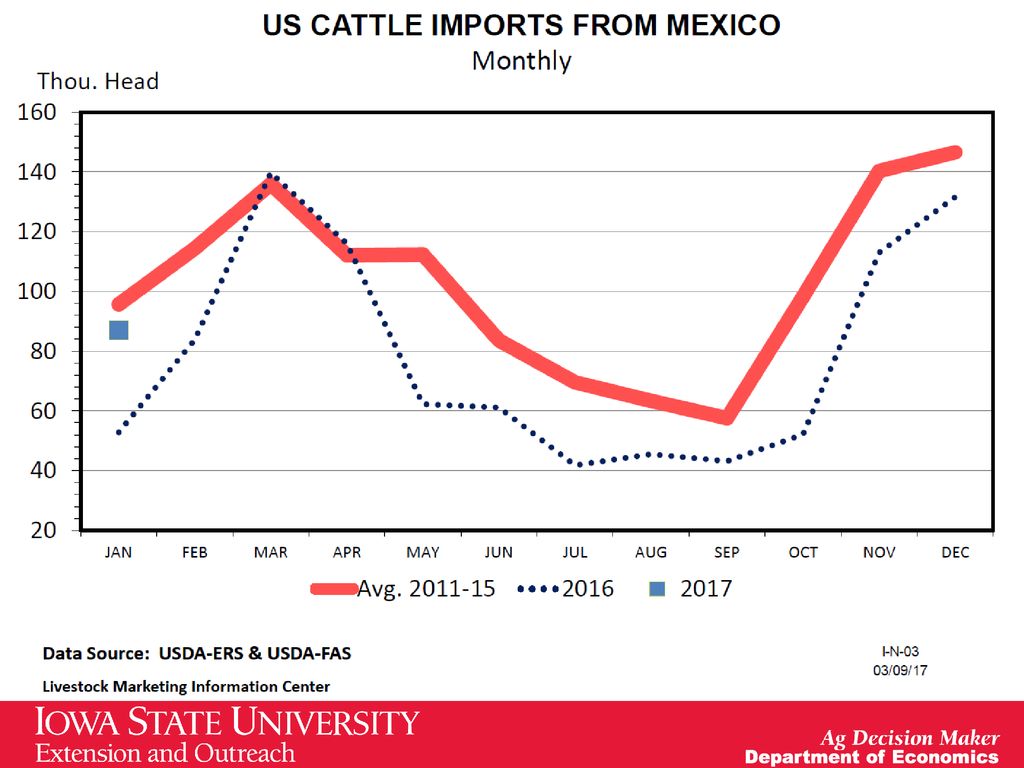
Data Source: USDA-ERS & USDA-FAS, Compiled & Analysis by LMIC
Livestock Marketing Information Center

15
Data Source: USDA-ERS & USDA-FAS, Compiled & Analysis by LMIC
Livestock Marketing Information Center

16
U.S. Corn Supply and Use 2013 2014 2015 2016 2017 Area Planted
(mil. acres) 95.4 90.6 88.0 94.0 90.0 Yield (bu./acre) 158.1 171.0 168.4 174.6 170.7 Production (mil. bu.) 13,829 14,216 13,602 15,148 14,065 Beg. Stocks 821 1,232 1,731 1,737 2,320 Imports 36 32 67 55 50 Total Supply 14,686 15,479 15,401 16,940 16,435 Feed & Residual 5,040 5,280 5,120 5,550 5,450 Ethanol 5,124 5,200 5,224 5,400 Food, Seed, & Other 1,369 1,401 1,422 1,445 1,470 Exports 1,920 1,867 1,898 2,225 1,900 Total Use 13,454 13,748 13,664 14,620 14,220 Ending Stocks 2,215 Season-Average Price ($/bu.) 4.46 3.70 3.61 3.40 3.50 Source: USDA-WAOB , USDA-OCE 2017 16 16
 Yield. (bu./acre) Production. (mil. bu.) 13, , , , ,065. Beg. Stocks ,232. 1,731. 1,737. 2,320. Imports Total Supply. 14, , , , ,435. Feed & Residual. 5,040. 5,280. 5,120. 5,550. 5,450. Ethanol. 5,124. 5,200. 5,224. 5,400. Food, Seed, & Other. 1,369. 1,401. 1,422. 1,445. 1,470. Exports. 1,920. 1,867. 1,898. 2,225. 1,900. Total Use. 13, , , , ,220. Ending Stocks. 2,215. Season-Average Price. ($/bu.) Source: USDA-WAOB , USDA-OCE")
17
U.S. Soybean Supply and Use
2013 2014 2015 2016 2017 Area Planted (mil. acres) 76.8 83.3 82.7 83.4 88.0 Yield (bu./acre) 44.0 47.5 48.0 52.1 Production (mil. bu.) 3,358 3,927 3,926 4,307 4,180 Beg. Stocks 141 92 191 197 435 Imports 72 33 24 25 Total Supply 3,570 4,052 4,140 4,528 4,640 Crush 1,734 1,873 1,886 1,940 1,945 Seed & Residual 107 146 122 128 135 Exports 1,638 1,842 1,936 2,025 2,125 Total Use 3,478 3,862 3,944 4,093 4,205 Ending Stocks Season-Average Price ($/bu.) 13.00 10.10 8.95 9.60 Source: USDA-WAOB , USDA-OCE 2017 17 17
 Yield. (bu./acre) Production. (mil. bu.) 3,358. 3,927. 3,926. 4,307. 4,180. Beg. Stocks Imports Total Supply. 3,570. 4,052. 4,140. 4,528. 4,640. Crush. 1,734. 1,873. 1,886. 1,940. 1,945. Seed & Residual Exports. 1,638. 1,842. 1,936. 2,025. 2,125. Total Use. 3,478. 3,862. 3,944. 4,093. 4,205. Ending Stocks. Season-Average Price. ($/bu.) Source: USDA-WAOB , USDA-OCE")
18
Soy Yields Top: 2016 Yield Bottom: Change from last year
Units: Bushels/acre Source: USDA-NASS

19
U.S. Meat Trade Source: USDA-WAOB 19 19

20
Change in Corn Export Sales
Source: USDA-FAS

21
Change in Soybean Export Sales
Source: USDA-FAS

22
Corn Grind for Ethanol

23
Current Corn Futures 3.96 3.85 3.48 Source: CME Group, 3/21/2017

24
Current Soybean Futures
9.85 9.66 9.60 Source: CME Group, 3/21/2017

25
2016/17 Crop Margins @ Actual Yields

26
2017/18 Crop Margins

27
Iowa Corn Prices vs. Costs

28
Thank You! More information available at: Iowa Farm Outlook & News
Ag Decision Maker ISU Estimated Livestock Returns ISU Livestock Crush Margins

Similar presentations