Download presentation
Presentation is loading. Please wait.

1
Lecture On Signal Flow Graph
Submitted By: Ms. Anupam Mittal A.P., EE Deptt SBSSTC, Ferozepur

2
Flow of PPT What is Signal Flow Graph (SFG)?
Definitions of terms used in SFG Rules for drawing of SFG Mason’s Gain formula SFG from simultaneous eqns SFG from differential eqns Examples Solution of a problem by Block diagram reduction technique and SFG SFG from a given Transfer function

3
What is Signal Flow Graph?
SFG is a diagram which represents a set of simultaneous equations. This method was developed by S.J.Mason. This method does n’t require any reduction technique. It consists of nodes and these nodes are connected by a directed line called branches. Every branch has an arrow which represents the flow of signal. For complicated systems, when Block Diagram (BD) reduction method becomes tedious and time consuming then SFG is a good choice.
 reduction. method becomes tedious and time consuming then SFG. is a good choice.")
4
Comparison of BD and SFG
block diagram: signal flow graph: Only one time SFG is to be drawn and then Mason’s gain formula is to be evaluated. So time and space is saved. In this case at each step block diagram is to be redrawn. That’s why it is tedious method. So wastage of time and space.

5
SFG

6
Definition of terms required in SFG
Node: It is a point representing a variable. x2 = t 12 x1 +t32 x3 X1 X2 X3 t12 t32 In this SFG there are 3 nodes. Branch : A line joining two nodes. X1 X2 Input Node : Node which has only outgoing branches. X1 is input node.

7
Output node/ sink node: Only incoming branches
Output node/ sink node: Only incoming branches. Mixed nodes: Has both incoming and outgoing branches. Transmittance : It is the gain between two nodes. It is generally written on the branch near the arrow. t12 X1 t23 X3 X4 X2 t34 t43

8
Path : It is the traversal of connected branches in the direction
of branch arrows, such that no node is traversed more than once. Forward path : A path which originates from the input node and terminates at the output node and along which no node is traversed more than once. Forward Path gain : It is the product of branch transmittances of a forward path. P 1 = G1 G2 G3 G4, P 2 = G5 G6 G7 G8

9
Non-touching loops are L1 & L2, L1 & L3, L2 &L3
Loop : Path that originates and terminates at the same node and along which no other node is traversed more than once. Self loop: Path that originates and terminates at the same node. Loop gain: it is the product of branch transmittances of a loop. Non-touching loops: Loops that don’t have any common node or branch. L 1 = G2 H L 2 = H3 L3= G7 H7 Non-touching loops are L1 & L2, L1 & L3, L2 &L3

10
SFG terms representation
input node (source) input node (source) mixed node forward path path loop branch node transmittance
 input node (source) mixed node. forward path. path. loop. branch. node. transmittance.")
11
Rules for drawing of SFG from Block diagram
All variables, summing points and take off points are represented by nodes. If a summing point is placed before a take off point in the direction of signal flow, in such a case the summing point and take off point shall be represented by a single node. If a summing point is placed after a take off point in the direction of signal flow, in such a case the summing point and take off point shall be represented by separate nodes connected by a branch having transmittance unity.

12
Mason’s Gain Formula A technique to reduce a signal-flow graph to a single transfer function requires the application of one formula. The transfer function, C(s)/R(s), of a system represented by a signal-flow graph is k = number of forward path Pk = the kth forward path gain ∆ = 1 – (Σ loop gains) + (Σ non-touching loop gains taken two at a time) – (Σ non-touching loop gains taken three at a time)+ so on . ∆ k = 1 – (loop-gain which does not touch the forward path)
/R(s), of a system represented by a. signal-flow graph is. k = number of forward path. Pk = the kth forward path gain. ∆ = 1 – (Σ loop gains) + (Σ non-touching loop gains taken two at a time) – (Σ non-touching loop gains taken three at a time)+ so on . ∆ k = 1 – (loop-gain which does not touch the forward path)")
13
Ex: SFG from BD

14
EX: To find T/F of the given block diagram

15
Identification of Forward Paths
P 1 = 1.1.G1 .G 2 . G3. 1 = G1 G2 G3 P 2 = 1.1.G 2 . G 3 . 1 = G 2 G3

16
Individual Loops L 1 = G 1G 2 H 1 L 2 = - G 2G 3 H 2 L 3 = - G 4 H 2

17
L 4 = - G 1 G 4 L 5 = - G 1 G 2 G 3

18
Construction of SFG from simultaneous equations

19
t21 t 23 t31 t32 t33

21
After joining all SFG

22
SFG from Differential equations
Consider the differential equation Step 1: Solve the above eqn for highest order Step 2: Consider the left hand terms (highest derivative) as dependant variable and all other terms on right hand side as independent variables. Construct the branches of signal flow graph as shown below:- 1 -5 -2 -3 (a)
 as dependant variable and all other terms on right hand side as independent variables. Construct the branches of signal flow graph as shown below: (a)")
23
Step 3: Connect the nodes of highest order derivatives to the lowest order der.node and so on. The flow of signal will be from higher node to lower node and transmittance will be 1/s as shown in fig (b) 1 -2 -5 -3 1/s (b) Step 4: Reverse the sign of a branch connecting y’’’ to y’’, with condition no change in T/F fn.
 Step 4: Reverse the sign of a branch connecting y’’’ to y’’, with condition no change in T/F fn.")
24
Step5: Redraw the SFG as shown.

25
Problem: to find out loops from the given SFG

26
Ex: Signal-Flow Graph Models

27
P 1 = P 2 =

28
Individual loops L 1 = G2 H2 L 4 = G7 H7 L 3 = G6 H6 L 2= G3 H3 Pair of Non-touching loops L 1L L 1L 4 L2 L L 2L 4

30
Ex:

31
Forward Paths

32
Loops L1= -G 5 G 6 H 1 L 2 = -G2 G 3G 4G 5 H2 L 3 = -G 8 H 1

33
Loops L 6 = - G 1G2 G 3G 4G 8 H3 L 7 = - G 1G2 G 7G 6 H3
L 8= - G 1G2 G 3G 4G 5 G 6 H3

34
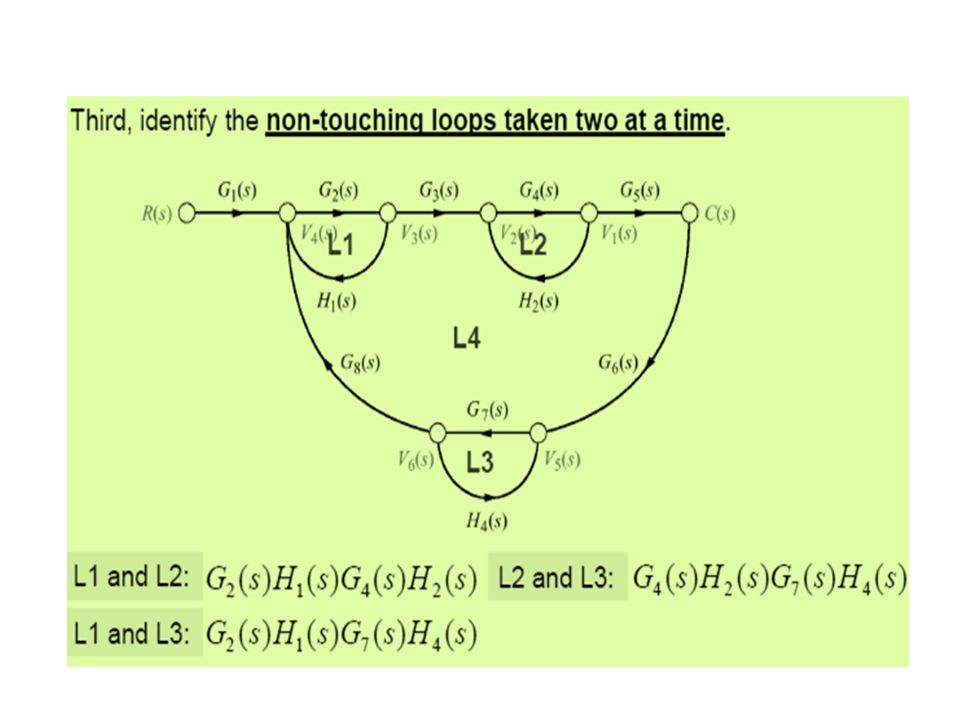
Pair of Non-touching loops
L 4L 5 L 4 L 7 L 3 L 4 L 5L 7 L 3L 4

35
Non-touching loops for paths
∆ 1 = 1 ∆ 2= -G 4 H4 ∆ 3= 1

36
Signal-Flow Graph Models

37
Block Diagram Reduction Example
_ +

38
R

40
R

41
R

42
_ +

44
Solution for same problem by using SFG

45
Forward Path P 1 = G 1 G 2 G3

46
Loops L 1 = G 1 G 2 H1 L 2 = - G 2 G3 H2

47
L 3 = - G 1 G 2 G3 P 1 = G 1 G 2 G3 L 1 = G 1 G 2 H1 L 2 = - G 2 G3 H2 L 3 = - G 1 G 2 G3 ∆1 = 1 ∆ = 1- (L1 + L 2 +L 3 ) T.F= (G 1 G 2 G3 )/ [1 -G 1 G 2 H1 + G 1 G 2 G3 + G 2 G3 H2 ]
 T.F= (G 1 G 2 G3 )/ [1 -G 1 G 2 H1 + G 1 G 2 G3 + G 2 G3 H2 ]")
48
SFG from given T/F

49
Ex:

55
Thanks

56
Example of block diagram
Step 1: Shift take off point from position before a block G4 to position after block G4

57
Step2 : Solve Yellow block.
Step3: Solve pink block. Step4: Solve pink block.

Similar presentations


 Why SFG? Block Diagrams are adequate for representation, but cumbersome. SFG provides the relation between system.>")


