Download presentation
Presentation is loading. Please wait.

1
3/20/2003CVEN 349 - Maxwell 1 PERT – Program Evaluation & Review Technique Module: 03-04 PERT Modified: February 20, 2003

2
3/20/2003CVEN 349 - Maxwell 2 Purpose: Introduce the ideas that: Construction is a variable process. – there are few constants. These variations cause risk in estimating any outcome. And There are ways to deal with that risk.

3
3/20/2003CVEN 349 - Maxwell 3 Learning Objectives: Assuming a normal distribution, be able to make statistical inferences about estimated completion times, based on variable task times.

4
3/20/2003CVEN 349 - Maxwell 4 PERT – Basic Concept First used by NASA to Flow-Chart and Schedule their projects. Approach is used for projects where the activity durations and costs are largely guess work – that is, SWAGs. Works surprising well on large projects because of the math and statistics.

5
3/20/2003CVEN 349 - Maxwell 5 Basic Statistical Ideas Mean = X-bar = (Lo + 4*ML + Hi)/6 S.D. = sigma = (Hi – Lo)/6 Lo = Estimate for Minimum Value ML = Estimate for Most Likely Value Hi = Estimate for Maximum Value Use the Delphi Technique or some other systematic process to get estimates for Lo, ML, Hi Central Limit Theorem (CTL) forces Normality
/6 Lo = Estimate for Minimum Value ML = Estimate for Most Likely Value Hi = Estimate for Maximum Value Use the Delphi Technique or some other systematic process to get estimates for Lo, ML, Hi Central Limit Theorem (CTL) forces Normality.")
6
1. Take a standard process activity flow diagram.

7
2. Add Time Estimates from Delphi or other technique.

8
3. Apply to Activity Diagram and Find Critical Path

9
3/20/2003CVEN 349 - Maxwell 9 Central Limit Theorem Given N samples of size M drawn from the same population of unknown distribution. The Mean of the distribution of the sample means (DSM) is an unbiased estimator of the population mean. The Variance of the DSM is an unbiased estimator of the Variance of the population divided by the sample size M. Standard Deviation = SQRT of the Variance The DSM approaches normal as M approaches infinity. M = 30 is generally OK.
 is an unbiased estimator of the population mean. The Variance of the DSM is an unbiased estimator of the Variance of the population divided by the sample size M. Standard Deviation = SQRT of the Variance The DSM approaches normal as M approaches infinity. M = 30 is generally OK..")
10
3/20/2003CVEN 349 - Maxwell 10 The Problem is the Shape of the Curve – What Distribution? We assume Normal for ease of use but the tails are too thin causing an underestimation of extreme cases. A Triangular is easier to use but the tails are too fat causing over- estimation of extreme cases. A gamma distribution appears a best fit to most unsymmetrical cases.

11
3/20/2003CVEN 349 - Maxwell 11 4. Find Expected Duration

13
3/20/2003CVEN 349 - Maxwell 13 5. Make Statistical Inferences

14
3/20/2003CVEN 349 - Maxwell 14 … … The application to construction should be obvious.

15
3/20/2003CVEN 349 - Maxwell 15 Class Exercise Stay in your seat. Independently, Guess at the length of the class room and write it down on a piece of paper. As Tables of (3 or 4), write down your best guess for the: Lo, ML, Hi Report them to me by groups of 4 (teams).
, write down your best guess for the: Lo, ML, Hi Report them to me by groups of 4 (teams)..")
16
3/20/2003CVEN 349 - Maxwell 16 Record of Past Guesses for Room 110 CEB Lo = ML = Hi = Length = Variance = Prob. of being within +/-.5-ft. =

17
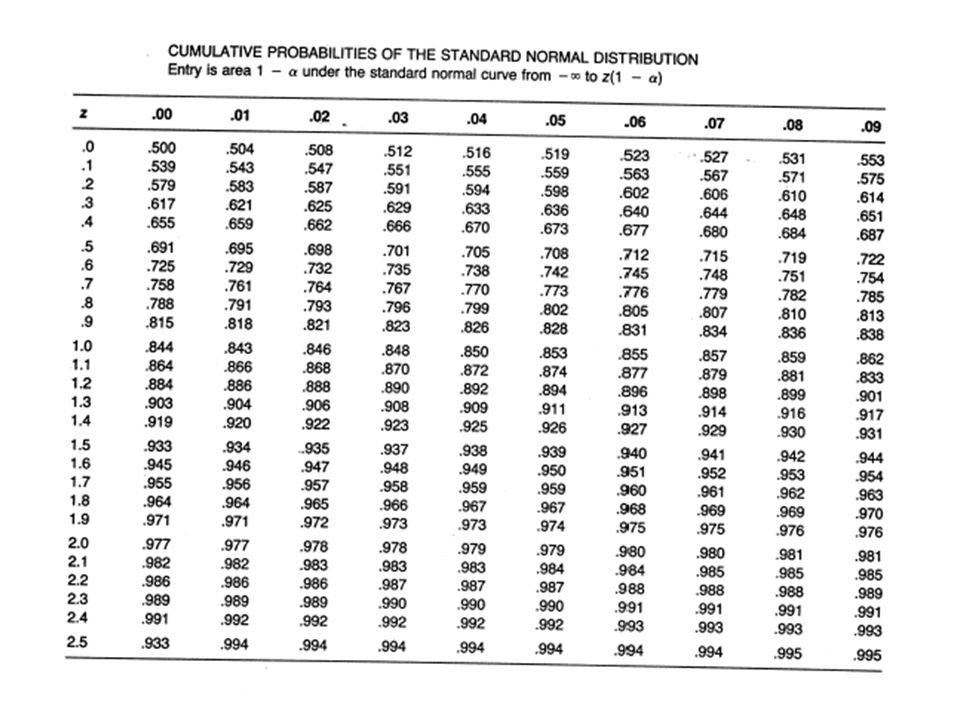
3/20/2003CVEN 349 - Maxwell 17 Probability Calculations Z = (X – X-bar)/Sigma =.5/sigma Look-up Probability in Normal or T table Adjust for Table Orientation but Usually you double it.
/Sigma =.5/sigma Look-up Probability in Normal or T table Adjust for Table Orientation but Usually you double it.")
19
3/20/2003CVEN 349 - Maxwell 19 Class Assessment Take out a piece of paper and write 1 sentence on the least clear topic of the day … Pass it forward.

Similar presentations