Download presentation
Presentation is loading. Please wait.

1
Bioinformatics and Computer Science Ina Koch TFH Berlin, Masters course Bioinformatics http://www.tfh-berlin.de/bi/ Cottbus, 8 th of October 2004

2
Outline Introduction SNP analysis in the human genome Dynamic programming as basis for sequence comparison Summary and outlook

3
Bioinformatics-Computational Biology Data collection and storage - data base techniques, integrative, data bases Data visualisation - computer graphics, molecule graphics MicroArray analysis – pattern recognition, statistics Data analysis sequence - string algorithms, dynamic programming structure - graph theory, AI, knowledge acquisition networks - graph theory, Petri nets, computer algebra Drug Design, Molecular Modelling - parallel algorithms

4
Outline Introduction SNP analysis in the human genome Dynamic programming as basis for sequence comparison Summary and outlook

5
SNP analysis in the human genome The average human being exhibits ~100 new mutations. The mutation of one nucleotide (point mutation) in the genome: Single Nucleotide Polymorphism - SNP, if it occurs with more than 1% in a population. non-synonymous: causes a mutation of the amino acid TTT - Phe TTA - Leu synonymous: codes the same amino acid TTT - Phe TTC - Phe
 in the genome: Single Nucleotide Polymorphism - SNP, if it occurs with more than 1% in a population. non-synonymous: causes a mutation of the amino acid TTT - Phe TTA - Leu synonymous: codes the same amino acid TTT - Phe TTC - Phe.")
6
SNPs – some numbers Two individuals: some millions nucleotide differences ~ 100,000 amino acid differences Within a population: 1/300 bp differences ~ half of the SNPs in coding regions are none-synonymous. In two equal chromosomes: 1/1000 bp differences (nucleotide-variety) Most frequent type: transition C T (G A) 2/3 of all SNPs
 Most frequent type: transition C T (G A) 2/3 of all SNPs.")
7
Why SNPs are interesting? Medical questions CD - CV hypothesis (Common Disease - Common Variant) Example: ApoE*E4 allele of Alzheimers disease How many SNPs are associated with diseases? How can we identify these SNPs? Ho many none-synonymous SNPs are damaging the structure or function of the protein? How can we identify these SNPs?
 Example: ApoE*E4 allele of Alzheimers disease How many SNPs are associated with diseases. How can we identify these SNPs. Ho many none-synonymous SNPs are damaging the structure or function of the protein. How can we identify these SNPs .")
8
A disease causing SNP The human Hemochromatosis protein (1A6Z) Frequency: ~ 6% in north Europe ~ 14% in Irland
 Frequency: ~ 6% in north Europe ~ 14% in Irland")
9
Search for SNPs in data bases SWISS-PROT Data bases OMIM HGBASE dbSNP HSSP Filter Keywords: 3D STRUCTURE and DISEASE MUTATION Results Keywords: 3D STRUCTURE and POLYMORPHISM, but not DISEASE MUTATION Allelic variants with >1% frequency in normal humans BLASTX search against HSSP Search for close homologues (>95% similarity) in other species for all until now selec- ted proteins and mutations 1 551 disease causing mutations 459 allelic variants 440 neutral mutations between species
 in other species for all until now selec- ted proteins and mutations disease causing mutations 459 allelic variants 440 neutral mutations between species")
10
Prediction of function- damaging effect Active sites, binding sites Analysis of the multiple alignment Disulfide bridges Hydrophobicity in the protein core Solvent accessibility Interactions with hetero atoms

11
The amino acid variant is function-damaging, if 1.it is located in a region annotated in SWISS-PROT as ACTIVE_SITE, BINDING_SITE, SITE, MOD_RES, DISULFID, METAL or 2. it is not compatible with the amino acid substitutions at the same position of homologous proteins, or 3. it is located inside of the protein core and causes a change in the electrostatic potential, or 4. it is located at the protein surface and changes the surface accessibility of the protein, or 5. it concerns a proline residue in a helix, or 6. its minimal distance to hetero atoms (except water) < 6 Å. Prediction rules
 < 6 Å. Prediction rules.")
12
Results total predicted absolute percent Disease causing 60 54 90 Mutations Function-damaging 54 43 80 mutations artificially generated Control predictions on proteins with known function-damaging mutations

13
Results total as function-damaging predicted absolute percent All Polymorphisms 459 156 34 Experimentally proved 245 79 32 Polymorphisms

14
False-negative predictions isoleucine

15
False-negative predictions serine

16
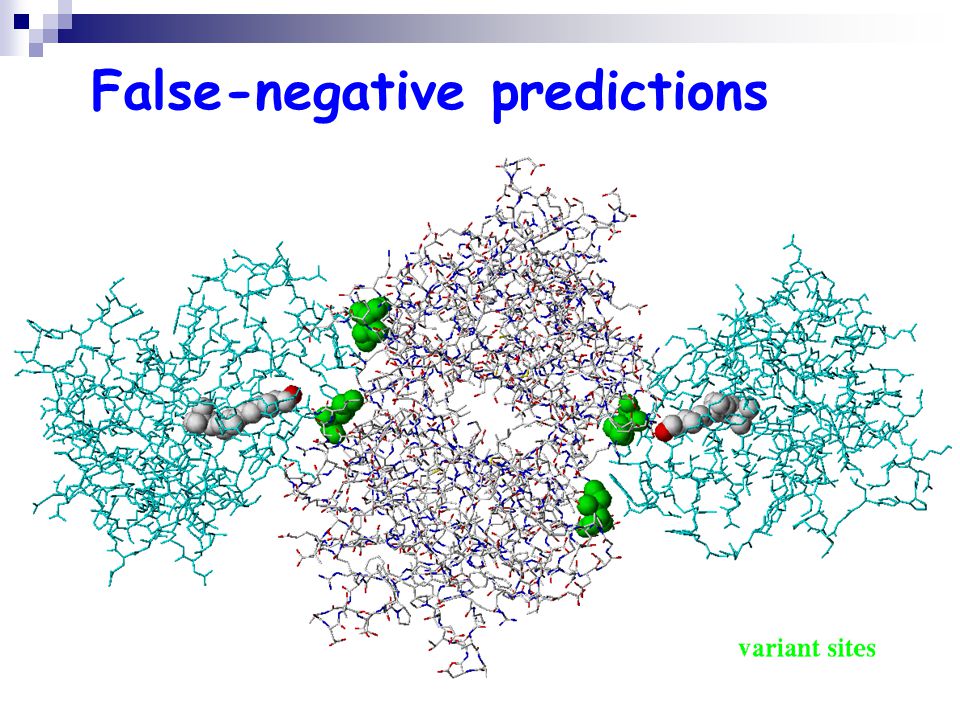
False-negative predictions K A L G I S P F H E Homo sapiens K S L G I S P F H E Ovis aries K G L G L S P F H E Gallus gallus K T F G I S P F H E Sminthopsis macroura K A L G V S P F H E Petaurus breviceps K K L G L T P F H E Rana catesbiana T N Q G S T P F H E Sparus aurata K K Q N L E S F F P Escherichia coli E S K J L D T F F P Salmonella dublin K A K N V E S F Y P Caenorhabelzis elegans Part of the multiple alignment of the human transthyretin

17
False-negative predictions

20
Outline Introduction SNP analysis in the human genome Dynamic programming as basis for sequence comparison Summary and outlook

21
Sequence Alignment Search for evolutionary or functional similarity Input: two nucleotide or amino acid sequences Desired output: biologically meaningful similarity Scoring of an alignment: Sum over all scores for each aligned pair and the gap penalties Score for amino acid pairs: substitution matrices (PAM, BLOSUM) Difficulty to set gap penalties Search for the optimal global alignment
 Difficulty to set gap penalties Search for the optimal global alignment")
22
Sequence Alignment Human alpha globin and human beta globin: true HBA_HUMAN GSAQVKGHGKKVADALTNAVAHVDDMPNALSALSDLHAHKL G+ +VK+HGKKV A+++++AH+D++LS+LH KL HBB_HUMAN GNPKVKAHGKKVLGAFSDGLAHLDNLKGTFATLSELHCDKL Human alpha globin and leghaemoglobin from yellow lupin: true Human alpha globin and leghaemoglobin from yellow lupin: true HBA_HUMAN GSAQVKGHGKKVADALTNAVAHV---D--DMPNALSALSDLHAHKL HBA_HUMAN GSAQVKGHGKKVADALTNAVAHV---D--DMPNALSALSDLHAHKL ++ ++++H+ KV + +A ++ +L+ L+++H+ K ++ ++++H+ KV + +A ++ +L+ L+++H+ K LGB2_LUPLU NNPELQAHAGKVFKLVYEAAIQLQVTGVVVTDATLKNLGSVHVSKG LGB2_LUPLU NNPELQAHAGKVFKLVYEAAIQLQVTGVVVTDATLKNLGSVHVSKG Human alpha globin and glutathione S-transferase: false HBA_HUMANGSAQVKGHGKKVADALTNAVAHVDDMPNALSALSD----LHAHKL HBA_HUMAN GSAQVKGHGKKVADALTNAVAHVDDMPNALSALSD----LHAHKL GS+ + G + +D L ++ H+ D+ A +AL D ++AH+ GS+ + G + +D L ++ H+ D+ A +AL D ++AH+ F11G11.2 GSGYLVGDSLTFVDLL--VAQHTADLLAANAALLDEFPQFKAHQE

23
Dynamic Programming Application to optimisation problems Development of an dynamic programming algorithm (1) characterise the structure of an optimal solution (2) recursively define the value of an optimal solution (3) compute the value of an optimal solution in a bottom-up fashion (4) construct an optimal solution from computed information
 characterise the structure of an optimal solution (2) recursively define the value of an optimal solution (3) compute the value of an optimal solution in a bottom-up fashion (4) construct an optimal solution from computed information")
24
Dynamic Programming - Example M H E A G A W G H E E 0 -8 -16 -24 -32 -40 -48 -56 -64 -72 -80 P -8 –2 -1 -1 -2 -1 -4 -2 -2 -1 -1 A -16 -2 -1 5 0 5 -3 0 -2 -1 -1 W -24 -3 -3 -3 -3 -3 15 -3 -3 -3 -3 H -32 10 0 -2 -2 -2 -3 -2 10 0 0 E -40 0 6 -1 -3 -3 -1 -3 0 6 6 A -48 -2 -1 5 0 5 -3 0 -2 -1 -1 E -56 0 6 -1 -3 -3 -1 -3 0 6 6 Initialisation with BLOSUM50

25
Dynamic Programming - Example (1) Optimal solution: the alignment with the highest score (2) Recursive solution: Three ways an alignment can be extended up to ( i, j ) (a) x i aligned to y j (b) x i aligned to a gap (c) y j aligned to a gap F ( I - 1, j - 1 ) + s ( x i, y j ) M M ( i, j ) = max F ( i-1, j ) – d F (I, j-1 ) – d d: gap penalty, s ( x i, y j ): score of the pair ( x i, y j ) {
 Optimal solution: the alignment with the highest score (2) Recursive solution: Three ways an alignment can be extended up to ( i, j ) (a) x i aligned to y j (b) x i aligned to a gap (c) y j aligned to a gap F ( I - 1, j - 1 ) + s ( x i, y j ) M M ( i, j ) = max F ( i-1, j ) – d F (I, j-1 ) – d d: gap penalty, s ( x i, y j ): score of the pair ( x i, y j ) {")
26
Dynamic Programming - Example M H E A G A W G H E E 0 -8 -16 -24 -32 -40 -48 -56 -64 -72 -80 P -8 –2 -1 -1 -2 -1 -4 -2 -2 -1 -1 A -16 -2 -1 5 0 5 -3 0 -2 -1 -1 W -24 -3 -3 -3 -3 -3 15 -3 -3 -3 -3 H -32 10 0 -2 -2 -2 -3 -2 10 0 0 E -40 0 6 -1 -3 -3 -1 -3 0 6 6 A -48 -2 -1 5 0 5 -3 0 -2 -1 -1 E -56 0 6 -1 -3 -3 -1 -3 0 6 6 Computation of M ( 1, 1 )
")
27
Dynamic Programming - Example M H E A G A W G H E E 0 -8 -16 -24 -32 -40 -48 -56 -64 -72 -80 P -8 –2 -9 -1 -2 -1 -4 -2 -2 -1 -1 A -16 -2 -1 5 0 5 -3 0 -2 -1 -1 W -24 -3 -3 -3 -3 -3 15 -3 -3 -3 -3 H -32 10 0 -2 -2 -2 -3 -2 10 0 0 E -40 0 6 -1 -3 -3 -1 -3 0 6 6 A -48 -2 -1 5 0 5 -3 0 -2 -1 -1 E -56 0 6 -1 -3 -3 -1 -3 0 6 6 Computation of M ( 1, 2 )
")
28
Dynamic Programming - Example M H E A G A W G H E E 0 -8 -16 -24 -32 -40 -48 -56 -64 -72 -80 P -8 –2 -9-17 -2 -1 -4 -2 -2 -1 -1 A -16 -2 -1 5 0 5 -3 0 -2 -1 -1 W -24 -3 -3 -3 -3 -3 15 -3 -3 -3 -3 H -32 10 0 -2 -2 -2 -3 -2 10 0 0 E -40 0 6 -1 -3 -3 -1 -3 0 6 6 A -48 -2 -1 5 0 5 -3 0 -2 -1 -1 E -56 0 6 -1 -3 -3 -1 -3 0 6 6 Computation of M ( 1, 3 )
")
29
Dynamic Programming - Example M H E A G A W G H E E 0 -8 -16 -24 -32 -40 -48 -56 -64 -72 -80 P -8 –2 -9-17-25 -1 -4 -2 -2 -1 -1 A -16 -2 -1 5 0 5 -3 0 -2 -1 -1 W -24 -3 -3 -3 -3 -3 15 -3 -3 -3 -3 H -32 10 0 -2 -2 -2 -3 -2 10 0 0 E -40 0 6 -1 -3 -3 -1 -3 0 6 6 A -48 -2 -1 5 0 5 -3 0 -2 -1 -1 E -56 0 6 -1 -3 -3 -1 -3 0 6 6 Computation of M ( 1, 4 )
")
30
Dynamic Programming - Example M H E A G A W G H E E 0 -8 -16 -24 -32 -40 -48 -56 -64 -72 -80 P -8 –2 -9 -17 -25 -33 -42 -49 -57 -65 -73 A -16 -10 -3 -4 -12 -20 -28 -36 -44 -52 -60 W -24 -18 -11 -6 -7 -15 -5 -13 -21 -29 -37 H -32 -14 -18 -13 -8 -9 -13 -7 -3 -11 -19 E -40 -22 -8 -16 -16 -9 -12 -15 -7 3 -5 A -48 -30 -16 -3 -11 -11 -12 -12 -15 -5 2 E -56 -38 -24 -11 -6 -12 -14 -15 -12 -9 1 The completely calculated matrix

31
Dynamic Programming - Example M H E A G A W G H E E 0 -8 -16 -24 -32 -40 -48 -56 -64 -72 -80 P -8 –2 -9 -17 -25 -33 -42 -49 -57 -65 -73 A -16 -10 -3 -4 -12 -20 -28 -36 -44 -52 -60 W -24 -18 -11 -6 -7 -15 -5 -13 -21 -29 -37 H -32 -14 -18 -13 -8 -9 -13 -7 -3 -11 -19 E -40 -22 -8 -16 -16 -9 -12 -15 -7 3 -5 A -48 -30 -16 -3 -11 -11 -12 -12 -15 -5 2 E -56 -38 -24 -11 -6 -12 -14 -15 -12 -9 1 Computation of the optimal alignment path HEAGAWGHE-E --P-AW-HEAE The optimal alignment

32
Dynamic Programming - Example Needleman/Wunsch – algorithm for global alignment Needleman & Wunsch (1970) J. Mol. Biol. 48:443-453. O(n 3 ) Gotoh – algorithm for global alignment O(n 2 ) Gotoh (1982) J. Mol. Biol. 162:705-708. Smith/Watermann – algorithm for local alignment Smith & Waterman (1981) J. Mol. Biol. 147:195-197. O(n 2 )
 Gotoh – algorithm for global alignment O(n 2 ) Gotoh (1982) J. Mol. Biol. 162: Smith/Watermann – algorithm for local alignment Smith & Waterman (1981) J. Mol. Biol. 147: O(n 2 ).")
33
Summary SNP analysis as typical example for bioinformatics Sunyaev, Ramensky, Lathe III., Kondrashov, Bork, Human Molecular Genetics (2001) 10:591-597. data base parsing multiple sequence alignment rule based system molecular modelling Application of dynamic programming to sequence alignment Gotoh algorithm for pair-wise global sequence alignment

34
Outlook Application of graph theory to protein structure analysis PTGL Protein Topology Graph Library http://sanaga.tfh-berlin.de/~ptgl/ptgl.html May, Barthel, Koch (2004) Bioinformatics, in press. Koch (2001) Theoretical Computer Science 250:1-30. Investigations of Alternative Splicing Boué, Vingron, Koch (2002) Bioinformatics, suppl.2, 18:S65-S75. Kriventseva, Koch, Apweiler, Vingron, Bork, Gelfand, Sunyaev (2003)Trends in Genetics 19:124-128.
 Theoretical Computer Science 250:1-30. Investigations of Alternative Splicing Boué, Vingron, Koch (2002) Bioinformatics, suppl.2, 18:S65-S75. Kriventseva, Koch, Apweiler, Vingron, Bork, Gelfand, Sunyaev (2003)Trends in Genetics 19:")
35
Outlook Modelling, analysis, and simulation of biological molecular networks using Petri net theory in co-operation with BTU Cottbus (Prof. M. Heiner) Voss, Heiner, Koch (2003) In Silico Biology 3:0031. Heiner, Koch, Will (2004) BioSystems, Special Issue 75(1-3):15-28. Heiner & Koch (2004) Proc. 25th ICAPTN, LNCS 3099:216-237. Koch, Junker, Heiner (2004) Bioinformatics, in press. Ongoing projects: 1. Human glycolysis with coloured Petri nets Thomas Runge 2. Metabolism in the human liver cell Daniel Schrödter 3. G1/S phase in the mammalian cell cycle Dr. Thomas Kaunath 4. Duchenne muscle dystrophy Stepfanie Grunwald
 Voss, Heiner, Koch (2003) In Silico Biology 3:0031. Heiner, Koch, Will (2004) BioSystems, Special Issue 75(1-3): Heiner & Koch (2004) Proc. 25th ICAPTN, LNCS 3099: Koch, Junker, Heiner (2004) Bioinformatics, in press. Ongoing projects: 1. Human glycolysis with coloured Petri nets Thomas Runge 2. Metabolism in the human liver cell Daniel Schrödter 3. G1/S phase in the mammalian cell cycle Dr. Thomas Kaunath 4. Duchenne muscle dystrophy Stepfanie Grunwald.")
36
Thank you!

Similar presentations


 Grants Chapter 6.>")


