Download presentation
Presentation is loading. Please wait.

1
Phase Diagram for Water

2
Hydrogen Bonding in Water

4
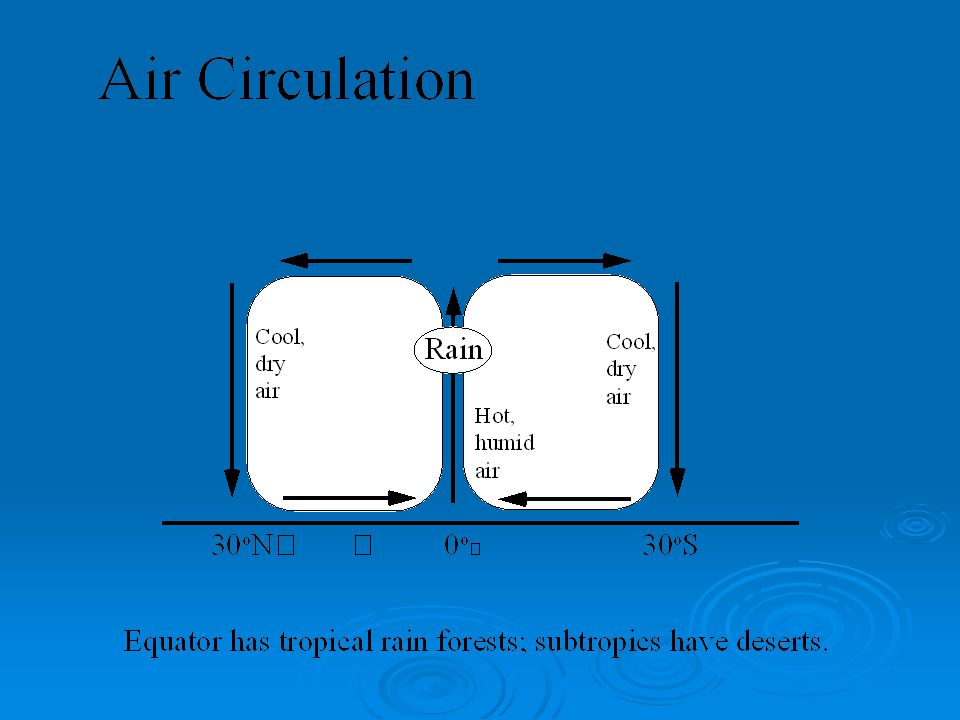
Transfer Processes and Storage (Reservoirs)
")
6
Rate of Addition or Removal
Residence Time Time to replace a substance in a reservoir, or average length of time a substance exists in a reservoir Total Amount Rate of Addition or Removal Water in atm. = 11 days Water on land = 1 year Water in oceans = 3500 years

7
Importance of Water Cycle to the Earth System
Transfers heat Sea level change Greenhouse gas Global warming will affect it Renewable resource; energy source Weathering and erosion agent Interacts with the Carbon Cycle

8
Energy Absorbed and Released During Phase Changes of Water

9
Difference in Heating of Land and Ocean

10
Summer Winter

13
A True Color Picture of Earth

14
amount size

15
Sea level also changes due to temperature.

18
Top Climate-Water Issues
Sea-level rise Snow-pack loss Redistribution of water resources Water vapor feedback

19
Ice Sheet Melting & Sea Level Rise

20
Rate of Sea Level Rise (Data from IPCC WGI Summary for Policymakers)
")
21
Sea-Level Rise and Water Supplies
Saltwater contamination of coastal ground-water wells Salinity encroachment on municipal water intakes from rivers Loss of glacial meltwater Coastal States

22
Composition of Natural Waters

23
Carbonate Equilibria: CO2 + H2O
CH3COOH H+ + CH3COO- CH2O + O2 => CO2 + H2O CO2 + H2O H2CO3 H2CO3 H+ + HCO3-

24
Chemical Weathering Limestones H2CO3 + CaCO3 <==> Ca+2 + 2HCO3-
Silicates 2H2CO3 + NaAlSi3O8 ==> Na+ + 2HCO3- + clay minerals 2H2CO3 + CaAl2Si2O8 ==> Ca+2 + 2HCO3- What happens to CO2 during chemical weathering? Role of water? pH of river water? Seawater?

25
Chemical Weathering

26
Chemical Composition of Seawater
Six major constituents Two anions - Cl-, SO4= Four cations - Na+, Mg+, Ca+2, K+ pH is buffered by CO2 - CaCO3 system

27
Rate of Addition or Removal
Residence Time Time to replace a substance in a reservoir, or average length of time a substance exists in a reservoir Total Amount Rate of Addition or Removal

29
Sources of Sea Salt Weathering of continents Volcanic eruptions
Hydrothermal vents

32
Oxygen Concentration Solubility depends on T and Salinity
Warm, saline water holds less O2 Oxygen consumption in water column Respiration by animals Mixing rate of oceans Sluggish mixing - low rate of O2 replenishment

33
Carbon Dioxide Concentration
Solubility depends on T and S CO2 is released by animals Mixing rate of oceans Affects pH of seawater (What is its pH?) Similar to concentration profiles of nutrients (PO4-3, NO3-)
 Similar to concentration profiles of nutrients (PO4-3, NO3-)")
34
X

37
CO2 in Seawater pH - function of dissolved CO2
Reacts with water to produce carbonic acid, which releases H+ ions CO2 + H2O H2CO3 H+ + HCO3- H+ + CO3-2 H2CO3 is carbonic acid, HCO3- is the bicarbonate ion and CO3-2 is the carbonate ion

38
CO2 in Seawater Carbonate system - buffers against large shifts in pH
Carbonates dissolve in deep water Higher CO2 makes the water less alkaline (pH ≈ 7.8) Warm, shallow water has less dissolved CO2 More alkaline than deep water (pH ≈ 8.2) Carbonate sediments are abundant
 Warm, shallow water has less dissolved CO2. More alkaline than deep water (pH ≈ 8.2) Carbonate sediments are abundant.")
39
Carbonate System

40
Precipitation of CaCO3 ---- HCO3- + OH- => CO3= + H2O

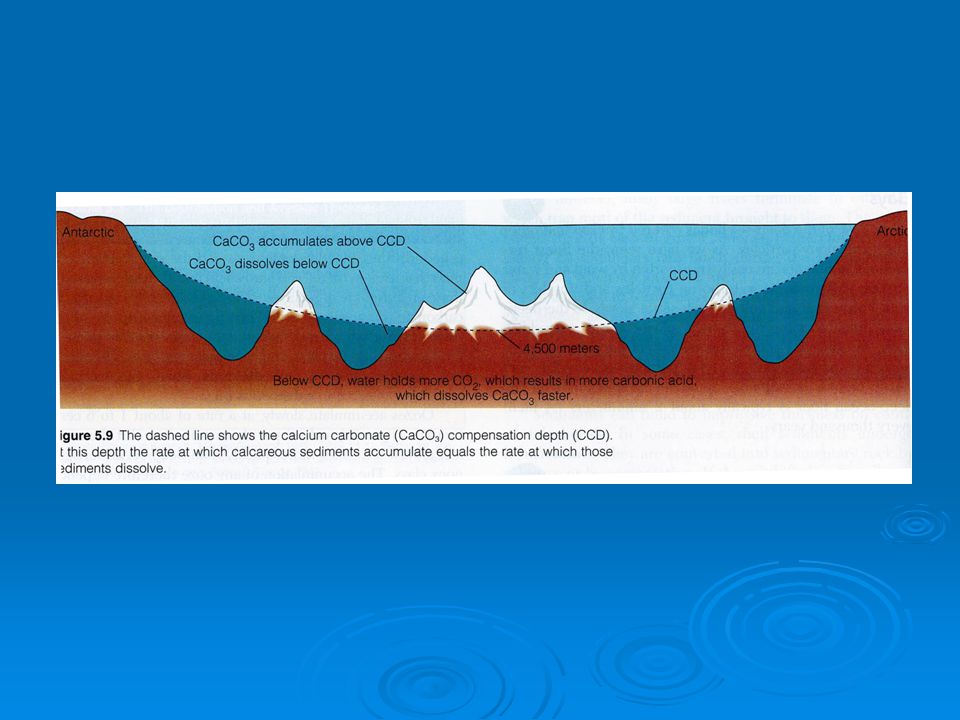
41
Calcite (or Calcium Carbonate) Compensation Depth (CCD)
CaCO3 dissolves in deeper water due to higher CO2 content in deep water Deepest sediments have little or no CaCO3 CCD is deeper (less dissolution) in the Atlantic Ocean than in the Pacific Why?
 in the Atlantic Ocean than in the Pacific. Why")
43
The Carbonate System

44
Changes in the CCD for the
Past 100 m.y.

Similar presentations


 because it mixes with CO 2 making water acidic Rain is naturally acidic (pH 5.6)>")


 - dissolves solids and gases readily (“universal solvent”) Addition of dissolved.>")
 We depend on ocean for: –Food & resources –Acts as barrier between continents.>")
 molecular properties:>")


 Residence time (approx) Nitrogen N 2 78.08%42,000,000 years Oxygen O 2 20.95%5,000.>")


Percent Ocean1370 97.3 Ice (polar) 29 2.1 Groundwater 5 0.4 Lakes 0.1 0.01 Atmosphere 0.01 0.001 Rivers0.0010.0001.>")

