Download presentation
Presentation is loading. Please wait.

1
WATER AUDIT DATA COLLECTION AND VALIDATION USING THE Awwa free water audit software© George KUNKEL, P.E. WATER EFFICIENCY PROGRAM MANAGER PHILADELPHIA Water DEPARTMENT 11/29/2012

2
Compiling the Annual IWA/AWWA Water Audit
Focus of this Section The AWWA Free Water Audit Software© Data collection Data gradings Data Validation AWWA Compiler Software© AWWA North American Validated Dataset Regions requiring water audit data collection for large numbers of water utilities California Urban Water Conservation Council – as part of Best Management Practice 1.0 for Utility Operations Programs, section 1.2 Water Loss Control Texas: Texas Water Development Board (2005) TWDB-specific form; similar to AWWA Free Water Audit Software© Georgia: Under the Water Stewardship Act (2012); initial data is being analyzed Delaware River Basin Commission: launching in 2013 These efforts offer a frame of reference and opportunity for learning further about the water audit data collection process
 TWDB-specific form; similar to AWWA Free Water Audit Software© Georgia: Under the Water Stewardship Act (2012); initial data is being analyzed. Delaware River Basin Commission: launching in These efforts offer a frame of reference and opportunity for learning further about the water audit data collection process.")
3
IWA/AWWA Water Audit Method: Water Balance
Imported Own Sources Total System Input ( allow for known errors ) (allow errors) Supplied Exported Losses Authorized Consumption Authorized Consumption Billed Authorized Consumption Revenue Water Billed Water Exported Billed Metered Consumption Billed Unmetered Consumption Unbilled Authorized Consumption Non- Revenue Water Unbilled Metered Consumption Unbilled Unmetered Consumption Water Losses Apparent Losses Unauthorized Consumption Customer Metering Inaccuracies Systematic Data Handling Error Real Losses Leakage on Mains Leakage on Service Lines Leakage & Overflows at Storage
 (allow. errors) Supplied. Exported. Losses. Authorized. Consumption. Authorized. Consumption. Billed. Authorized. Consumption. Revenue. Water. Billed Water Exported. Billed Metered Consumption. Billed Unmetered Consumption. Unbilled. Authorized. Consumption. Non- Revenue. Water. Unbilled Metered Consumption. Unbilled Unmetered Consumption. Water. Losses. Apparent. Losses. Unauthorized Consumption. Customer Metering Inaccuracies. Systematic Data Handling Error. Real. Losses. Leakage on Mains. Leakage on Service Lines. Leakage & Overflows at Storage.")
4
Best Practice Tools for Water Loss Control
AWWA M36 Publication Water Audits and Loss Control Programs (2009), 3rd Edition features the IWA/AWWA Water Audit Methodology AWWA Water Loss Control Committee’s Free Water Audit Software© Current version is 4.2 in English and French languages Includes data grading capability Companion “Compiler” Software Water Research Foundation Reports Project 4372: Leakage Component Analysis is currently being executed Textbooks - type “water loss control” in search box; select first item in list
, 3rd Edition features the IWA/AWWA Water Audit Methodology. AWWA Water Loss Control Committee’s Free Water Audit Software© Current version is 4.2 in English and French languages. Includes data grading capability. Companion Compiler Software. Water Research Foundation Reports. Project 4372: Leakage Component Analysis is currently being executed. Textbooks. - type water loss control in search box; select first item in list.")
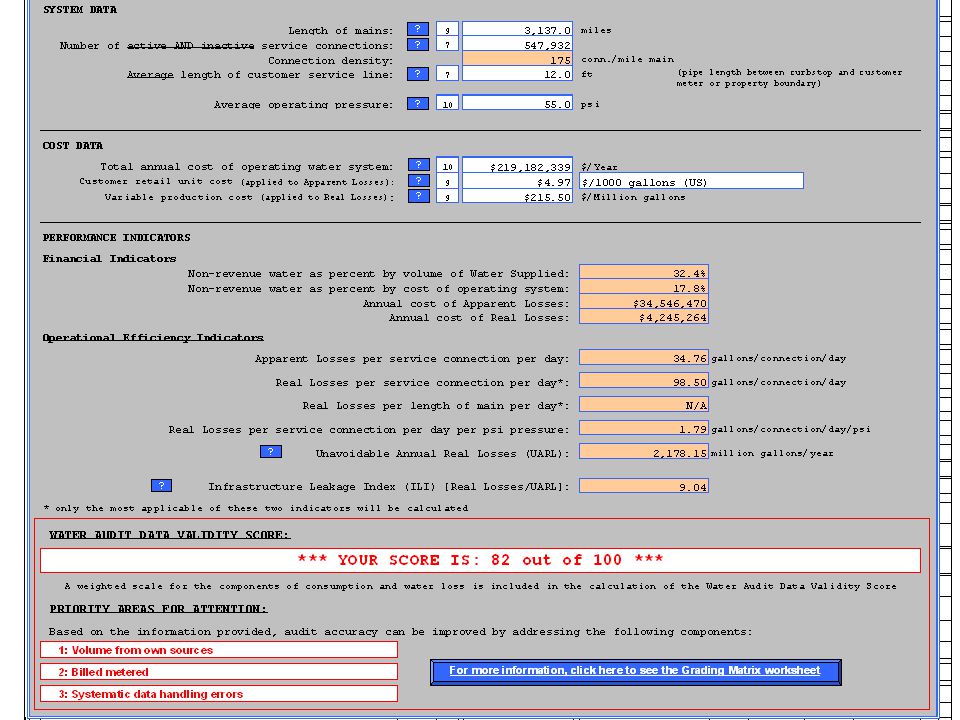
5
Reporting Worksheet

7
Grading “Volume from own Sources” quantity
WATER SUPPLIED << Enter grading in column 'E' Volume from own sources: 7 94, Million gallons (US)/yr (MG/Yr) Master meter error adjustment (enter positive value): 10 2, over-registered Water imported: n/a 0.000 MG/Yr Water exported: 7, WATER SUPPLIED: 84, ? ? ? Data Grading Criteria for “Volume from own Sources”
/yr (MG/Yr) Master meter error adjustment (enter positive value): 10. 2, over-registered. Water imported: n/a MG/Yr. Water exported: 7, WATER SUPPLIED: 84, Data Grading Criteria for Volume from own Sources")
8
Grading “Master Meter Error Adjustment” quantity
WATER SUPPLIED << Enter grading in column 'E' Volume from own sources: 7 94, Million gallons (US)/yr (MG/Yr) Master meter error adjustment (enter positive value): 10 2, over-registered Water imported: n/a 0.000 MG/Yr Water exported: 7, WATER SUPPLIED: 84, ? ? ? Data Grading Criteria for “Master Meter Error Adjustment”
/yr (MG/Yr) Master meter error adjustment (enter positive value): 10. 2, over-registered. Water imported: n/a MG/Yr. Water exported: 7, WATER SUPPLIED: 84, Data Grading Criteria for Master Meter Error Adjustment")
9
The Grading Matrix – grading data and seeking improved data validity

10
AWWA Free Water Audit Software© Grading Matrix Guidance on Use of Water Audit Data

11
Water Audit – Keys to Reliable Data Collection
Steps to set procedures for reliable water audit data collection Set reliable inhouse procedures Watch for “flagged” data in the AWWA Free Water Audit Software© Built-in checks in the software help alert the auditor to data issues Water audit components to watch: Production Metering – “Volume from Own Sources” and “Water Imported” quantities Exported water quantity Unbilled authorized consumption Systematic Data Handling Error Length of Private Pipe Annual Cost of Operating the Water System Be objective in grading all components – refer to the grading matrix criteria

12
Data Collection – Setting Reliable Inhouse Data Collection Procedures
When launching the auditing process, it is important to bring together the utility staff most familiar with: Production Metering Customer Metering Customer Billing Distribution System operations & leak detection Mapping/Geographical Information Systems Hydraulic Modeling (if available) Strive to have the knowledgeable people participating- the water audit is not an administrative task (Don’t assign water audit data collection to the secretary)
 Strive to have the knowledgeable people participating- the water audit is not an administrative task (Don’t assign water audit data collection to the secretary)")
13
Data Collection Integrity – Avoid Reporting Bad Data
Software features “flags” for bad data It’s impossible for a utility to bill more water than they supply If this occurs, the software gives a red “flag” to alert the auditor to recheck the data inputs Unfortunately, some utilities are submitting water audits with such flagged data Suggestion: The lead person of the water utility should sign-off on the water audit when it is submitted to the reporting agency.

14
Accurately Quantifying “Water Supplied”
This is the most important quantity in the Water Audit! It is the largest number in the Water Audit Any error in this value carries throughout the entire Water Audit Several steps exist to reliably quantify the “water supplied” quantity Source water, imported water and exported water should always be metered Ideally, these meters should be the continuously recording type ideally linked to a Supervisory control and data acquisition (SCADA) System If meters are not linked to a SCADA System, then data should be collected as frequently as possible, at least weekly If meters are not continuously recording type, and are read infrequently, plan to upgrade the metering installation as soon as possible
 System. If meters are not linked to a SCADA System, then data should be collected as frequently as possible, at least weekly. If meters are not continuously recording type, and are read infrequently, plan to upgrade the metering installation as soon as possible.")
15
Accurately Quantifying “Water Supplied”
Testing Approach Volumetric Meter Test Comparative Meter Test

16
Accurately Quantifying “Water Supplied”
Meters should be regularly verified for accuracy Large meters can be compared with an inline insertion or strap-on meter measuring flow downstream of the primary meter Make certain that the temporary metering location is representative and accurate Strive for minimum 24-hr period if using this method Philadelphia Water Department conducts over 50 verifications each year in this manner Smaller meters might be tested using field test apparatus as is conducted on large customer meters Document/store the inaccuracy values to serve as a basis for data adjustments Recognize that calibration of the related instrumentation (differential pressure transmitters) does not verify the flow measuring capability of the meter! Insertion pito rod measuring and recording flow
 does not verify the flow measuring capability of the meter! Insertion pito rod measuring and recording flow.")
17
Accurately Quantifying “Water Supplied”
Meters should be recalibrated, repaired or replaced regularly to maintain reliable performance New, current-technology meters should replace dated or defective meters Permanently installed insertion type meters can be a less costly means of establishing or renewing reliable metering Refer to AWWA M33 guidance manual “Flowmeters in Water Supply” for information on meter selection Many dated meters exist throughout the North American water industry Magnetic Flow meter replacement on 48-inch untreated water line 2008 in Philadelphia

18
Accurately Quantifying “Water Supplied”
Regularly determine Master Meter Error Adjustment Data should be reviewed at least weekly, but ideally, each business day, for trends/anomalies Balance flows to account for storage level changes and district water transfers Adjust for recorded inaccuracy levels of given meters Adjustments due to data error Adjustments due to data gaps Aggregate master meter error is: Added if source meter under-registration exists Subtracted if source meter over-registration exists 16-inch turbine meter on wholesale account being verified via inline pito rod

19
Know Your Production Metering Configuration
By monitoring the differences (A-B, B-C, A-C) on a daily basis, anomalies are detected when these relative differences begin to stray from typical trends
 on a daily basis, anomalies are detected when these relative differences begin to stray from typical trends.")
20
Adjusting for Data Gaps
Production flow data should be reviewed on a frequent basis to monitor for data gaps Gaps occur due to: Unplanned interruption: lightning strike, power failure Planned interruption: instrumentation calibration Gaps in water flow data should be quantified and added back to the daily total

21
Assembling Data for the Annual Water Audit
SCADA “A” history: raw data from the field SCADA “B” history: corrected, final data

22
Data Collection – Exported Water Quantity
Extract the Exported Water Quantity from the Customer Billing System Don’t “double-count” this quantity by including it additionally in “Billed Authorized Consumption” The “Exported Water” quantity is a separate item in the water audit because: It stems from one or more bulk quantity measurements It is typically billed under a different billing rate than retail customer sales

23
Data Collection – Unbilled Authorized Consumption
Unbilled Authorized Consumption components metered and/or un- metered consumption, e.g.: Street cleaning Mains flushing Fire fighting Generally small portion of the “water supplied” volume Don’t spend lots of time on quantify this value if data is not available Instead, use the default value for “Unbilled Unmetered Consumption” Improve data validity over time

24
Data Collection – Systematic Data Handling Error
Deals with the customer meter reading and billing processes This quantity is perhaps the least understood component of apparent loss Like unauthorized consumption, every water utility has some amount of systematic data handling error, even if it is a low amount Important to include at least a minimal volume here – don’t leave this volume at zero. The software does not provide a default value for this component Detailed auditing of billing records will likely lead to sources of this error and quantification of a value

25
Length of Private Pipe Can be difficult to understand the concept around this parameter, however: If customer water meters are typically located in a meter pit outside of the customer premises then this value is zero

26
Data Collection – Financial Data: Cost to Operate the System
Includes costs for drinking water operations only – do not include sewer, stormwater or other costs in this quantity Typically includes power costs to treat and convey water, chemical and other costs at the water treatment plant, staff costs for drinking water only May include liability costs related to water events (ex: damage from main breaks) Don’t include depreciation effects
 Don’t include depreciation effects.")
27
Water Audit Data Collection Initiative 2011 & 2012
Effort of the AWWA Water Loss Control Committee Goal: create a dataset of validated water utility water audit data (IWA/AWWA Method) Steps: Enlist water utilities that are motivated to employ best practices Gather the water audit data via AWWA Free Water Audit Software© Conduct a minute telephone interview w/ key utility personnel Post the utility data on the AWWA website as examples of best practice adopters and their data Primary Focus: “Validation” of data; key on data grading values
 Steps: Enlist water utilities that are motivated to employ best practices. Gather the water audit data via AWWA Free Water Audit Software© Conduct a minute telephone interview w/ key utility personnel. Post the utility data on the AWWA website as examples of best practice adopters and their data. Primary Focus: Validation of data; key on data grading values.")
28
AWWA Free Water Audit Software© - Companion “Compiler” Software
EXCEL spreadsheet tool that allows data from multiple water audits to be “compiled” into one spreadsheet Date can be copied to user’s EXCEL files Available for free download from AWWA website

29
Water Audit Data Collection Initiative 2011
2011 Data Collection notables: 21 water utilities (19 USA, 2 Canada) 17 systems over 10,000 connections; 4 systems under 10,000 connections Observations from the data: Validation results: ave data validity score dropped from 78 to 74 after validation Wide variation in production costs: $183/mg (KY) to $2,110/mg (TN) – ave. $726/mg Customer retail costs: ave. $4.57/1,000 gals Range $1.11 to $8.38 Ave apparent losses: 15 gal/connection/day Ave real losses: 63 gal/connection/day
 17 systems over 10,000 connections; 4 systems under 10,000 connections. Observations from the data: Validation results: ave data validity score dropped from 78 to 74 after validation. Wide variation in production costs: $183/mg (KY) to $2,110/mg (TN) – ave. $726/mg. Customer retail costs: ave. $4.57/1,000 gals Range $1.11 to $8.38. Ave apparent losses: 15 gal/connection/day. Ave real losses: 63 gal/connection/day.")
30
AWWA Water Audit Compiler© features readily displayed graphs – Apparent Losses (gal/conn/day)
Apparent (non-physical) losses in gal/service connection/day: good for performance tracking
 losses in gal/service connection/day: good for performance tracking.")
31
AWWA Water Audit Compiler© features readily displayed graphs – Real Losses (gal/conn/day)
Real (leakage) losses in gal/service connection/day: good for performance tracking
 losses in gal/service connection/day: good for performance tracking.")
32
use this indicator in the form of gallons/mile of pipeline/day)
Water Audit Data Collection Initiative 2011 This is the BEST Performance Indicator for monitoring progress within an individual water utility. (Note: utilities with very low connection densities and meters located after the curb stop use this indicator in the form of gallons/mile of pipeline/day)
")
33
Summary – key steps for valid data collection
Standardized Water Audit Data Collection is occurring across the United States The data collection process is still relatively young but is maturing Water utilities should assign knowledgeable staff members from all functional areas to assemble the water audit The lead person of the water utility should review the water audit before it is submitted to the reporting agency Valid data is needed to accurately represent the water efficiency of the water utility and guide improvements

34
On to the Next Section

Similar presentations