Download presentation
Presentation is loading. Please wait.

1
Natural Water Chemistry

2
Water Quality Parameters
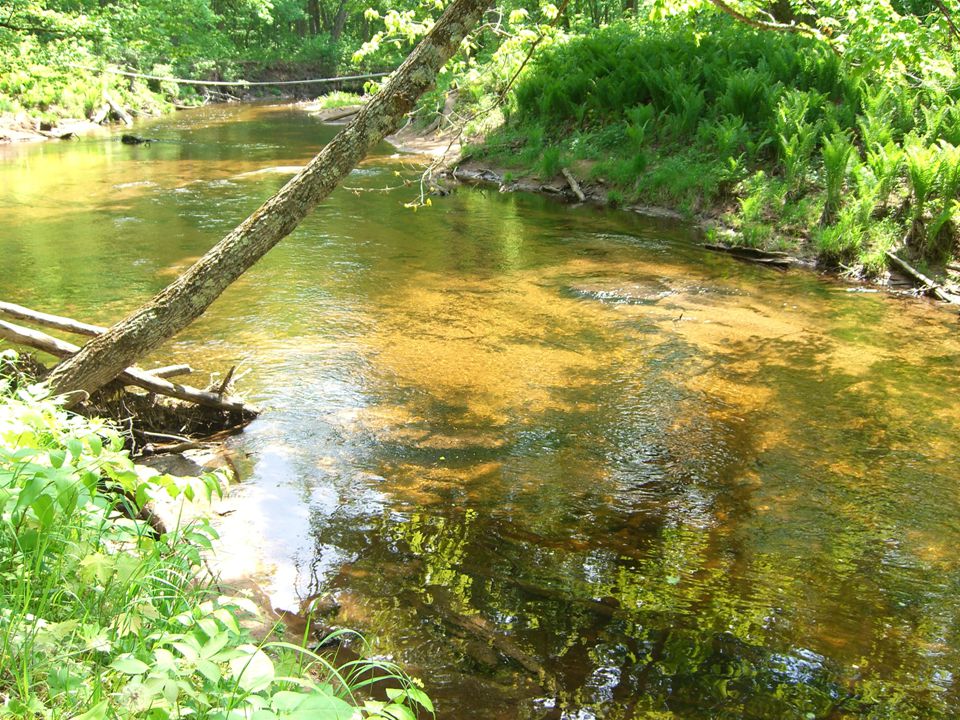
Temperature - Dissolved Oxygen (DO) - pH Alkalinity - Hardness Nitrates and Phosphates - Turbidity Conductivity -
 - pH. Alkalinity - Hardness. Nitrates and Phosphates - Turbidity. Conductivity. -")
3
Temperature Affects: Water density Gas solubility
Chemical reaction rates Organism growth rates Conductivity pH Dissolved Oxygen Some chemical compounds are more toxic to aquatic life at higher temperatures. For fish, no single environmental factor affects their development and growth more than water temperature. Spawning and egg hatching (and other biological processes) are geared to annual temperature changes. Salmon eggs are large and need more oxygen than other fish eggs. That is why salmon lay eggs in cool flowing streams. (Eggs – 9 C, fish 12 C.)
 are geared to annual temperature changes. Salmon eggs are large and need more oxygen than other fish eggs. That is why salmon lay eggs in cool flowing streams. (Eggs – 9 C, fish 12 C.)")
4
Temperature – naturally varies because of…
… Changes in seasonal/diurnal air temperature … Thermal stratification in lakes … Size and temperature of inflows … Residence time (lakes) Thermal strat: sun warms surface, maintains cooler temps below. For example, dissolved oxygen concentration, pH, nutrient concentrations, and species of aquatic life in the upper layer can be quite different from those in the lower layer. It is almost like having two separate lakes. The most profound difference is usually seen in the oxygen profile since the bottom layer is now isolated from the major source of oxygen to the lake - the atmosphere. Size temp inflows : e.g., a stream during snowmelt, or springs or a lowland creek Residence time: and by how quickly water flushes through the lake. Even a shallow lake may remain cool if fed by a comparatively large, cold stream.
 Thermal strat: sun warms surface, maintains cooler temps below. For example, dissolved oxygen concentration, pH, nutrient concentrations, and species of aquatic life in the upper layer can be quite different from those in the lower layer. It is almost like having two separate lakes. The most profound difference is usually seen in the oxygen profile since the bottom layer is now isolated from the major source of oxygen to the lake - the atmosphere. Size temp inflows : e.g., a stream during snowmelt, or springs or a lowland creek. Residence time: and by how quickly water flushes through the lake. Even a shallow lake may remain cool if fed by a comparatively large, cold stream.")
5
Temperature – artificially varies because of…
… Heated industrial effluent … Runoff from asphalt/pavement … Deforestation Generally not problematic – unable to detect significant changes because of the above.

6
Q10 rule cold-blooded aquatic organisms
Most aquatic organisms are poikilothermic - i.e., "cold-blooded" - which means they are unable to internally regulate their core body temperature. Therefore, temperature exerts a major influence on the biological activity and growth of aquatic organisms. To a point, the higher the water temperature, the greater the biological activity. Fish, insects, zooplankton, phytoplankton, and other aquatic species all have preferred temperature ranges. As temperatures get too far above or below this preferred range, the number of individuals of the species decreases until finally there are few, or none. For example, we would generally not expect to find a thriving trout fishery in ponds or shallow lakes because the water is too warm throughout the ice-free season. Predicts that growth rate will double if temperature increases by 10˚C (18˚F) within their "preferred" range.
 within their preferred range.")
7
Dissolved Oxygen (DO) DO is the measurement of oxygen dissolved in water and available for fish and other aquatic life. Indicates health of an aquatic system. Can range from 0-18 ppm. Most natural water systems require 5-6 ppm to support a diverse population. DO concentrations steadily decline during the night and are the lowest just before dawn, when photosynthesis resumes Other sources of oxygen include the air and inflowing water sources. More oxygen dissolves into water when wind stirs the water. Rivers and streams deliver oxygen, especially if they are turbulent. Turbulence mixes water and air (aeration). DO levels change and vary according to the time of day, the weather and the temperature. If yearly comparisons are made on dissolved oxygen levels, they should be done at the same time of day, during the same season and on a day with a temperature variation of only 10 degrees Celsius from the previous reading. Varies with time of day, weather, temperature.
. DO levels change and vary according to the time of day, the weather and the temperature. If yearly comparisons are made on dissolved oxygen levels, they should be done at the same time of day, during the same season and on a day with a temperature variation of only 10 degrees Celsius from the previous reading. Varies with time of day, weather, temperature.")
9
Dissolved Oxygen (DO) Increase in organic waste
Increase in algae/plant vegetation Decrease in DO available to organisms Leads to changes in ecosystem as organisms needing lots of DO are replaced by organisms needing little. Oxygen enters the water by direct absorption from the atmosphere or by plant photosynthesis. The oxygen is used by plants and animals for respiration and by the aerobic bacteria which consume oxygen during the process of decomposition. Decreases in the dissolved oxygen levels can cause changes in the types and numbers of aquatic macroinvertebrates which live in a water ecosystem. Species which cannot tolerate decreases in dissolved oxygen levels include mayfly nymphs, stonefly nymphs, caddisfly larvae and beetle larvae. decrease in the dissolved oxygen levels is usually an indication of an influx of some type of organic pollutant.

10
Hood Canal, Wash. DO Hood Canal
Part of Puget sound. Fed by snowmelt from Olympic mts. Used for wildlife habitat, outdoor recreation, fisheries, home to two tribal nations. Health of water threatened by decrease in DO – work underway by member of Hood Canal DO Project to try to find out why.

11
Freshwater from stream and river runoff. Highly stratified
Sill Saltwater from entry point. Freshwater from stream and river runoff. Highly stratified Slow-circulating Long residence time “Sill” reduces flow – long residence time in Hood Canal. Highly stratified. Inflow from main entrance salt water, runoff fresh. The freshwater carries natural stuff: fall leaves, winter run-off salmon carcasses Non natural stuff: yard waste stormwater toxins herbicide residue effluents from septics and sewers Increase in organics leads to decrease in DO – changes ecosystem, as anoxia-loving critters take over as the o2 loving choked out. Affects bottom first – bottom feeders will rise to top if they can (eg: rockfish, deep-sea shrimp), but others can’t (sea cucumbers, anemone, starfish)…so they perish.
, but others can’t (sea cucumbers, anemone, starfish)…so they perish.")
12
Hood Canal Jan Apr Jun Sept Dec
Note seasonal variations: DO measured at 20m depth Remember it’s stratified Lake bottom waters replaced once a year at end of summer (new saltwater DO higher than H2O currently in the Hood Canal) Old bottom waters pushed up by new bottom waters – thus decrease in DO levels at 20 m depth Increase in DO from then till following summer because of more DO brought in by freshwater Also not annual variations: Particularly 2004 data. Jan Apr Jun Sept Dec Modified from Hood Canal Dissolved Oxygen Project, Collias, UW, PRISM 2005
 Old bottom waters pushed up by new bottom waters – thus decrease in DO levels at 20 m depth. Increase in DO from then till following summer because of more DO brought in by freshwater. Also not annual variations: Particularly 2004 data. Jan. Apr. Jun. Sept. Dec. Modified from Hood Canal Dissolved Oxygen Project, Collias, UW, PRISM")
13
Potential causes Natural Artificial
increased sunlight or other climate factors increased nutrient availability Changes in ocean properties Changes in river input (e.g.: drought) Changes in weather conditions Artificial human loading of nutrients or organic material Changes in river input (eg: diversion) Changes in production or input of organic matter, due to naturally better growth conditions such as increased sunlight or other climate factors Changes in production or input of organic matter, due to naturally better growth conditions such as increased nutrient availability Changes in production or input of organic matter, due to human loading of nutrients or organic material Changes in ocean properties, such as seawater density that affects flushing of the Canal?s waters, oxygen concentration, or nutrients in the incoming ocean water Changes in river input or timing from natural causes (e.g., drought) or from human actions (e.g., diversion) that affect both flushing and mixing in the Canal. Changes in weather conditions, such as wind direction and speed, which affect the flushing and/or oxygen concentration distribution. Study to determine which is major causes, and what can be done about them. Collaborative effort: financed through federal funds secured by Congressman Norm Dicks. This study is administered by the Applied Physics Lab of the University of Washington, through a contract with the Navy. It is co-managed by APL-UW and the Hood Canal Salmon Enhancement Group. Diverse group shows how many stakeholders a natural water body can have.
 Changes in weather conditions. Artificial. human loading of nutrients or organic material. Changes in river input (eg: diversion) Changes in production or input of organic matter, due to naturally better growth conditions such as increased sunlight or other climate factors. Changes in production or input of organic matter, due to naturally better growth conditions such as increased nutrient availability. Changes in production or input of organic matter, due to human loading of nutrients or organic material. Changes in ocean properties, such as seawater density that affects flushing of the Canal s waters, oxygen concentration, or nutrients in the incoming ocean water. Changes in river input or timing from natural causes (e.g., drought) or from human actions (e.g., diversion) that affect both flushing and mixing in the Canal. Changes in weather conditions, such as wind direction and speed, which affect the flushing and/or oxygen concentration distribution. Study to determine which is major causes, and what can be done about them. Collaborative effort: financed through federal funds secured by Congressman Norm Dicks. This study is administered by the Applied Physics Lab of the University of Washington, through a contract with the Navy. It is co-managed by APL-UW and the Hood Canal Salmon Enhancement Group. Diverse group shows how many stakeholders a natural water body can have.")
14
pH - p(otential of) H(ydrogen)
pH = -log [ H +] Determines the solubility of nutrients (PO4-3, NO3-, C) and heavy metals (Fe, Cu, etc) Determines availability of these chemicals for use by aquatic life. In natural water systems, determined largely by geology and soils. eg: heavy metals more soluble in baisic (corrosive) waters, therefore a increase in pH can lead to higher concentrations of heavy metals, which could be dangerous for aquatic life. Testing water for pH measures the capacity of the water to neutralize acids associated with pollution.pH is one of the primary indicators used for evaluation of surface-water quality. Most marine plants and animals are sensitive to pH variations. Water's pH is affected by the minerals dissolved in the water, aerosols and dust from the air, and human-made wastes as well as by plants and animals through photosynthesis and respiration. Several factors affect the pH of the water, including: * Algal blooms * bacterial activity * water turbulence * chemicals flowing into the waterbody * sewage overflows and * impacts from land pollution, accidental spills, and acid rainThe pH of water is critical to the survival of most aquatic plants and animals. Many species have trouble surviving if pH levels drop under 5.0 or rise above 9.0.
 and heavy metals (Fe, Cu, etc) Determines availability of these chemicals for use by aquatic life. In natural water systems, determined largely by geology and soils. eg: heavy metals more soluble in baisic (corrosive) waters, therefore a increase in pH can lead to higher concentrations of heavy metals, which could be dangerous for aquatic life. Testing water for pH measures the capacity of the water to neutralize acids associated with pollution.pH is one of the primary indicators used for evaluation of surface-water quality. Most marine plants and animals are sensitive to pH variations. Water s pH is affected by the minerals dissolved in the water, aerosols and dust from the air, and human-made wastes as well as by plants and animals through photosynthesis and respiration. Several factors affect the pH of the water, including: * Algal blooms * bacterial activity * water turbulence * chemicals flowing into the waterbody * sewage overflows and * impacts from land pollution, accidental spills, and acid rainThe pH of water is critical to the survival of most aquatic plants and animals. Many species have trouble surviving if pH levels drop under 5.0 or rise above 9.0.")
15
The scale is logarithmic, thus there is a ten-fold change in acidity or alkalinity per unit change. For example, water with a pH of 5 is ten times more acidic than water with a pH of 6.

16
pH of natural waters Sea water due to humic acid
Limestone, marble, CO3 rich Pure rain, snow Sea water Humic acid formed by decomposing terrestrial vegetation. * pH values between 7.0 and 8.0 are optimal for supporting a diverse aquatic ecosystem.* A pH range between 6.5 and 8.5 is generally suitable. Alakali elements: Lithium * Sodium * Potassium * Rubidium * Cesium * Francium Modified from

17
Factors that affect pH Algal blooms Bacterial activity
Water turbulence Chemicals flowing into the water body Sewage overflows Pollution CO2 removal (product of photosynthesis) reduces acidity of water (pH increase) Respiration of organisms produces CO2, lowers pH Therefore, pH highest during max photosynthesis (daytime) pH varies due to depth (because of biological activity/processes)
 reduces acidity of water (pH increase) Respiration of organisms produces CO2, lowers pH. Therefore, pH highest during max photosynthesis (daytime) pH varies due to depth (because of biological activity/processes)")
18
How pH affects aquatic life
Decreasing pH (e.g.: via acid rain) ▼ Liberation of Al, metals Toxic conditions Chronic stress Smaller, weaker fish Acid rain affects areas with low buffering capacity more than others. Can eliminate species from an environment, but can also just weaken community.
 ▼ Liberation of Al, metals. Toxic conditions. Chronic stress. Smaller, weaker fish. Acid rain affects areas with low buffering capacity more than others. Can eliminate species from an environment, but can also just weaken community.")
19
Alkalinity Alkalinity refers to the capability of water to neutralize acid. Buffering capacity – resistance to pH changes. Common natural buffer: CO3 (carbonates – like limestone). Protects aquatic life. Commonly linked to water hardness. In natural systems: 50 – 150 mg/L as CaCO3. if you add the same weak acid solution to two vials of water - both with a pH of 7, but one with no buffering power (e.g. zero alkalinity) and the other with buffering power (e.g. an alkalinity of 50 mg/l), - the pH of the zero alkalinity water will immediately drop while the pH of the buffered water will change very little or not at all. The pH of the buffered solution would change when the buffering capacity of the solution is overloaded. Waters passing over limestone/carbonate rich rocks have high alkalinity/ buffering capacity Waters passing over granites/carbonate poor rocks, have low alkalinity/buffering capacity. Important for aquatic species because protects from rapid pH changes. Reduces occurrence of acid shock from: snowmelt thunderstorms acid rainstorms What is Alkalinity?Alkalinity is the water's capacity to resist changes in pH that would make the water more acidic. This capacity is commonly known as "buffering capacity." For example, if you add the same weak acid solution to two vials of water - both with a pH of 7, but one with no buffering power (e.g. zero alkalinity) and the other with buffering power (e.g. an alkalinity of 50 mg/l), - the pH of the zero alkalinity water will immediately drop while the pH of the buffered water will change very little or not at all. The pH of the buffered solution would change when the buffering capacity of the solution is overloaded.Alkalinity refers to the capability of water to neutralize acid. This is really an expression of buffering capacity. A buffer is a solution to which an acid can be added without changing the concentration of available H+ ions (without changing the pH) appreciably. It essentially absorbs the excess H+ ions and protects the water body from fluctuations in pH. In most natural water bodies in Pennsylvania the buffering system is carbonate-bicarbonate ( H2CO3, HCO3, and CO3). Alkalinity of natural water is determined by the soil and bedrock through which it passes. The main sources for natural alkalinity are rocks which contain carbonate, bicarbonate, and hydroxide compounds. Borates, silicates, and phosphates also may contribute to alkalinity. Limestone is rich in carbonates, so waters flowing through limestone regions or bedrock containing carbonates generally have high alkalinity - hence good buffering capacity. Conversely, areas rich in granites and some conglomerates and sandstones may have low alkalinity and therefore poor buffering capacity. The presence of calcium carbonate or other compounds such as magnesium carbonate contribute carbonate ions to the buffering system. Alkalinity is often related to hardness because the main source of alkalinity is usually from carbonate rocks (limestone) which are mostly CaCO3. If CaCO3 actually accounts for most of the alkalinity, hardness in CaCO3 is equal to alkalinity. Since hard water contains metal carbonates (mostly CaCO3) it is high in alkalinity. Conversely, unless carbonate is associated with sodium or potassium which don't contribute to hardness, soft water usually has low alkalinity and little buffering capacity. So, generally, soft water is much more susceptible to fluctuations in pH from acid rains or acid contamination.How alkalinity affects aquatic life. Alkalinity is important for fish and aquatic life because it protects or buffers against rapid pH changes. Living organisms, especially aquatic life, function best in a pH range of 6.0 to 9.0. Alkalinity is a measure of how much acid can be added to a liquid without causing a large change in pH. Higher alkalinity levels in surface waters will buffer acid rain and other acid wastes and prevent pH changes that are harmful to aquatic life. Acid shock may occur in spring when acid snows melt, thunderstorms, natural discharges of tannic waters, "acid rain", acidic dryfall, and other discharges enter the stream. If increasing amounts of acids are added to a body of water, the water's buffering capacity is consumed. If additional buffering material can be obtained from surrounding soils and rocks, the alkalinity level may eventually be restored. However, a temporary loss of buffering capacity can permit pH levels to drop to those harmful to life in the water.The pH of water does not fall evenly as acid contamination proceeds. The natural buffering materials in water slow the decline of pH to around 6.0. This gradual decline is followed by a rapid pH drop as the bicarbonate buffering capacity is used up. At a pH of 5.5, only very weak buffering materials remain and pH drops further with additional acid. Sensitive species and immature animals are affected first. As food species disappear, even larger, resistant animals are affected.For protection of aquatic life the buffering capacity should be at least 20 mg/L. If alkalinity is naturally low, (less than 20 mg/L) there can be no greater than a 25% reduction in alkalinity.Testing Methodology: Alkalinity is an electrometric measurement which is performed using a titrant and a pH electrode. A potentiometric titration is taken to an end-point reading of pH 4.5. The amount of acid required to reach a pH of 4.5 is expressed in milliliters. The calcium ions (CO3) neutralize the acid in this reaction, and show the buffering capacity of the sample. From the amount of acid used, a calculation will indicate the amount of carbonate (CO3) involved in the reaction. This then is expressed as mg of CaCO3/L even though actually part of the alkalinity may be contributed by MgCO3 , Na2CO3 or K2CO3. Limestone outcrop
. Protects aquatic life. Commonly linked to water hardness. In natural systems: 50 – 150 mg/L as CaCO3. if you add the same weak acid solution to two vials of water - both with a pH of 7, but one with no buffering power (e.g. zero alkalinity) and the other with buffering power (e.g. an alkalinity of 50 mg/l), - the pH of the zero alkalinity water will immediately drop while the pH of the buffered water will change very little or not at all. The pH of the buffered solution would change when the buffering capacity of the solution is overloaded. Waters passing over limestone/carbonate rich rocks have high alkalinity/ buffering capacity. Waters passing over granites/carbonate poor rocks, have low alkalinity/buffering capacity. Important for aquatic species because protects from rapid pH changes. Reduces occurrence of acid shock from: snowmelt. thunderstorms. acid rainstorms. What is Alkalinity Alkalinity is the water s capacity to resist changes in pH that would make the water more acidic. This capacity is commonly known as buffering capacity. For example, if you add the same weak acid solution to two vials of water - both with a pH of 7, but one with no buffering power (e.g. zero alkalinity) and the other with buffering power (e.g. an alkalinity of 50 mg/l), - the pH of the zero alkalinity water will immediately drop while the pH of the buffered water will change very little or not at all. The pH of the buffered solution would change when the buffering capacity of the solution is overloaded.Alkalinity refers to the capability of water to neutralize acid. This is really an expression of buffering capacity. A buffer is a solution to which an acid can be added without changing the concentration of available H+ ions (without changing the pH) appreciably. It essentially absorbs the excess H+ ions and protects the water body from fluctuations in pH. In most natural water bodies in Pennsylvania the buffering system is carbonate-bicarbonate ( H2CO3, HCO3, and CO3). Alkalinity of natural water is determined by the soil and bedrock through which it passes. The main sources for natural alkalinity are rocks which contain carbonate, bicarbonate, and hydroxide compounds. Borates, silicates, and phosphates also may contribute to alkalinity. Limestone is rich in carbonates, so waters flowing through limestone regions or bedrock containing carbonates generally have high alkalinity - hence good buffering capacity. Conversely, areas rich in granites and some conglomerates and sandstones may have low alkalinity and therefore poor buffering capacity. The presence of calcium carbonate or other compounds such as magnesium carbonate contribute carbonate ions to the buffering system. Alkalinity is often related to hardness because the main source of alkalinity is usually from carbonate rocks (limestone) which are mostly CaCO3. If CaCO3 actually accounts for most of the alkalinity, hardness in CaCO3 is equal to alkalinity. Since hard water contains metal carbonates (mostly CaCO3) it is high in alkalinity. Conversely, unless carbonate is associated with sodium or potassium which don t contribute to hardness, soft water usually has low alkalinity and little buffering capacity. So, generally, soft water is much more susceptible to fluctuations in pH from acid rains or acid contamination.How alkalinity affects aquatic life. Alkalinity is important for fish and aquatic life because it protects or buffers against rapid pH changes. Living organisms, especially aquatic life, function best in a pH range of 6.0 to 9.0. Alkalinity is a measure of how much acid can be added to a liquid without causing a large change in pH. Higher alkalinity levels in surface waters will buffer acid rain and other acid wastes and prevent pH changes that are harmful to aquatic life. Acid shock may occur in spring when acid snows melt, thunderstorms, natural discharges of tannic waters, acid rain , acidic dryfall, and other discharges enter the stream. If increasing amounts of acids are added to a body of water, the water s buffering capacity is consumed. If additional buffering material can be obtained from surrounding soils and rocks, the alkalinity level may eventually be restored. However, a temporary loss of buffering capacity can permit pH levels to drop to those harmful to life in the water.The pH of water does not fall evenly as acid contamination proceeds. The natural buffering materials in water slow the decline of pH to around 6.0. This gradual decline is followed by a rapid pH drop as the bicarbonate buffering capacity is used up. At a pH of 5.5, only very weak buffering materials remain and pH drops further with additional acid. Sensitive species and immature animals are affected first. As food species disappear, even larger, resistant animals are affected.For protection of aquatic life the buffering capacity should be at least 20 mg/L. If alkalinity is naturally low, (less than 20 mg/L) there can be no greater than a 25% reduction in alkalinity.Testing Methodology: Alkalinity is an electrometric measurement which is performed using a titrant and a pH electrode. A potentiometric titration is taken to an end-point reading of pH 4.5. The amount of acid required to reach a pH of 4.5 is expressed in milliliters. The calcium ions (CO3) neutralize the acid in this reaction, and show the buffering capacity of the sample. From the amount of acid used, a calculation will indicate the amount of carbonate (CO3) involved in the reaction. This then is expressed as mg of CaCO3/L even though actually part of the alkalinity may be contributed by MgCO3 , Na2CO3 or K2CO3. Limestone outcrop.")
20
Hardness Reflects dissolved carbonate minerals.
Mostly of concern for drinking water standards. Metals precipitate out of solution. Create scale/hard water deposits High alkalinity Hard water From USGS

21
and Nitrates Phosphates Redfield Ratio: 106:16:1 Nitrate (NO3-)
naturally-occurring form of nitrogen found in soil. Forms by microbial decomposition of fertilizers, plants, manures or other organic residues Plants uptake nitrates (Spinach a good source). Phosphate (PO4-3) naturally occurs in rocks and minerals. Plants uptake weathered-out elements and compounds. Animals ingest plants. Water soluble. Nitrogen is essential to all life, and most crop plants require large quantities to sustain high yields. The formation of nitrate is an integral part of the nitrogen cycle in the environment. Redfield Ratio: 106:16:1
. Phosphate (PO4-3) naturally occurs in rocks and minerals. Plants uptake weathered-out. elements and compounds. Animals ingest plants. Water soluble. Nitrogen is essential to all life, and most crop plants require large quantities to sustain high yields. The formation of nitrate is an integral part of the nitrogen cycle in the environment. Redfield Ratio: 106:16:1.")
23
Nitrates Artificial sources: Can lead to: Livestock manure/urine
Failing septic systems Synthetic fertilizers Can lead to: eutrophication of natural water systems (overproduction of vegetation) Blue baby syndromne The total input of nutrients varies through time, depending upon land use and other factors. During the winter, high rainfall causes increased runoff of organic matter such as leaves, twigs, grass and other debris. Because decomposition of this organic matter releases nutrients, it constitutes an important and beneficial source of nutrient loading. Phosphates and nitrates are associated with many nonpoint pollution sources, such as livestock manure and urine, failing septic systems synthetic fertilizers. (Synthetic fertilizers release their nutrients more rapidly than the slower-acting organic ones like compost and composted manure.) Excessive nutrient loads can artificially stimulate plant growth resulting in algal blooms which speed up the aging process of aquatic systems. Concern of health risks to man (cancer, Blue baby syndrome) – controversial. The U.S. EPA has set a maximum contaminant level for NO3- in drinking water of 10 parts per million (ppm)
 Blue baby syndromne. The total input of nutrients varies through time, depending upon land use and other factors. During the winter, high rainfall causes increased runoff of organic matter such as leaves, twigs, grass and other debris. Because decomposition of this organic matter releases nutrients, it constitutes an important and beneficial source of nutrient loading. Phosphates and nitrates are associated with many nonpoint pollution sources, such as. livestock manure and urine, failing septic systems. synthetic fertilizers. (Synthetic fertilizers release their nutrients more rapidly than the slower-acting organic ones like compost and composted manure.) Excessive nutrient loads can artificially stimulate plant growth resulting in algal blooms which speed up the aging process of aquatic systems. Concern of health risks to man (cancer, Blue baby syndrome) – controversial. The U.S. EPA has set a maximum contaminant level for NO3- in drinking water of 10 parts per million (ppm)")
24
Phosphates Artificial sources: Sewage Laundry, cleaning fluids
Synthetic fertilizers Can also lead to eutrophication of natural water systems (overproduction of vegetation) Blue green algae
 Blue green algae.")
25
1990 and 1999 comparison of Nitrates in Great Lakes
From US EPA

26
Hypoxia in the Gulf of Mexico
The Mississippi River drains 41 per cent of the US landmass In the United States, some of the key farming states like Ohio, Indiana, Illinois, and Iowa have drained 80 per cent of their wetlands. Louisiana, Mississippi, Arkansas, and Tennessee have lost over half of theirs. This lets even more of the excess fertilizer farmers apply flow down the Mississippi River to the gulf. Info source: Gulf of Mexico Mississippi River drainage basin – 41% of US landmass.

27
Hypoxia in the Gulf of Mexico
1.6 million tons of nitrogen now enter the Gulf from the Mississippi basin most of the nitrogen originates in fertilizer used in the productive Corn Belt. Hypoxic waters Image from Jacques Descloitres, MODIS Land Rapid Response Team, NASA/GSFC, January 2003

28
Hypoxia in the Gulf of Mexico
Particularly bad for fish because coastal areas is spawning grounds before moving to deeper waters. From NCAT (Nat’l Center for Appropriate Technology)
")
29
Global distribution of oxygen-depleted coastal zones.
The 146 zones shown are associated with either major population concentrations or with watersheds that deliver large quantities of nutrients to coastal waters. Global distribution of oxygen-depleted coastal zones. Annual = yearly events (summer or autumnal stratification) Episodic = occurring at irregular intervals > one year Periodic = occurring at regular intervals < one year Persistent = all-year-round hypoxia Sources: Boesch 2002, Caddy 2000, Diaz and others (in press), Green and Short 2003, Rabalais 2002
 Episodic = occurring at irregular intervals > one year. Periodic = occurring at regular intervals < one year. Persistent = all-year-round hypoxia. Sources: Boesch 2002, Caddy 2000, Diaz and others (in press), Green and Short 2003, Rabalais")
30
Source: Patrick Heffer, Short Term Prospects for World Agriculture and Fertilizer Demand 2002/ /04 (Paris: International Fertilizer Industry Association (IFA), December 2003); IFA Secretariat and IFA Fertilizer Demand Working Group, Fertilizer Consumption Report (Brussels: December 2001); historical data from Worldwatch Institute, Signposts 2002, CD-ROM, compiled from IFA and the U.N. Food and Agriculture Organization, Fertilizer Yearbook (Rome: various years).
..")
31
Solutions?? Wetland restoration Reduce fertilizers Reduce soil erosion
Reiterate - key farming states like Ohio, Indiana, Illinois, and Iowa have drained 80 per cent of their wetlands. Louisiana, Mississippi, Arkansas, and Tennessee have lost over half of theirs Lots of research into how to efficiently use fertilizers Where problems is because of large metropolis…must curb emissions from WWTP, industry. Preventing erosion through conservation tillage and crop rotations Reduce soil erosion Reduce emissions – WWTP/industry

32
Turbidity Measures how “murky” the water is Estimates:
Mineral fraction Organics Inorganics Soluble organic compounds Plankton Microscopic organisms Open water – mostly phytoplankton (microscopic floating plants) Coastal areas – eroded sediments MODIS Image from NASA
 Coastal areas – eroded sediments. MODIS Image from NASA.")
33
Turbid Causes of highly waters In open waters, phytoplankton
Closer to shore, particulates Resuspended bottom sediments (wind) Organic detritus from stream and/or wastewater discharges. Dredging operations Channelization Increased flow rates Floods Too many bottom-feeding fish (such as carp) Hippos Long list of how organisms affected
 Organic detritus from stream and/or wastewater discharges. Dredging operations. Channelization. Increased flow rates. Floods. Too many bottom-feeding fish (such as carp) Hippos. Long list of how organisms affected.")
34
Turbid Effects of highly waters Modify light penetration
Increase sedimentation rate Smother benthic habitats Settling clay particles can suffocate newly hatched larvae Fine particulate material also can damage sensitive gill structures Decrease organism resistance to disease Prevent proper egg and larval development Macrophyte growth may be decreased Reduced photosynthesis can lead to lower daytime release of oxygen Long list of how organisms affected

35
From waterontheweb.org

36
Conductivity Ability of a substance to conduct an electrical current.
In water, conductivity determined by types and quantities of dissolved solids. (Commonly called Total Dissolved Solids = TDS) Current carried by ions (negatively or positively charged particles). Eg: NaCl(aq) = Na + + Cl – Cl- Cl- Cl- Cl- Cl- Na+ Na+ Na+ Na+ Na+ Na+ Na+ Na+ Na+ Note that it doesn’t tell us what kind of TDS there are. Cl- Cl- Cl- Cl- Cl- Na+ Na+ Na+ Na+ Na+ Na+ Cl- Cl- Cl- Cl- Cl- Na+ Na+ Na+ Na+ Na+ Na+ Na+ Cl- Cl- Cl- Cl- Na+ Na+ Cl- Na+ Na+ Na+ Na+ Na+ Na+ Na+ Na+ Na+ Cl-
 Current carried by ions (negatively or. positively charged particles). Eg: NaCl(aq) = Na + + Cl – Cl- Cl- Cl- Cl- Cl- Na+ Na+ Na+ Na+ Na+ Na+ Na+ Na+ Na+ Note that it doesn’t tell us what kind of TDS there are. Cl- Cl- Cl- Cl- Cl- Na+ Na+ Na+ Na+ Na+ Na+ Cl- Cl- Cl- Cl- Cl- Na+ Na+ Na+ Na+ Na+ Na+ Na+ Cl- Cl- Cl- Cl- Na+ Na+ Cl- Na+ Na+ Na+ Na+ Na+ Na+ Na+ Na+ Na+ Cl-")
37
Conductivity Conductivity of natural waters depends upon:
Ion characteristics (mobility, valence, concentration) Water temperature Geology Size of watershed Evaporation Some artificial factors that can affect conductivity: Wastewater Urban runoff (especially road salt) Agricultural runoff Ion – more ions means more conductive Temp – higher temp means more ions Geology – more soluble rxs, increase in TDS, increase in conductivity Size – larger size, more contact water has with rx and soils. Evap – think Great Salt lake, Mono Lake Agricultural runoff – high in dissolved salts
 Water temperature. Geology. Size of watershed. Evaporation. Some artificial factors that can affect conductivity: Wastewater. Urban runoff (especially road salt) Agricultural runoff. Ion – more ions means more conductive. Temp – higher temp means more ions. Geology – more soluble rxs, increase in TDS, increase in conductivity. Size – larger size, more contact water has with rx and soils. Evap – think Great Salt lake, Mono Lake. Agricultural runoff – high in dissolved salts.")
38
Electrical Conductivity
TDS (μS/cm) (mg/L) Divide Lake 10 4.6 Lake Superior 97 63 Lake Tahoe 92 64 Grindstone Lake 95 65 Ice Lake 110 79 Lake Independence 316 213 Lake Mead 850 640 Atlantic Ocean 43,000 35,000 Great Salt Lake 158,000 230,000 Dead Sea ? ~330,000 Electrical Conductivity and TDS Divide is a softwater, acid rain sensitive lake in northeastern Minnesota; Superior and Tahoe are ultra-oligotrophic lakes; Ice and Independence are WOW lakes; Mead is an unproductive reservoir (the largest in the U.S.) but has a high TDS due to the salt content of the Colorado River which provides >98% of its water; the Atlantic Ocean overlies the lost Kingdom of Atlantis and possibly Jimmy Hoffa; the Great Salt Lake is an enormous hypersaline lake near Salt Lake City, Utah - it is the relict of what was once a huge inland freshwater sea that dried up, thereby concentrating the remaining salts after the water evaporated. From wateronthweb.org Salt present in 1L water
 (mg/L) Divide Lake Lake Superior Lake Tahoe Grindstone Lake Ice Lake Lake Independence Lake Mead Atlantic Ocean. 43, ,000. Great Salt Lake. 158, ,000. Dead Sea. ~330,000. Electrical Conductivity. and. TDS. Divide is a softwater, acid rain sensitive lake in northeastern Minnesota; Superior and Tahoe are ultra-oligotrophic lakes; Ice and Independence are WOW lakes; Mead is an unproductive reservoir (the largest in the U.S.) but has a high TDS due to the salt content of the Colorado River which provides >98% of its water; the Atlantic Ocean overlies the lost Kingdom of Atlantis and possibly Jimmy Hoffa; the Great Salt Lake is an enormous hypersaline lake near Salt Lake City, Utah - it is the relict of what was once a huge inland freshwater sea that dried up, thereby concentrating the remaining salts after the water evaporated. From wateronthweb.org. Salt present in 1L water.")
Similar presentations


>")
 of the Clean Water Act requires states to develop lists of impaired waters, those that do.>")
 Depends on…>")


 Nitrates a) Eutrophication b) Algae Blooms 2) pH 3) Turbidity 4) Temperature 5) Dissolved Oxygen 6) Bioindicators.>")