Download presentation
Presentation is loading. Please wait.

1
Empirically Evaluating Economic Policy in Real Time John B. Taylor The Martin Feldstein Lecture National Bureau of Economic Research July 10, 2009

2
The Purpose of Todays Feldstein Lecture To evaluate macroeconomic policy during the crisis, focusing on the period since the panic in the fall 2008 by comparing actual policy with counterfactuals: – About monetary policy – About fiscal policy Each counterfactual is composed of several sub- counterfactuals Real time because the crisis is ongoing

3
Why the Emphasis on Real Time? The financial crisis has made it essential – You have to evaluate policy quickly to be helpful Interesting: loads of new data and new policies Raises new questions about the use of high frequency data and simulation techniques It really is different

4
How is it different? Most macro-money research not done in real time – Taylor (1979): fixed growth rate rule would work better than actual policy but not as good as optimal policy: 1953-75 – Feldstein and Stock (1997): evaluated policy rules for M2: 1959-92 – Cecchetti, Flores-Lagunes, Krause (2006): Has Monetary Policy Become More Efficient? 24 countries: 1982-1998 – Bernanke (2005) Analysis of Great Moderation: pre and post 1984 A recent exception – Lars Svensson (2009): modified Taylor Curve based on forecasts Evaluates Riksbank policy: February 2009
: fixed growth rate rule would work better than actual policy but not as good as optimal policy: – Feldstein and Stock (1997): evaluated policy rules for M2: – Cecchetti, Flores-Lagunes, Krause (2006): Has Monetary Policy Become More Efficient. 24 countries: – Bernanke (2005) Analysis of Great Moderation: pre and post 1984 A recent exception – Lars Svensson (2009): modified Taylor Curve based on forecasts Evaluates Riksbank policy: February")
5
The Counterfactuals Figure 1 from Taylor (1979)
")
6
Figure 1 from Bernanke (2005), The Great Moderation
, The Great Moderation")
7
Figure 3. The modified Taylor curve Figure 3 from Svensson (2009) Evaluating Monetary Policy
 Evaluating Monetary Policy")
8
Four Phases of the Crisis The Root Causes – 2003-2006 – The Great Deviation? From Flare-up to Panic: Aug 2007- Sept 2008 – The Great Delay? Panic of Sept 2008 – The Great Scare? Post Panic Period: Sept 2008- present The Focus of this Lecture

9
The Panic of Fall 08

11
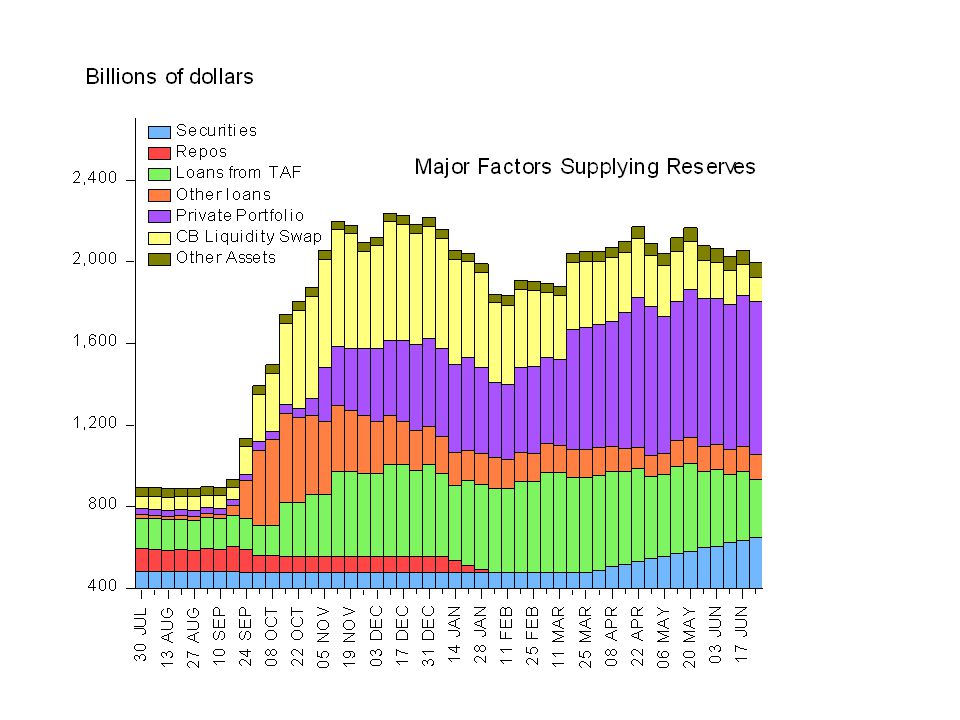
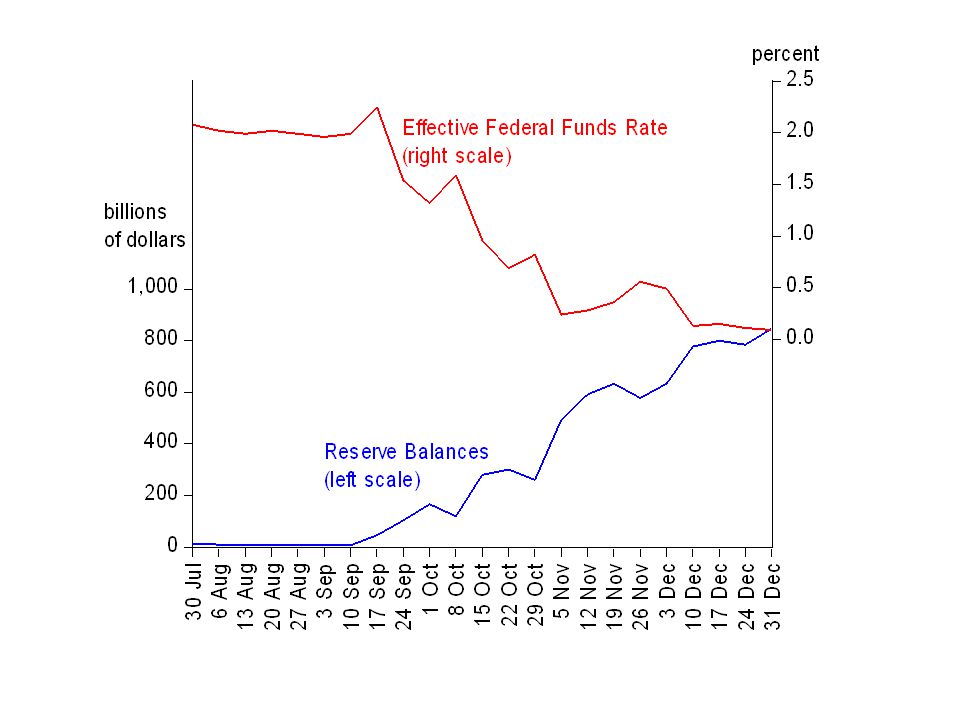
Actual Monetary Policy Since the Panic of 2008 During the week of 17 Sept 2008, reserve balances rose, for the first time, above the level required to keep the federal funds rate on target, which was then 2% – Quantitative easing (QE) began before the funds rate hit 0 – Reserves were increased to finance loans, first to investment banks through PDCF, and to purchase securities – Reserves were not increased to accommodate a shift in money demand, or a decline in velocity Reserves then continued to increase through end of 08 – To finance additional securities purchases and loans – Drove interest rate to zero, which FOMC then ratified – Have remained elevated and are expected to increase
 began before the funds rate hit 0 – Reserves were increased to finance loans, first to investment banks through PDCF, and to purchase securities – Reserves were not increased to accommodate a shift in money demand, or a decline in velocity Reserves then continued to increase through end of 08 – To finance additional securities purchases and loans – Drove interest rate to zero, which FOMC then ratified – Have remained elevated and are expected to increase")
17
Timing of FOMC Decisions: Fall 2008 10/8: FOMC votes to cut funds rate to 1.5 % from 2.0 % – But for the 2 weeks ending Oct 8, the funds rate was already well below 2.0 %, averaging 1.45 % 10/29: FOMC votes to cut funds rate to 1 % from 1.5% – But for the 2 weeks ending Oct 29, the funds rate was already well below 1.5 %, averaging.76 % 12/16: FOMC votes to cut funds rate to 0-.25% from 1% – But for the 2 weeks ending Dec 17, the rate was already in that range, averaging.14 % Thus, decisions to increase reserve balances drove down the funds rate rather than the FOMC decisions about the target rate.

18
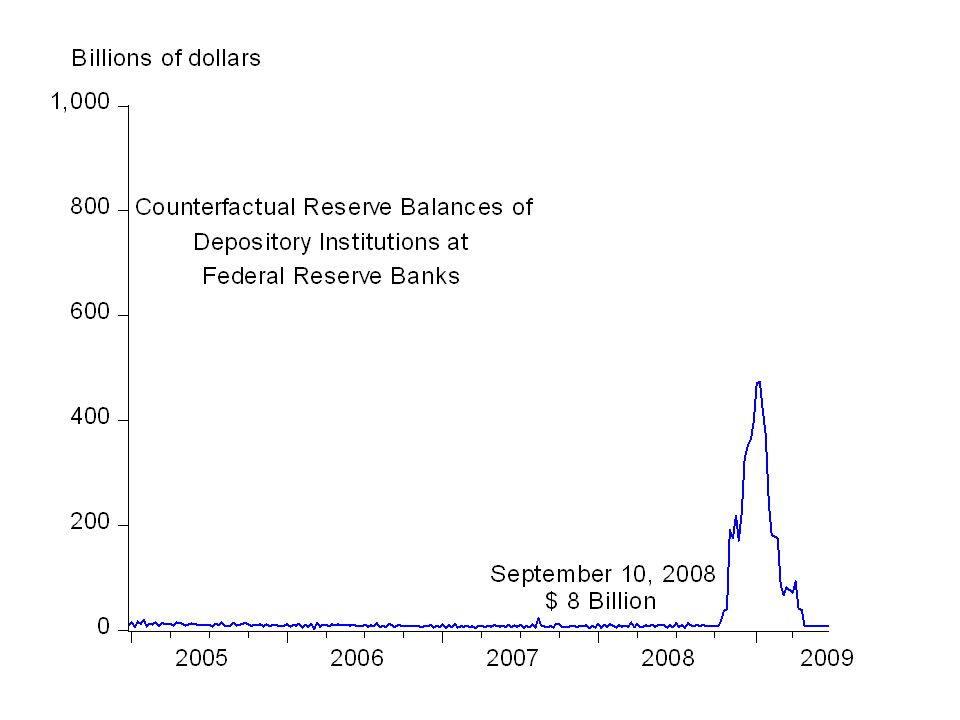
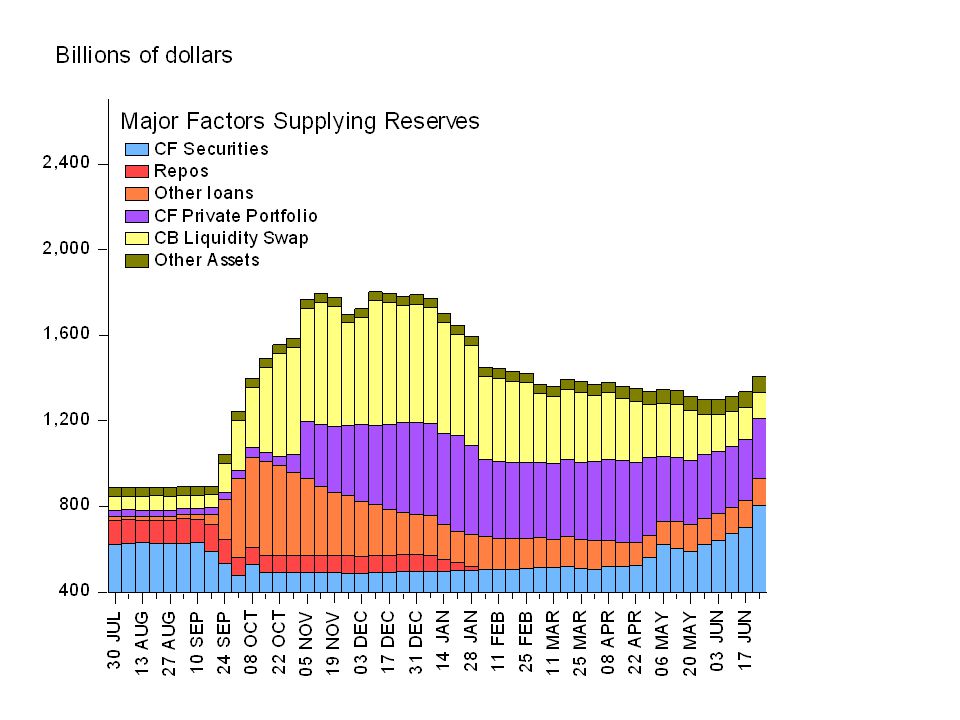
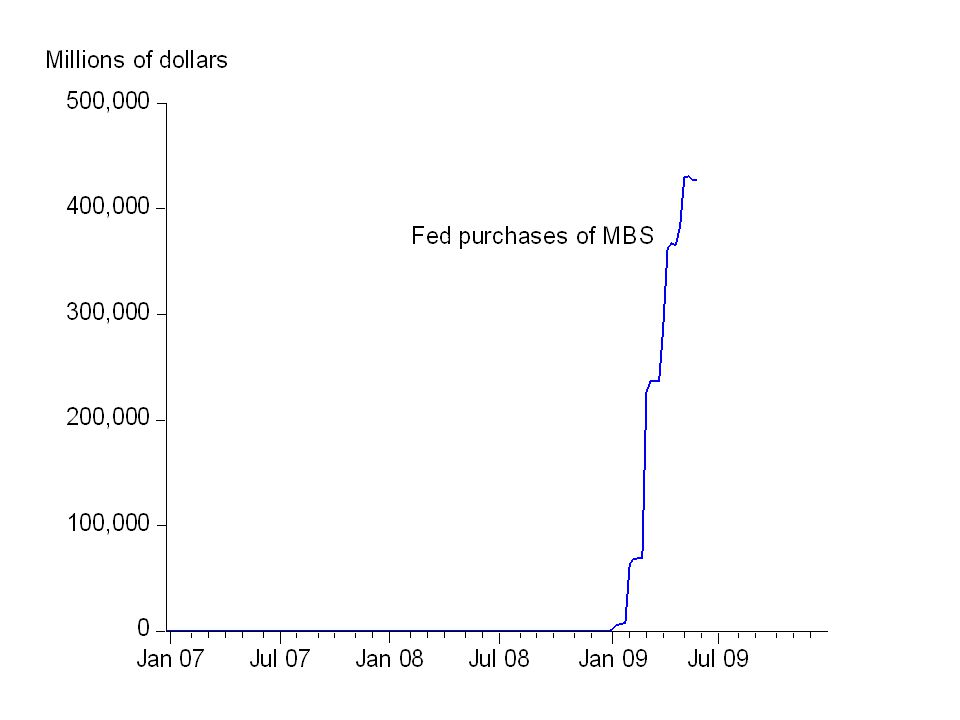
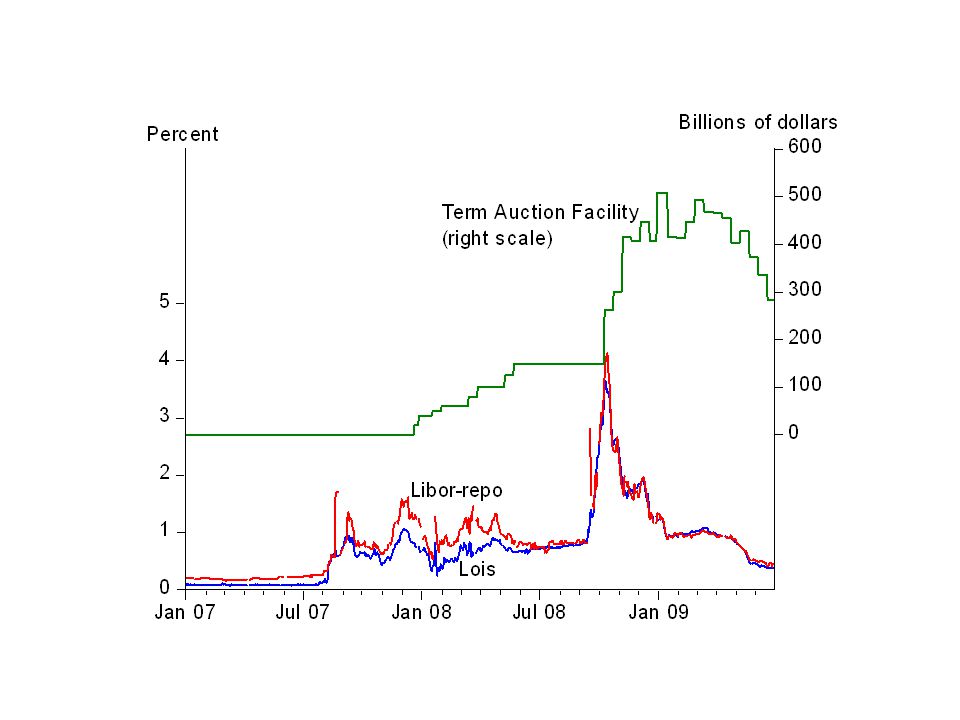
Choosing a Counterfactual Monetary Policy A general counterfactual: When the optimal interest rate (e.g. Taylor rule) hits zero (or slightly positive, say.25%) Trading Desk keeps reserve balances at a level consistent with.25 % and keeps the growth rate of money from falling – like a CGRR This is how quantitative monetary models are usually simulated for policy evaluation. (Wieland presentation yesterday) Avoids Great Depression or Japan Lost Decade mistakes where money growth declined A more specific counterfactual, closer to actual policy: MBS = $0 (rather than $500B and rising to $1,200B) TAF = $0 (rather than as much as $500B), Purchases of LT Treasuries = $0 (rather than up $300B)
 hits zero (or slightly positive, say.25%) Trading Desk keeps reserve balances at a level consistent with.25 % and keeps the growth rate of money from falling – like a CGRR This is how quantitative monetary models are usually simulated for policy evaluation. (Wieland presentation yesterday) Avoids Great Depression or Japan Lost Decade mistakes where money growth declined A more specific counterfactual, closer to actual policy: MBS = $0 (rather than $500B and rising to $1,200B) TAF = $0 (rather than as much as $500B), Purchases of LT Treasuries = $0 (rather than up $300B).")
33
What About Fiscal Policy? What should be the counterfactual? – Only the automatic stabilizers? No stimulus package in 2008? No stimulus package in 2009? Still too early for 2009, but here is a preliminary look…

34
Here We Go Again?

35
Deficit, Federal Government Purchases, and Transfers to State and Local Governments for Purchases of Goods and Services in the February 2009 Stimulus Legislation (billions of dollars) FiscalIncrease IncreaseIncrease Yearin Federalin Transfers toin Federal PurchasesStates, LocalitiesDeficit 20092148184 201047107400 20114647134 201236836 201325427 101427022 20151105 2016-20-8 2017-30-7 2018-20-6 Table 3 from Cogan, Cwik, Taylor, Wieland (2009) What about government purchases?
 FiscalIncrease IncreaseIncrease Yearin Federalin Transfers toin Federal PurchasesStates, LocalitiesDeficit Table 3 from Cogan, Cwik, Taylor, Wieland (2009) What about government purchases")
36
New Keynesian Estimate of Impact of Government Purchases G is about as forecast by CCTW in Q1 and Q2

38
Conclusion The financial crisis demonstrates the need for real time policy evaluation. – Fast-moving events, unprecedented policy responses – 24 hr news cycle, blogs, quick spread of 1 st idea – Good policy depends on it – Will not end with the crisis We now can collect and process data rapidly. – No reason to wait 30 years as Friedman/Schwartz Can do better: – More higher-frequency data (eg. Diebold) – Improved techniques (eg. Svensson) – Better outlets (Journal of Real Time Policy Evaluation)
 – Improved techniques (eg. Svensson) – Better outlets (Journal of Real Time Policy Evaluation).")
Similar presentations