Download presentation
Presentation is loading. Please wait.

1
Trade, Tariffs, & the Ag Economy
May 12, 2018 Chad Hart Associate Professor/Crop Marketing Specialist 1 1

2
Net Farm Income Source: USDA

3
Farm Debt Source: Federal Reserve

4
Ag Economic Summary Agricultural production and consumption has grown rapidly over the past several years. But when production exceeds consumption, prices fall. Crop revenues peaked in , while livestock revenues crested in , leading to record farm incomes. Since then net farm income has been cut in half. While the percentage loss in substantial, net farm income remains above levels from the early 2000’s. Farmers and ranchers have partially compensated for the loss in income by taking on higher debt loads. Farm and ranch balance sheets are eroding and financial stress is building for some producers, but the financial issues are not as severe as during the 1980’s. If agricultural prices slowly improve (as projected), the squeeze on farm finances will improve as well. But for some producers, the squeeze may be too much.
, the squeeze on farm finances will improve as well. But for some producers, the squeeze may be too much.")
5
Iowa’s Economy as an Example

6
Links to Manufacturing
Farm Machinery

7
Links to Government Dept. of Ag.

8
Links to Real Estate Farm Leases

9
Links to Finance and Insurance
Crop Insurance

10
Links to the Rest of the Economy

11
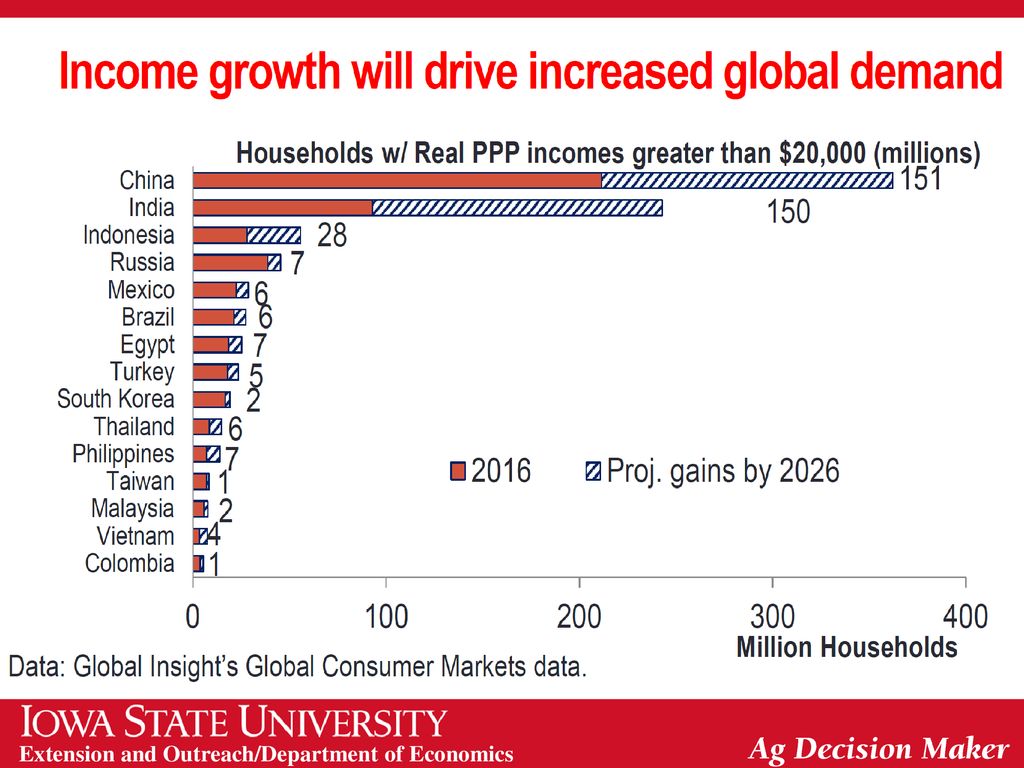
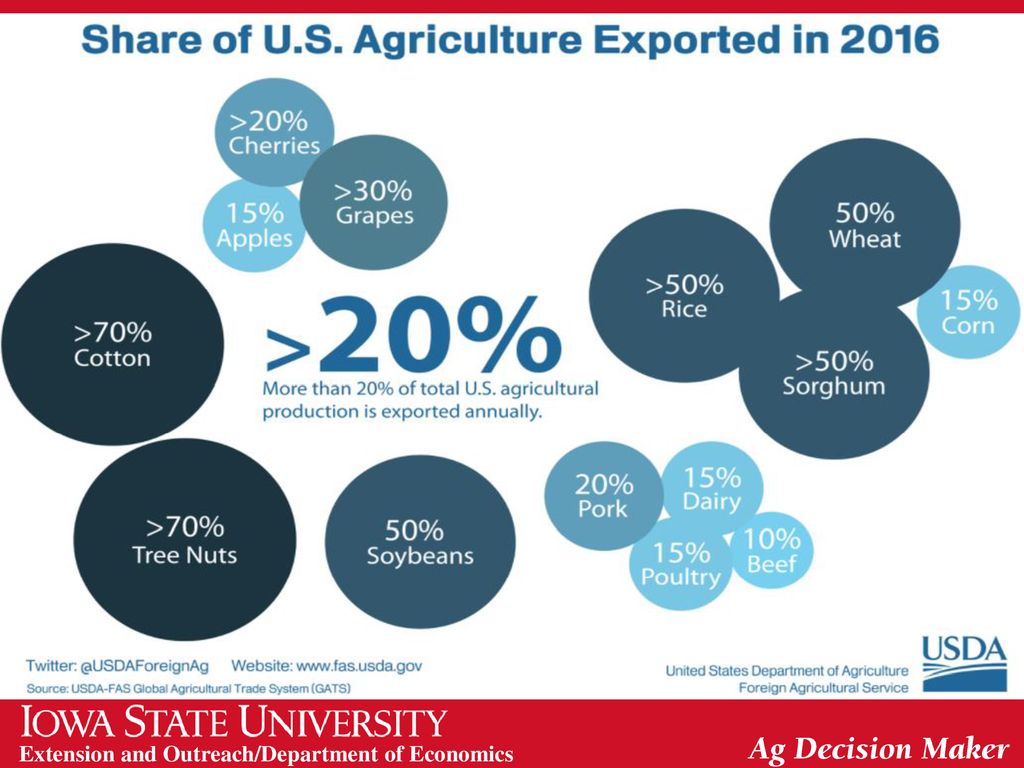
Why do U.S. farmers need export markets?
That’s where the customers are That’s where the economic growth is That’s where the consumption growth is We produce surpluses We only eat high on the hog Exports are crucial to farm income

12
96% of the world’s population lives outside the US
Source: CIA World Factbook

13
Population growth 2017 to 2050 Source: World Bank

14
Economic growth rates Source: CIA World Factbook

17
Top ten US ag export markets, 2016
Source: US Census Bureau, Foreign Trade Statistics, FATUS export aggregations

18
Top 10 ag exporting states, 2016
Source: USDA Economic Research Service, “State Export Data”

19
Beef Export Shifts Source: USDA-FAS

20
Pork Export Shifts Source: USDA-FAS

21
Sorghum Export Shifts Source: USDA-FAS

22
Soybean Export Shifts Source: USDA-FAS

23
Corn Export Shifts Source: USDA-FAS

24
Wheat Export Shifts Source: USDA-FAS

25
Rice Export Shifts Source: USDA-FAS

26
Cotton Export Shifts Source: USDA-FAS

27
Ethanol Exports Source: EIA

28
Population vs. arable land
Share of global Share of global population arable land China 19% 5% India 17% 10% US 4% 13%

29
Arable land

30
Want to provide feedback on my presentation. https://www. surveymonkey

31
Thank you for your time. Any questions. My web site: http://www2. econ
Thank you for your time! Any questions? My web site: Iowa Farm Outlook: Ag Decision Maker:

Similar presentations