Download presentation
Presentation is loading. Please wait.

1
9 Pilot River Basins Coordination: JRC RWER Outcome: >> Better identification and prediction of pressures from agriculture >> Adapted technical measures (Catalogue) and indications of shortcomings and options
 and indications. of shortcomings and. options.")
3
# 2006 = Main problems (5) & characteristics
= Catalogue of Mitigation measures (PoM) = Illustrated through PRB case studies Odense, Weser, Pandivere, Gascogne, Guadalquivir, Ribble, Pinios 1: Nutrient Pollution + Agriculture principal pressure (N and P) + Easily >70% Groundwater bodies at risk; less for surface bodies + Indicators: Livestock density; tot. appl. Fertil.; N & P + Reduced retention capacity due to land reclamation, drainage + Trends are not uniform but mostly decreasing (less use of fertilizer) with local increases in intensive agriculture areas or livestock areas or new MS + In general Technical Measures seem successful, implementation not
 = Illustrated through PRB case studies. Odense, Weser, Pandivere, Gascogne, Guadalquivir, Ribble, Pinios. 1: Nutrient Pollution. + Agriculture principal pressure (N and P) + Easily >70% Groundwater bodies at risk; less for surface bodies. + Indicators: Livestock density; tot. appl. Fertil.; N & P + Reduced retention capacity due to land reclamation, drainage + Trends are not uniform but mostly decreasing (less use of fertilizer) with local increases in intensive agriculture areas or livestock areas or new MS. + In general Technical Measures seem successful, implementation not.")
4
High vulnerable groundwater areas, Pandivere
Annual trend for N (Weser) (Guadalquivir)
 (Guadalquivir)")
5
+ Agriculture is principal pressure: not adapted management
2: Pesticide Pollution + Agriculture is principal pressure: not adapted management (also past & present illegal uses Complex as: but urban, home & garden as well + Risk to surface water and potable water resources; less for groundwater (depending on) + Lack of data on consumption and use: difficult to make relations to observed concentrations (no clear relation to different agricultural characteristics); difficult to measure as conc. may be very variable in time + integrated pest management and green farming reduced need for chemical treatments and introduced more adapted pesticide management without compromising yields Gascogne, Guadalquivir, Ribble
 + Lack of data on consumption and use: difficult to make relations to observed concentrations (no clear relation to different agricultural characteristics); difficult to measure as conc. may be very variable in time. + integrated pest management and green farming reduced need for chemical treatments and introduced more adapted pesticide management without compromising yields. Gascogne, Guadalquivir, Ribble.")
6
Number of detected pesticides
Garonne: Pesticides priority areas (in orange) and potable water resources (red points) not in conformity with regulation, because of pesticides pollution Pesticide samples over drinking threshold (1ug/l) (all colours) Diuron level in Ribble catchment sites (many below analytical limit of detection (the Drinking Water Standard (0.1ug/L)
 and potable water resources (red points) not in conformity with regulation, because of pesticides pollution. Pesticide samples over drinking threshold (1ug/l) (all colours) Diuron level in Ribble catchment sites. (many below analytical limit of detection (the Drinking Water Standard (0.1ug/L)")
7
+ Agriculture main pressures: <>80% extraction
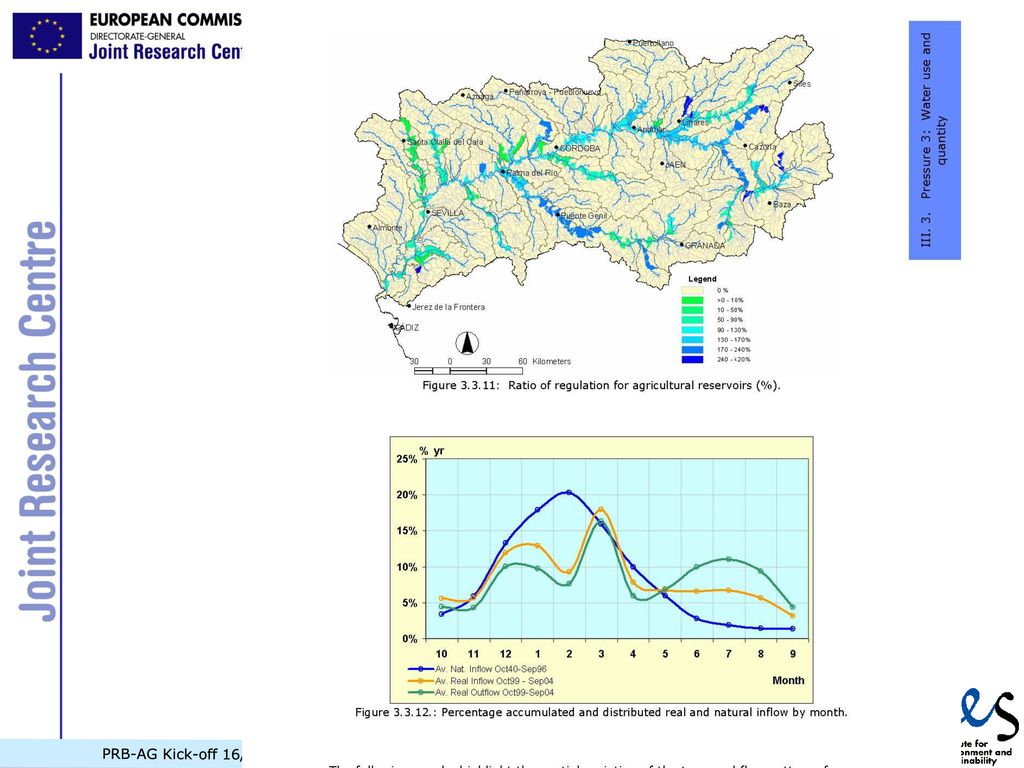
3:Water Quantity + More South, but not only (however no case studies) * continuous increase in water demand * difficult satisfying demands with new infrastructures due to environm. impacts * overuse of groundwater bodies * diff. In public management + Agriculture main pressures: <>80% extraction + Decrease consumption/ha, but more area, extension into traditionally not irrigated crops (olives) or crop species not adapted to med. climate + Experience for measures; but bad uptake (infrastructure, techniques…) +indicator for pressure of reservoir effect on natural hydrological regime = ratio between reservoir capacity and average annual natural inflow (avg. 103; max 420) Guadalquivir, Zagyva Tarna
 * continuous increase in water demand. * difficult satisfying demands with new infrastructures due to environm. impacts. * overuse of groundwater bodies. * diff. In public management. + Agriculture main pressures: <>80% extraction. + Decrease consumption/ha, but more area, extension into traditionally not irrigated crops (olives) or crop species not adapted to med. climate. + Experience for measures; but bad uptake. (infrastructure, techniques…) +indicator for pressure of reservoir effect on natural hydrological regime = ratio between reservoir capacity and average annual natural inflow (avg. 103; max 420) Guadalquivir, Zagyva Tarna.")
8
Guadalquivir catchment
Zagyva-Tarna catchment Agriculture consumption at plot level (Hm3/year)
")
10
4:Sediments (as erosion and P-loss)
+ correlated to land use and agric. Practices + complex cause-effect analysis to indicate risk areas: new approaches - linking suspended solids and erosion potential: little correlation - testing P-index (P loss at field level by connectivity to stream, e.g. depending on buffer strip (linked to erosion): promising potential risk of P leaving the landform and travelling towards a waterbody (source factors: P field; P loss pathways ~soil erosion etc.) + clear measures, improved targeting (cfr. above), involvement low Ribble, Guadalquivir, Odense
: promising. potential risk of P leaving the landform and travelling towards a waterbody (source factors: P field; P loss pathways ~soil erosion etc.) + clear measures, improved targeting (cfr. above), involvement low. Ribble, Guadalquivir, Odense.")
11
Tot P loss as function of P-Index
(Odense catchment)
")
12
+ loss of wetland: mostly agriculture
Ribble, Guadalquivir, Odense 5: Habitat loss and physical modifications + loss of wetland: mostly agriculture (land reclamation, diking, drainage) + degraded status of riparian area (agriculture, but not prime pressure) > negative changes in hydrology, biodiversity habitats, erosion: needs more cause-effect analysis Fens and meadows in 1890 and 1992, Odense Ribble habitat monitoring sites and analyzed waterbodies
 + degraded status of riparian area (agriculture, but not prime pressure) > negative changes in hydrology, biodiversity habitats, erosion: needs more cause-effect analysis. Fens and meadows in 1890 and 1992, Odense. Ribble habitat monitoring sites and analyzed waterbodies.")
13
Olives in AEM classified as natural (full line), olives not in AEM classified as natural (dashed line), olives in AEM classified as bad (dotted line) and olives not in AEM classified as bad (dashed/dotted line).
, olives not in AEM classified as natural (dashed line), olives in AEM classified as bad (dotted line) and olives not in AEM classified as bad (dashed/dotted line).")
14
Programme of Measures (PoM)
+ need to deal better with in-situ problems; e.g. different scales of implementation >> Compiling Catalogue of Measures + technical measures can be developed/are +-tested/mostly successful, but: + farmer awareness lacking: + Quantitative definitions for thresholds lacking

15
Main experiences Reported experiences > knowledge sharing Article 5 reports are basis > identification & cause-effect (indicators) > measures Models, statistical (&spatial) methods, risk assessm.,model frameworks Knowledge needed on pathway processes Scales of analysis <> implementation of measures Definition of measures (CoM) Positive exchange process PRB is frame to network More sharing and in situ experience/examples needed
 methods, risk assessm.,model frameworks. Knowledge needed on pathway processes. Scales of analysis <> implementation of measures. Definition of measures (CoM) Positive exchange process. PRB is frame to network. More sharing and in situ experience/examples needed.")
16
Final report ready end of February 2007
Meeting with PRBs end of February (28/02-02/03) Next Phase PRB-Agriculture : - Build on the previous experiences to improve analysis and identification of pressures, - Improve/increase Catalogue of Measures - Test ‘real life’ implementation of PoM, related to Policy integration, farmer take-up etc. - Combine/link with economic and sociological studies - Pioneer Integrated RBMP SSG needs and suggestions …….
 Next Phase PRB-Agriculture : - Build on the previous experiences to improve analysis and identification of pressures, - Improve/increase Catalogue of Measures. - Test ‘real life’ implementation of PoM, related to Policy integration, farmer take-up etc. - Combine/link with economic and sociological studies. - Pioneer Integrated RBMP. SSG needs and suggestions …….")
Similar presentations


 Ramsar Convention on Wetlands (www.ramsar.org) Convention on Wetlands “The conservation and wise use of.>")


 Project.>")

 Valentina Villoria – Ömer Ceylan Coordination Workshop Preparation for.>")


